Food Intolerance Products Market Size and Share Forecast Outlook 2025 to 2035

The global food intolerance products market is valued at USD 11.1 billion in 2025. Demand is projected to reach approximately USD 21.6 billion by 2035, registering a CAGR of 6.9% over the forecast period.
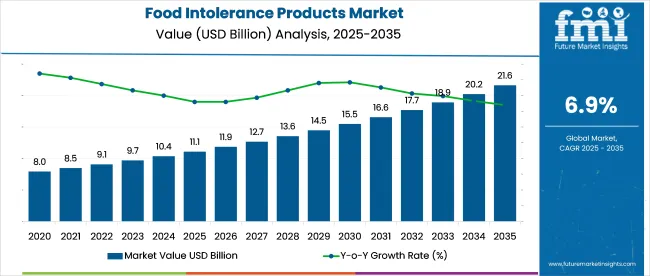
Quick Stats of Food Intolerance Products Market

  • Market Value (2025): USD 11.1 billion
  • Forecast Value (2035): USD 21.6 billion
  • Forecast CAGR (2025 to 2035): 6.9%
  • Product Leader in 2025: Lactose Intolerance Products (35.0% industry share)
  • Top Distribution Channel: Supermarkets & Hypermarkets (40.0% industry share)
  • Key Growth Region: India (CAGR: 6.3%)
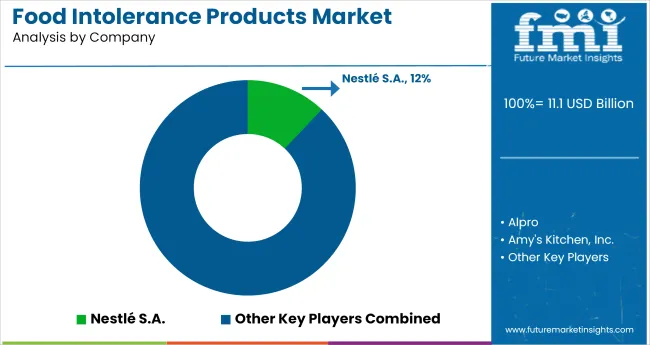
  • Leading Player: Nestlé S.A. (12% market share)

Food Intolerance Products Market

Attribute Detail
Industry Size (2025E) USD 11.1 billion
Industry Size (2035F) USD 21.6 billion
CAGR (2025 to 2035) 6.9%

The food intolerance products industry represents roughly 6% to 10% of its parent markets. Its strongest presence is in the free-from foods market, where it comprises around 25%, led by high demand for gluten-free and lactose-free options. In the health and wellness food sector, it accounts for approximately 8%, driven by rising dietary sensitivities and demand for cleaner ingredient labels.

Within the functional foods and beverages sectors, it holds a smaller share of about 5%, as many intolerance-friendly products overlap with functional health claims. The specialty foods industry witnesses a contribution of nearly 10%, fueled by niche product development. In the dietary supplements space, its share is close to 2%, primarily through digestive support solutions.

Nestlé is advancing its plant-based strategy with product innovations that serve both health-oriented consumers and those with dietary restrictions. According to the company, offerings such as gluten-free cauliflower crust pizza and natural bliss oat milk are designed to meet this dual demand without sacrificing accessibility or taste. At Expo West 2023, Nestlé introduced over 35 new intolerance-friendly products, positioning itself to capture a share of the projected USD 26 billion industry by 2032. This expansion reflects the company’s focus on scalable formulations that align with evolving consumer preferences in the food intolerance segment.

Analyzing Food Intolerance Products Market by Top Investment Segments

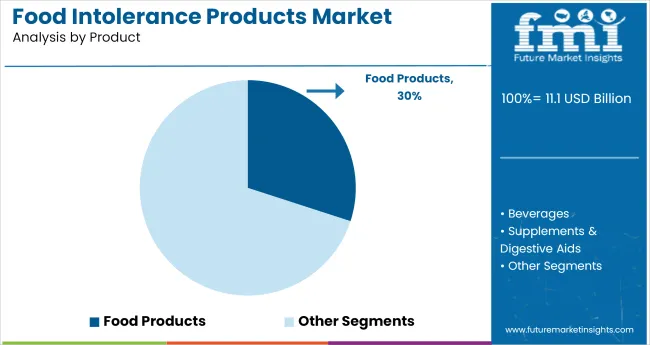
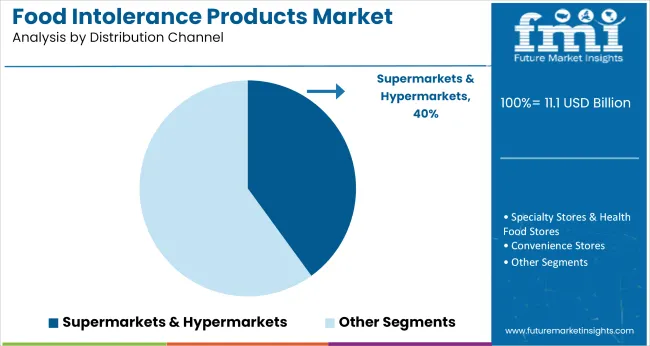
Growth in the industry is driven by heightened awareness of dietary sensitivities and functional nutrition. Lactose-free products hold a 35.0% share, followed by food products at 30%, while supermarkets lead distribution with a 40.0% channel share.
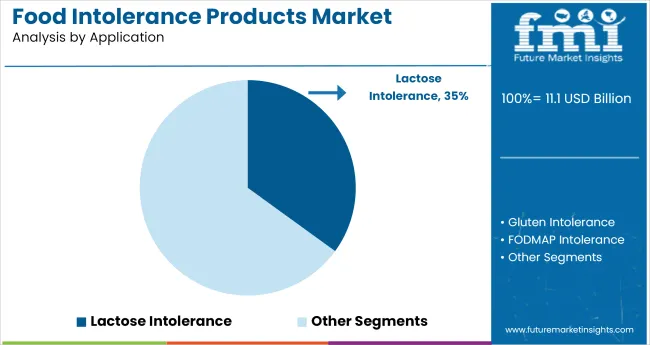
Lactose-Free Offerings Dominate Due to 35% Market Share

Food Intolerance Products Market Analysis By Application

Rising cases of dairy intolerance globally have led to lactose-free products commanding 35.0% of the total market. In regions such as East Asia and sub-Saharan Africa, lactose malabsorption affects over 65% of the population, contributing to strong demand for dairy alternatives. Manufacturers like Alpro, Danone, and Silk now offer extended portfolios of almond, oat, and rice-based milks, yogurts, and creamers. Product reformulation has focused on achieving protein content parity (~3g/100ml) with cow’s milk and maintaining calcium fortification standards above 100mg per serving.
  • Plant-based alternatives now represent 60-70% of SKUs within the lactose-free aisle
  • Fortified beverages often target 30% daily calcium intake per serving
  • Regional lactose-free product launches rose by 22% YoY in 2024 across Asia

Food Products Retain 30% Share Driven by Allergen-Free Innovation

Food Intolerance Products Market Analysis By Product

Driven by consumer demand for gluten-free, lactose-free, and nut-free offerings food products hold a 30% share of the market, Manufacturers are reformulating staple items such as pasta, cereals, and snacks using rice, buckwheat, and millet flours to match texture and nutritional quality. Leading brands like Enjoy Life Foods, Schär, and Made Good produce over 500 SKUs collectively, covering common allergens. 45-50% of free-from food launches in 2024 focused on bakery and snack items. Shelf-stable innovation has improved product lifespan from 6 to 9 months, reducing waste and returns.
  • Gluten-free snacks now account for 48% of intolerance-based packaged food launches
  • Up to 70% of allergen-free food buyers actively check ingredient panels before purchase
  • Retailers report 22% higher turnover of intolerance-specific shelf units vs conventional units

Supermarkets Lead with 40% Share Across Retail Distribution

Food Intolerance Products Market Analysis By Distribution Channel

Supermarkets and hypermarkets dominate the retail landscape, accounting for 40.0% of total sales in allergen-free food industry. Chains like Walmart, Carrefour, and Tesco now allocate over 15 to 20 shelf facings per aisle for free-from categories. Consumers benefit from visibility, in-store sampling, and direct brand comparisons under one roof. Surveys indicate that 65% of buyers prefer to purchase intolerance products in physical stores for label scrutiny and assurance. Promotional offers on allergy-friendly and certified goods (e.g., gluten-free, dairy-free) have increased trial rates across general shoppers.

  • Up to 40% of monthly retail food intolerance sales occur via discount-driven campaigns
  • Shelf space allocation to intolerance SKUs increased by 18% YoY in major retailers
  • In-store purchases outperform online by 2.5x in terms of new product discovery

Top Food Intolerance Products Market Dynamics

The industry is evolving through clean-label innovations and improved intolerance awareness. Manufacturers are offering allergen-free, gluten-free, and lactose-free options to meet rising consumer demand for health and transparency.

Formulation Adjustments Drive SKU Consolidation in Retail Channels

Retailers in the UK, Germany, and Australia have trimmed lactose-free and gluten-free product assortments by 14% between Q3 2024 and Q1 2025 to reduce shelf redundancy and improve sell-through. Private-label players prioritized high-velocity lines, specifically almond-based milk and rice-based pasta-triggering a 19% delisting of slow-turning SKUs like quinoa-flour wraps and oat yogurt variants. Reformulation toward dual-intolerance claims (e.g., dairy- and gluten-free) rose 11% across European listings, enabling multipurpose positioning without requiring added shelf space.

Enzyme-Based Solutions Gain Clinical and Commercial Traction

A 2024 meta-analysis by Monash University confirmed that lactase and alpha-galactosidase enzyme supplements reduced IBS-related symptoms in 67% of food intolerance cases when taken pre-consumption. This validation prompted functional food manufacturers to incorporate microencapsulated enzymes into ready-to-drink nutritional beverages and meal replacement shakes. In the USA, market tracking shows a 22% increase in enzyme-fortified SKUs among intolerance-targeted products over 12 months. South Korea’s top three pharmacy chains began stocking these products in Q1 2025, correlating with a 15% lift in same-store supplement sales.

Cost Headwinds from Specialty Inputs and Packaging Materials

Ingredient inflation continues to compress margins, with rice starch and pea protein isolate prices up 12% and 9% YoY, as of May 2025. Specialty ingredient suppliers in India and Thailand cite poor harvests and cross-border regulatory delays as key contributors. also the multilayer PET film used in allergen-barrier pouches has risen 16% in price due to globe feedstock shortages. These input cost hikes have outpaced the 5-6% average shelf price increases in North America and Western Europe, resulting in a gross margin squeeze across intolerance-focused brands.
Top Countries Driving, Adopting, and Shaping the Food Intolerance Products Market Landscape

Country Wise Analysis Of Food Intolerance Products Market

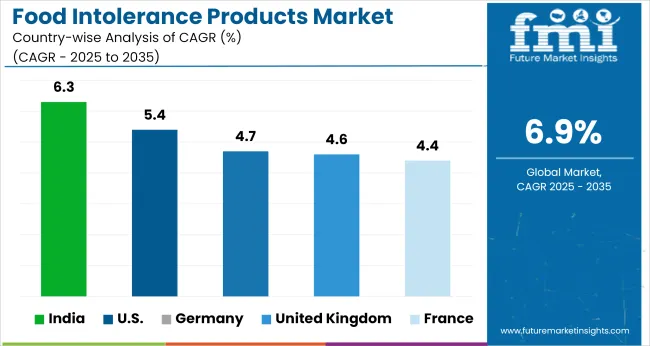
Countries CAGR (2025 to 2035)
United States 5.4%
United Kingdom 4.6%
Germany 4.7%
France 4.4%
India 6.3%

Global demand for allergen-free food is expected to expand at a 6.9% CAGR between 2025 and 2035. India, a BRICS member, records 6.3%, trailing the global average by just 9%, indicating relatively aligned momentum. By contrast, OECD markets display slower growth: The United States posts 5.4% (-22% gap), Germany 4.7% (-32%), the United Kingdom 4.6% (-33%), and France 4.4% (-36%).

These deviations suggest maturity in product penetration and tighter competition in Western markets. India’s performance stems from growing health awareness and wider product accessibility in metro and secondary regions. Slower pace in OECD economies can be linked to already well-established intolerance offerings and plateauing consumer conversion. The divergence between BRICS and OECD economies shows how regional dynamics-ranging from evolving dietary habits to varying health infrastructure-continue to shape the pace of growth in this segment.

The report covers detailed analysis of 40+ countries, with the top five countries shared as a reference.

Strategic Overview of Food Intolerance Products Market in the United States

The USA food intolerance products industry is projected to grow at a CAGR of 5.4% from 2025 to 2035. Consumer adoption of gluten-free, lactose-free, and nut-free alternatives is rising steadily, supported by technological integration in food sensitivity diagnostics. A 2024 national survey indicated that over 30% of USA households actively avoid at least one major allergen. Food manufacturers are increasingly reformulating legacy products, while direct-to-consumer brands are scaling their allergen-free portfolios through subscription models.

  • 31% of USA adults follow allergen-elimination diets, led by gluten and lactose exclusions
  • Allergen-free product launches rose 18% YoY, with snacks and meal kits driving category expansion
  • Mobile diagnostics and digital intolerance tracking tools increased consumer-led product discovery by 44%

Regulatory-Driven Momentum in the United Kingdom’s Food Intolerance Products Market

The UK industry is advancing at a 4.6% CAGR, underpinned by strong regulatory enforcement and heightened consumer awareness. Following the implementation of Natasha’s Law, clear allergen labeling has become central to consumer trust. According to Coeliac UK, 1 in 10 UK consumers follows a gluten-free diet-either due to diagnosis or lifestyle preference. Demand has sharply increased for lactose-free yogurts, gluten-free breads, and low-FODMAP ready meals, especially across major grocery chains.

  • 40% of newly launched SKUs in 2024 carried “free-from” claims, largely in ambient and frozen categories
  • Low-FODMAP product sales rose 19%, with digestion-friendly snacks and sauces seeing peak demand
  • 28% of UK households buy gluten-free goods weekly, with strong penetration among urban consumers

Ingredient Transparency Shaping Germany’s Food Intolerance Products Market

The intolerance-focused food sector in Germany is projected to expand at a CAGR of 4.7% through 2035. Ingredient transparency and product certification remain critical drivers, with over 66% of shoppers reviewing ingredient labels before purchase. The sector shows strong preference for gluten-free bakery products, lactose-free dairy, and soy-free alternatives. Multinational and regional manufacturers continue to focus on clean formulation, backed by EU-compliant allergen labeling.

  • Certified organic gluten-free breads grew 14.6% YoY, driven by bakeries offering additive-free options
  • Lactose-free dairy holds a 32% share of Germany’s dairy alternatives segment, led by oat and almond-based SKUs
  • 42% of intolerance shoppers cite “clean label” and “Bio certification” as primary purchase influencers

Cultural Realignment in France’s Food Intolerance Products Market

The industry in France is evolving at a CAGR of 4.4%, shaped by consumer shifts toward health-aware, intolerance-friendly options. A growing segment of French consumers is embracing allergen-free diets, with gluten-free bakery and lactose-free dairy products gaining mainstream acceptance. Government-backed nutrition programs and food education campaigns are driving demand for labeled and reformulated products.

  • Gluten-free bakery sales increased 18.5%, led by biscuits, baguettes, and pastries in the health segment
  • Lactose-free yogurts and dairy alternatives grew 16.2% YoY, especially among consumers aged 25-40
  • Over 1,200 new intolerance-friendly products launched since 2022, many backed by AFDIAG-compliant certifications

Demand Trajectory of Allergen-Free Food Market in India

India is projected to lead global growth in intolerance food products with a steady CAGR of 6.3% from 2025 to 2035. Rising diagnoses of celiac disease, lactose intolerance, and nut allergies are contributing to strong uptake in allergen-specific products. A 2024 study by FSSAI found that 72% of urban Indian shoppers actively check food labels for allergen warnings. Millet-based flours, nut-free sweets, and lactose-free dairy alternatives are increasingly used in mainstream cooking.
  • Millet-based gluten-free product launches surged 34.5% YoY, with strong uptake in ready-to-cook mixes
  • Over 700 lactose-free SKUs introduced in 2024, especially in flavored milks and traditional desserts
  • Allergen-free fusion products integrating turmeric, ashwagandha, and moringa rose 39% in new product development

Leading Food Intolerance Products Suppliers, Manufacturers, Suppliers, Distributors

Food Intolerance Products Market Analysis By Company

The industry is structured around established multinational brands and smaller companies targeting niche dietary segments. Companies such as Nestlé S.A., Danone S.A., and General Mills Inc. retain a competitive edge by scaling their distribution and investing in research tied to lactose-free dairy and plant-derived alternatives.

Nestlé has expanded its oat-based beverage range, while Danone has grown its footprint through acquisitions in the free-from category, helping them address varying consumer dietary patterns. Smaller players like Dr. Schär AG/SPA and Amy’s Kitchen Inc. cater to specific gluten-free and organic demands. Barriers to entry remain high, driven by regulatory complexities, established retail partnerships, and ongoing brand-led innovation.

Recent Food Intolerance Products Market News

In 2024, Nestlé, through its Orgain brand, launched "Better Whey," an innovative animal-free, lactose-free whey protein powder produced using precision fermentation. This product replicates the nutritional profile of traditional whey, including all nine essential amino acids, while eliminating lactose, cholesterol, and animal-derived components. Marketed as easier to digest and more sustainable, Better Whey reflects Nestlé’s focus on clean-label, allergy-friendly offerings to meet the rising demand for allergen-free food industry in the USA specialty nutrition and plant-based industries.

Leading Players

  • Alpro
  • Amy's Kitchen, Inc.
  • Conagra Brands, Inc.
  • Daiya Foods Inc.
  • Danone S.A.
  • Dr. Schär AG/SPA
  • Enjoy Life Foods (Mondelēz International)
  • Follow Your Heart
  • Fody Food Co.
  • General Mills, Inc.
  • Glutino (The Glutino Food Group)
  • Kellogg Company
  • Lactaid (McNeil Nutritionals, LLC)
  • Mondelēz International, Inc.
  • Nestlé S.A.
  • Oatly Group AB
  • The Hain Celestial Group, Inc.
  • The Kraft Heinz Company
  • The Lactalis Group
  • Udis Gluten Free (Boulder Brands, Inc.)

Report Scope

Report Attributes Details
Market Size (2025) USD 11.1 billion
Projected Market Size (2035) USD 21.6 billion
CAGR (2025 to 2035) 6.9%
Base Year for Estimation 2024
Historical Period 2020 to 2024
Projections Period 2025 to 2035
Quantitative Units USD billion for value and million units for volume
Intolerance Types Analyzed (Segment 1) Lactose intolerance products, Gluten intolerance products, Fodmap intolerance products, Histamine intolerance products, Sulfite intolerance products, Other intolerance products
Product Categories Analyzed (Segment 2) Food Products, Beverages and Supplements & Digestive Aids
Distribution Channels Analyzed (Segment 3) Supermarkets & hypermarkets, Specialty stores & health food stores, Convenience stores, Online retail, E-commerce platforms, Direct-to-consumer websites, Subscription services, Pharmacies & drugstores, Foodservice & HoReCa, Others
Regions Covered North America, Europe, Asia Pacific, Latin America, the Middle East and Africa
Countries Covered United States, Canada, United Kingdom, Germany, France, Italy, Spain, Netherlands, China, India, Japan, South Korea, Australia, Brazil, Mexico, Argentina, UAE, Saudi Arabia, South Africa
Key Players Alpro, Amy's Kitchen, Inc., Conagra Brands, Inc., Daiya Foods Inc., Danone S.A., Dr. Schär AG/SPA, Enjoy Life Foods (Mondelēz International), Follow Your Heart, Fody Food Co., General Mills, Inc., Glutino (The Glutino Food Group), Kellogg Company, Lactaid (McNeil Nutritionals, LLC), Mondelēz International, Inc., Nestlé S.A., Oatly Group AB, The Hain Celestial Group, Inc., The Kraft Heinz Company, The Lactalis Group, Udis Gluten Free (Boulder Brands, Inc.)
Additional Attributes Dollar sales, share by intolerance and product type, demand rise in gluten-free and lactose-free categories, innovations in dairy alternatives, role of e-commerce in specialty product growth, regional dietary preference shifts

Food Intolerance Products Market Analyzed by Key Investment Segments

By Product:

The industry is segmented by product into food products, beverages, supplements & and digestive aids.

By Application:

By application, the market covers lactose intolerance, gluten intolerance, FODMAP intolerance, histamine intolerance, sulfite intolerance, and other intolerance types.

By Distribution Channel:

Supermarkets & Hypermarkets, Specialty Stores & Health Food Stores, Convenience Stores, Online Retail (E-commerce Platforms, Direct-to-Consumer Websites, Subscription Services), Pharmacies & Drugstores, Foodservice & HoReCa, Others.

By Region:

North America (USA, Canada), Europe (Germany, UK, France, Spain, Italy, Netherlands, Rest of Europe), Asia Pacific (China, Japan, India, Australia, South Korea, Rest of Asia Pacific), Latin America (Brazil, Mexico, Argentina, Rest of Latin America), Middle East and Africa (South Africa, Saudi Arabia, UAE, Rest of Middle East and Africa).

Table of Content

  1. Executive Summary
    • Global Market Outlook
    • Demand-side Trends
    • Supply-side Trends
    • Technology Roadmap Analysis
    • Analysis and Recommendations
  2. Market Overview
    • Market Coverage / Taxonomy
    • Market Definition / Scope / Limitations
  3. Market Background
    • Market Dynamics
      • Drivers
      • Restraints
      • Opportunity
      • Trends
    • Scenario Forecast
      • Demand in Optimistic Scenario
      • Demand in Likely Scenario
      • Demand in Conservative Scenario
    • Opportunity Map Analysis
    • Product Life Cycle Analysis
    • Supply Chain Analysis
      • Supply Side Participants and their Roles
        • Producers
        • Mid-Level Participants (Traders/ Agents/ Brokers)
        • Wholesalers and Distributors
      • Value Added and Value Created at Node in the Supply Chain
      • List of Raw Material Suppliers
      • List of Existing and Potential Buyer’s
    • Investment Feasibility Matrix
    • Value Chain Analysis
      • Profit Margin Analysis
      • Wholesalers and Distributors
      • Retailers
    • PESTLE and Porter’s Analysis
    • Regulatory Landscape
      • By Key Regions
      • By Key Countries
    • Regional Parent Market Outlook
    • Production and Consumption Statistics
    • Import and Export Statistics
  4. Global Market Analysis 2020 to 2024 and Forecast, 2025 to 2035
    • Historical Market Size Value (USD Billion) & Volume (MT) Analysis, 2020 to 2024
    • Current and Future Market Size Value (USD Billion) & Volume (MT) Projections, 2025 to 2035
      • Y-o-Y Growth Trend Analysis
      • Absolute $ Opportunity Analysis
  5. Global Market Pricing Analysis 2020 to 2024 and Forecast 2025 to 2035
  6. Global Market Analysis 2020 to 2024 and Forecast 2025 to 2035, By Product
    • Introduction / Key Findings
    • Historical Market Size Value (USD Billion) & Volume (MT) Analysis By Product, 2020 to 2024
    • Current and Future Market Size Value (USD Billion) & Volume (MT) Analysis and Forecast By Product, 2025 to 2035
      • Food Products
      • Beverages
      • Supplements & Digestive Aids
    • Y-o-Y Growth Trend Analysis By Product, 2020 to 2024
    • Absolute $ Opportunity Analysis By Product, 2025 to 2035
  7. Global Market Analysis 2020 to 2024 and Forecast 2025 to 2035, By Application
    • Introduction / Key Findings
    • Historical Market Size Value (USD Billion) & Volume (MT) Analysis By Application, 2020 to 2024
    • Current and Future Market Size Value (USD Billion) & Volume (MT) Analysis and Forecast By Application, 2025 to 2035
      • Lactose Intolerance
      • Gluten Intolerance
      • FODMAP Intolerance
      • Histamine Intolerance
      • Sulfite Intolerance
      • Other Intolerance Types
    • Y-o-Y Growth Trend Analysis By Application, 2020 to 2024
    • Absolute $ Opportunity Analysis By Application, 2025 to 2035
  8. Global Market Analysis 2020 to 2024 and Forecast 2025 to 2035, By Distribution Channel
    • Introduction / Key Findings
    • Historical Market Size Value (USD Billion) & Volume (MT) Analysis By Distribution Channel, 2020 to 2024
    • Current and Future Market Size Value (USD Billion) & Volume (MT) Analysis and Forecast By Distribution Channel, 2025 to 2035
      • Supermarkets & Hypermarkets
      • Specialty Stores & Health Food Stores
      • Convenience Stores
      • Online Retail
        • E-commerce Platforms
        • Direct-to-Consumer Websites
        • Subscription Services
      • Pharmacies & Drugstores
      • Foodservice & HoReCa
      • Others
    • Y-o-Y Growth Trend Analysis By Distribution Channel, 2020 to 2024
    • Absolute $ Opportunity Analysis By Distribution Channel, 2025 to 2035
  9. Global Market Analysis 2020 to 2024 and Forecast 2025 to 2035, By Region
    • Introduction
    • Historical Market Size Value (USD Billion) & Volume (MT) Analysis By Region, 2020 to 2024
    • Current Market Size Value (USD Billion) & Volume (MT) Analysis and Forecast By Region, 2025 to 2035
      • North America
      • Latin America
      • Western Europe
      • Eastern Europe
      • East Asia
      • South Asia & Pacific
      • Middle East and Africa
    • Market Attractiveness Analysis By Region
  10. North America Market Analysis 2020 to 2024 and Forecast 2025 to 2035, By Country
    • Historical Market Size Value (USD Billion) & Volume (MT) Trend Analysis By Market Taxonomy, 2020 to 2024
    • Market Size Value (USD Billion) & Volume (MT) Forecast By Market Taxonomy, 2025 to 2035
      • By Country
        • USA
        • Canada
        • Mexico
      • By Product
      • By Application
      • By Distribution Channel
    • Market Attractiveness Analysis
      • By Country
      • By Product
      • By Application
      • By Distribution Channel
    • Key Takeaways
  11. Latin America Market Analysis 2020 to 2024 and Forecast 2025 to 2035, By Country
    • Historical Market Size Value (USD Billion) & Volume (MT) Trend Analysis By Market Taxonomy, 2020 to 2024
    • Market Size Value (USD Billion) & Volume (MT) Forecast By Market Taxonomy, 2025 to 2035
      • By Country
        • Brazil
        • Argentina
        • Rest of LATAM
      • By Product
      • By Application
      • By Distribution Channel
    • Market Attractiveness Analysis
      • By Country
      • By Product
      • By Application
      • By Distribution Channel
    • Key Takeaways
  12. Western Europe Market Analysis 2020 to 2024 and Forecast 2025 to 2035, By Country
    • Historical Market Size Value (USD Billion) & Volume (MT) Trend Analysis By Market Taxonomy, 2020 to 2024
    • Market Size Value (USD Billion) & Volume (MT) Forecast By Market Taxonomy, 2025 to 2035
      • By Country
        • Germany
        • Italy
        • France
        • UK
        • Spain
        • BENELUX
        • Nordic
        • Rest of W.Europe
      • By Product
      • By Application
      • By Distribution Channel
    • Market Attractiveness Analysis
      • By Country
      • By Product
      • By Application
      • By Distribution Channel
    • Key Takeaways
  13. Eastern Europe Market Analysis 2020 to 2024 and Forecast 2025 to 2035, By Country
    • Historical Market Size Value (USD Billion) & Volume (MT) Trend Analysis By Market Taxonomy, 2020 to 2024
    • Market Size Value (USD Billion) & Volume (MT) Forecast By Market Taxonomy, 2025 to 2035
      • By Country
        • Russia
        • Hungary
        • Poland
        • Balkan & Baltics
        • Rest of E. Europe
      • By Product
      • By Application
      • By Distribution Channel
    • Market Attractiveness Analysis
      • By Country
      • By Product
      • By Application
      • By Distribution Channel
    • Key Takeaways
  14. East Asia Market Analysis 2020 to 2024 and Forecast 2025 to 2035, By Country
    • Historical Market Size Value (USD Billion) & Volume (MT) Trend Analysis By Market Taxonomy, 2020 to 2024
    • Market Size Value (USD Billion) & Volume (MT) Forecast By Market Taxonomy, 2025 to 2035
      • By Country
        • China
        • Japan
        • South Korea
      • By Product
      • By Application
      • By Distribution Channel
    • Market Attractiveness Analysis
      • By Country
      • By Product
      • By Application
      • By Distribution Channel
    • Key Takeaways
  15. South Asia & Pacific Market Analysis 2020 to 2024 and Forecast 2025 to 2035, By Country
    • Historical Market Size Value (USD Billion) & Volume (MT) Trend Analysis By Market Taxonomy, 2020 to 2024
    • Market Size Value (USD Billion) & Volume (MT) Forecast By Market Taxonomy, 2025 to 2035
      • By Country
        • India
        • Australia & New Zealand
        • ASEAN
        • Rest of SAP
      • By Product
      • By Application
      • By Distribution Channel
    • Market Attractiveness Analysis
      • By Country
      • By Product
      • By Application
      • By Distribution Channel
    • Key Takeaways
  16. Middle East and Africa Market Analysis 2020 to 2024 and Forecast 2025 to 2035, By Country
    • Historical Market Size Value (USD Billion) & Volume (MT) Trend Analysis By Market Taxonomy, 2020 to 2024
    • Market Size Value (USD Billion) & Volume (MT) Forecast By Market Taxonomy, 2025 to 2035
      • By Country
        • GCC Countries
        • Northern Africa
        • South Africa
        • Turkiye
        • Rest of MEA
      • By Product
      • By Application
      • By Distribution Channel
    • Market Attractiveness Analysis
      • By Country
      • By Product
      • By Application
      • By Distribution Channel
    • Key Takeaways
  17. Key Countries Market Analysis
    • USA
      • Pricing Analysis
      • Market Share Analysis, 2024
        • By Product
        • By Application
        • By Distribution Channel
    • Canada
      • Pricing Analysis
      • Market Share Analysis, 2024
        • By Product
        • By Application
        • By Distribution Channel
    • Brazil
      • Pricing Analysis
      • Market Share Analysis, 2024
        • By Product
        • By Application
        • By Distribution Channel
    • Mexico
      • Pricing Analysis
      • Market Share Analysis, 2024
        • By Product
        • By Application
        • By Distribution Channel
    • Argentina
      • Pricing Analysis
      • Market Share Analysis, 2024
        • By Product
        • By Application
        • By Distribution Channel
  18. Market Structure Analysis
    • Competition Dashboard
    • Competition Benchmarking
    • Market Share Analysis of Top Players
      • By Regional
      • By Product
      • By Application
      • By Distribution Channel
  19. Competition Analysis
    • Competition Deep Dive
      • Alpro
        • Overview
        • Product Portfolio
        • Profitability by Market Segments (Product/Age /Sales Channel/Region)
        • Sales Footprint
        • Strategy Overview
          • Marketing Strategy
          • Product Strategy
          • Channel Strategy
      • Amy's Kitchen, Inc.
        • Overview
        • Product Portfolio
        • Profitability by Market Segments (Product/Age /Sales Channel/Region)
        • Sales Footprint
        • Strategy Overview
          • Marketing Strategy
          • Product Strategy
          • Channel Strategy
      • Conagra Brands, Inc.
        • Overview
        • Product Portfolio
        • Profitability by Market Segments (Product/Age /Sales Channel/Region)
        • Sales Footprint
        • Strategy Overview
          • Marketing Strategy
          • Product Strategy
          • Channel Strategy
      • Daiya Foods Inc.
        • Overview
        • Product Portfolio
        • Profitability by Market Segments (Product/Age /Sales Channel/Region)
        • Sales Footprint
        • Strategy Overview
          • Marketing Strategy
          • Product Strategy
          • Channel Strategy
      • Danone S.A.
        • Overview
        • Product Portfolio
        • Profitability by Market Segments (Product/Age /Sales Channel/Region)
        • Sales Footprint
        • Strategy Overview
          • Marketing Strategy
          • Product Strategy
          • Channel Strategy
      • Dr. Schär AG/SPA
        • Overview
        • Product Portfolio
        • Profitability by Market Segments (Product/Age /Sales Channel/Region)
        • Sales Footprint
        • Strategy Overview
          • Marketing Strategy
          • Product Strategy
          • Channel Strategy
      • Enjoy Life Foods (Mondelēz International)
        • Overview
        • Product Portfolio
        • Profitability by Market Segments (Product/Age /Sales Channel/Region)
        • Sales Footprint
        • Strategy Overview
          • Marketing Strategy
          • Product Strategy
          • Channel Strategy
      • Follow Your Heart
        • Overview
        • Product Portfolio
        • Profitability by Market Segments (Product/Age /Sales Channel/Region)
        • Sales Footprint
        • Strategy Overview
          • Marketing Strategy
          • Product Strategy
          • Channel Strategy
      • Fody Food Co.
        • Overview
        • Product Portfolio
        • Profitability by Market Segments (Product/Age /Sales Channel/Region)
        • Sales Footprint
        • Strategy Overview
          • Marketing Strategy
          • Product Strategy
          • Channel Strategy
      • General Mills, Inc.
        • Overview
        • Product Portfolio
        • Profitability by Market Segments (Product/Age /Sales Channel/Region)
        • Sales Footprint
        • Strategy Overview
          • Marketing Strategy
          • Product Strategy
          • Channel Strategy
      • Glutino (The Glutino Food Group)
        • Overview
        • Product Portfolio
        • Profitability by Market Segments (Product/Age /Sales Channel/Region)
        • Sales Footprint
        • Strategy Overview
          • Marketing Strategy
          • Product Strategy
          • Channel Strategy
      • Kellogg Company
        • Overview
        • Product Portfolio
        • Profitability by Market Segments (Product/Age /Sales Channel/Region)
        • Sales Footprint
        • Strategy Overview
          • Marketing Strategy
          • Product Strategy
          • Channel Strategy
      • Lactaid (McNeil Nutritionals, LLC)
        • Overview
        • Product Portfolio
        • Profitability by Market Segments (Product/Age /Sales Channel/Region)
        • Sales Footprint
        • Strategy Overview
          • Marketing Strategy
          • Product Strategy
          • Channel Strategy
      • Mondelēz International, Inc.
        • Overview
        • Product Portfolio
        • Profitability by Market Segments (Product/Age /Sales Channel/Region)
        • Sales Footprint
        • Strategy Overview
          • Marketing Strategy
          • Product Strategy
          • Channel Strategy
      • Nestlé S.A.
        • Overview
        • Product Portfolio
        • Profitability by Market Segments (Product/Age /Sales Channel/Region)
        • Sales Footprint
        • Strategy Overview
          • Marketing Strategy
          • Product Strategy
          • Channel Strategy
      • Oatly Group AB
        • Overview
        • Product Portfolio
        • Profitability by Market Segments (Product/Age /Sales Channel/Region)
        • Sales Footprint
        • Strategy Overview
          • Marketing Strategy
          • Product Strategy
          • Channel Strategy
      • The Hain Celestial Group, Inc.
        • Overview
        • Product Portfolio
        • Profitability by Market Segments (Product/Age /Sales Channel/Region)
        • Sales Footprint
        • Strategy Overview
          • Marketing Strategy
          • Product Strategy
          • Channel Strategy
      • The Kraft Heinz Company
        • Overview
        • Product Portfolio
        • Profitability by Market Segments (Product/Age /Sales Channel/Region)
        • Sales Footprint
        • Strategy Overview
          • Marketing Strategy
          • Product Strategy
          • Channel Strategy
      • The Lactalis Group
        • Overview
        • Product Portfolio
        • Profitability by Market Segments (Product/Age /Sales Channel/Region)
        • Sales Footprint
        • Strategy Overview
          • Marketing Strategy
          • Product Strategy
          • Channel Strategy
      • Udis Gluten Free (Boulder Brands, Inc.)
        • Overview
        • Product Portfolio
        • Profitability by Market Segments (Product/Age /Sales Channel/Region)
        • Sales Footprint
        • Strategy Overview
          • Marketing Strategy
          • Product Strategy
          • Channel Strategy
  20. Assumptions & Acronyms Used
  21. Research Methodology

List of Tables

  • Table 1: Global Market Value (USD Billion) Forecast by Region, 2020 to 2035
  • Table 2: Global Market Volume (MT) Forecast by Region, 2020 to 2035
  • Table 3: Global Market Value (USD Billion) Forecast by Product, 2020 to 2035
  • Table 4: Global Market Volume (MT) Forecast by Product, 2020 to 2035
  • Table 5: Global Market Value (USD Billion) Forecast by Application, 2020 to 2035
  • Table 6: Global Market Volume (MT) Forecast by Application, 2020 to 2035
  • Table 7: Global Market Value (USD Billion) Forecast by Distribution Channel, 2020 to 2035
  • Table 8: Global Market Volume (MT) Forecast by Distribution Channel, 2020 to 2035
  • Table 9: North America Market Value (USD Billion) Forecast by Country, 2020 to 2035
  • Table 10: North America Market Volume (MT) Forecast by Country, 2020 to 2035
  • Table 11: North America Market Value (USD Billion) Forecast by Product, 2020 to 2035
  • Table 12: North America Market Volume (MT) Forecast by Product, 2020 to 2035
  • Table 13: North America Market Value (USD Billion) Forecast by Application, 2020 to 2035
  • Table 14: North America Market Volume (MT) Forecast by Application, 2020 to 2035
  • Table 15: North America Market Value (USD Billion) Forecast by Distribution Channel, 2020 to 2035
  • Table 16: North America Market Volume (MT) Forecast by Distribution Channel, 2020 to 2035
  • Table 17: Latin America Market Value (USD Billion) Forecast by Country, 2020 to 2035
  • Table 18: Latin America Market Volume (MT) Forecast by Country, 2020 to 2035
  • Table 19: Latin America Market Value (USD Billion) Forecast by Product, 2020 to 2035
  • Table 20: Latin America Market Volume (MT) Forecast by Product, 2020 to 2035
  • Table 21: Latin America Market Value (USD Billion) Forecast by Application, 2020 to 2035
  • Table 22: Latin America Market Volume (MT) Forecast by Application, 2020 to 2035
  • Table 23: Latin America Market Value (USD Billion) Forecast by Distribution Channel, 2020 to 2035
  • Table 24: Latin America Market Volume (MT) Forecast by Distribution Channel, 2020 to 2035
  • Table 25: Western Europe Market Value (USD Billion) Forecast by Country, 2020 to 2035
  • Table 26: Western Europe Market Volume (MT) Forecast by Country, 2020 to 2035
  • Table 27: Western Europe Market Value (USD Billion) Forecast by Product, 2020 to 2035
  • Table 28: Western Europe Market Volume (MT) Forecast by Product, 2020 to 2035
  • Table 29: Western Europe Market Value (USD Billion) Forecast by Application, 2020 to 2035
  • Table 30: Western Europe Market Volume (MT) Forecast by Application, 2020 to 2035
  • Table 31: Western Europe Market Value (USD Billion) Forecast by Distribution Channel, 2020 to 2035
  • Table 32: Western Europe Market Volume (MT) Forecast by Distribution Channel, 2020 to 2035
  • Table 33: Eastern Europe Market Value (USD Billion) Forecast by Country, 2020 to 2035
  • Table 34: Eastern Europe Market Volume (MT) Forecast by Country, 2020 to 2035
  • Table 35: Eastern Europe Market Value (USD Billion) Forecast by Product, 2020 to 2035
  • Table 36: Eastern Europe Market Volume (MT) Forecast by Product, 2020 to 2035
  • Table 37: Eastern Europe Market Value (USD Billion) Forecast by Application, 2020 to 2035
  • Table 38: Eastern Europe Market Volume (MT) Forecast by Application, 2020 to 2035
  • Table 39: Eastern Europe Market Value (USD Billion) Forecast by Distribution Channel, 2020 to 2035
  • Table 40: Eastern Europe Market Volume (MT) Forecast by Distribution Channel, 2020 to 2035
  • Table 41: East Asia Market Value (USD Billion) Forecast by Country, 2020 to 2035
  • Table 42: East Asia Market Volume (MT) Forecast by Country, 2020 to 2035
  • Table 43: East Asia Market Value (USD Billion) Forecast by Product, 2020 to 2035
  • Table 44: East Asia Market Volume (MT) Forecast by Product, 2020 to 2035
  • Table 45: East Asia Market Value (USD Billion) Forecast by Application, 2020 to 2035
  • Table 46: East Asia Market Volume (MT) Forecast by Application, 2020 to 2035
  • Table 47: East Asia Market Value (USD Billion) Forecast by Distribution Channel, 2020 to 2035
  • Table 48: East Asia Market Volume (MT) Forecast by Distribution Channel, 2020 to 2035
  • Table 49: South Asia & Pacific Market Value (USD Billion) Forecast by Country, 2020 to 2035
  • Table 50: South Asia & Pacific Market Volume (MT) Forecast by Country, 2020 to 2035
  • Table 51: South Asia & Pacific Market Value (USD Billion) Forecast by Product, 2020 to 2035
  • Table 52: South Asia & Pacific Market Volume (MT) Forecast by Product, 2020 to 2035
  • Table 53: South Asia & Pacific Market Value (USD Billion) Forecast by Application, 2020 to 2035
  • Table 54: South Asia & Pacific Market Volume (MT) Forecast by Application, 2020 to 2035
  • Table 55: South Asia & Pacific Market Value (USD Billion) Forecast by Distribution Channel, 2020 to 2035
  • Table 56: South Asia & Pacific Market Volume (MT) Forecast by Distribution Channel, 2020 to 2035
  • Table 57: Middle East and Africa Market Value (USD Billion) Forecast by Country, 2020 to 2035
  • Table 58: Middle East and Africa Market Volume (MT) Forecast by Country, 2020 to 2035
  • Table 59: Middle East and Africa Market Value (USD Billion) Forecast by Product, 2020 to 2035
  • Table 60: Middle East and Africa Market Volume (MT) Forecast by Product, 2020 to 2035
  • Table 61: Middle East and Africa Market Value (USD Billion) Forecast by Application, 2020 to 2035
  • Table 62: Middle East and Africa Market Volume (MT) Forecast by Application, 2020 to 2035
  • Table 63: Middle East and Africa Market Value (USD Billion) Forecast by Distribution Channel, 2020 to 2035
  • Table 64: Middle East and Africa Market Volume (MT) Forecast by Distribution Channel, 2020 to 2035

List of Figures

  • Figure 1: Global Market Volume (MT) Forecast 2020 to 2035
  • Figure 2: Global Market Pricing Analysis
  • Figure 3: Global Market Value (USD Billion) Forecast 2020 to 2035
  • Figure 4: Global Market Value Share and BPS Analysis by Product, 2025 and 2035
  • Figure 5: Global Market Y-o-Y Growth Comparison by Product, 2025 to 2035
  • Figure 6: Global Market Attractiveness Analysis by Product
  • Figure 7: Global Market Value Share and BPS Analysis by Application, 2025 and 2035
  • Figure 8: Global Market Y-o-Y Growth Comparison by Application, 2025 to 2035
  • Figure 9: Global Market Attractiveness Analysis by Application
  • Figure 10: Global Market Value Share and BPS Analysis by Distribution Channel, 2025 and 2035
  • Figure 11: Global Market Y-o-Y Growth Comparison by Distribution Channel, 2025 to 2035
  • Figure 12: Global Market Attractiveness Analysis by Distribution Channel
  • Figure 13: Global Market Value (USD Billion) Share and BPS Analysis by Region, 2025 and 2035
  • Figure 14: Global Market Y-o-Y Growth Comparison by Region, 2025 to 2035
  • Figure 15: Global Market Attractiveness Analysis by Region
  • Figure 16: North America Market Incremental $ Opportunity, 2025 to 2035
  • Figure 17: Latin America Market Incremental $ Opportunity, 2025 to 2035
  • Figure 18: Western Europe Market Incremental $ Opportunity, 2025 to 2035
  • Figure 19: Eastern Europe Market Incremental $ Opportunity, 2025 to 2035
  • Figure 20: East Asia Market Incremental $ Opportunity, 2025 to 2035
  • Figure 21: South Asia & Pacific Market Incremental $ Opportunity, 2025 to 2035
  • Figure 22: Middle East and Africa Market Incremental $ Opportunity, 2025 to 2035
  • Figure 23: North America Market Value Share and BPS Analysis by Country, 2025 and 2035
  • Figure 24: North America Market Value Share and BPS Analysis by Product, 2025 and 2035
  • Figure 25: North America Market Y-o-Y Growth Comparison by Product, 2025 to 2035
  • Figure 26: North America Market Attractiveness Analysis by Product
  • Figure 27: North America Market Value Share and BPS Analysis by Application, 2025 and 2035
  • Figure 28: North America Market Y-o-Y Growth Comparison by Application, 2025 to 2035
  • Figure 29: North America Market Attractiveness Analysis by Application
  • Figure 30: North America Market Value Share and BPS Analysis by Distribution Channel, 2025 and 2035
  • Figure 31: North America Market Y-o-Y Growth Comparison by Distribution Channel, 2025 to 2035
  • Figure 32: North America Market Attractiveness Analysis by Distribution Channel
  • Figure 33: Latin America Market Value Share and BPS Analysis by Country, 2025 and 2035
  • Figure 34: Latin America Market Value Share and BPS Analysis by Product, 2025 and 2035
  • Figure 35: Latin America Market Y-o-Y Growth Comparison by Product, 2025 to 2035
  • Figure 36: Latin America Market Attractiveness Analysis by Product
  • Figure 37: Latin America Market Value Share and BPS Analysis by Application, 2025 and 2035
  • Figure 38: Latin America Market Y-o-Y Growth Comparison by Application, 2025 to 2035
  • Figure 39: Latin America Market Attractiveness Analysis by Application
  • Figure 40: Latin America Market Value Share and BPS Analysis by Distribution Channel, 2025 and 2035
  • Figure 41: Latin America Market Y-o-Y Growth Comparison by Distribution Channel, 2025 to 2035
  • Figure 42: Latin America Market Attractiveness Analysis by Distribution Channel
  • Figure 43: Western Europe Market Value Share and BPS Analysis by Country, 2025 and 2035
  • Figure 44: Western Europe Market Value Share and BPS Analysis by Product, 2025 and 2035
  • Figure 45: Western Europe Market Y-o-Y Growth Comparison by Product, 2025 to 2035
  • Figure 46: Western Europe Market Attractiveness Analysis by Product
  • Figure 47: Western Europe Market Value Share and BPS Analysis by Application, 2025 and 2035
  • Figure 48: Western Europe Market Y-o-Y Growth Comparison by Application, 2025 to 2035
  • Figure 49: Western Europe Market Attractiveness Analysis by Application
  • Figure 50: Western Europe Market Value Share and BPS Analysis by Distribution Channel, 2025 and 2035
  • Figure 51: Western Europe Market Y-o-Y Growth Comparison by Distribution Channel, 2025 to 2035
  • Figure 52: Western Europe Market Attractiveness Analysis by Distribution Channel
  • Figure 53: Eastern Europe Market Value Share and BPS Analysis by Country, 2025 and 2035
  • Figure 54: Eastern Europe Market Value Share and BPS Analysis by Product, 2025 and 2035
  • Figure 55: Eastern Europe Market Y-o-Y Growth Comparison by Product, 2025 to 2035
  • Figure 56: Eastern Europe Market Attractiveness Analysis by Product
  • Figure 57: Eastern Europe Market Value Share and BPS Analysis by Application, 2025 and 2035
  • Figure 58: Eastern Europe Market Y-o-Y Growth Comparison by Application, 2025 to 2035
  • Figure 59: Eastern Europe Market Attractiveness Analysis by Application
  • Figure 60: Eastern Europe Market Value Share and BPS Analysis by Distribution Channel, 2025 and 2035
  • Figure 61: Eastern Europe Market Y-o-Y Growth Comparison by Distribution Channel, 2025 to 2035
  • Figure 62: Eastern Europe Market Attractiveness Analysis by Distribution Channel
  • Figure 63: East Asia Market Value Share and BPS Analysis by Country, 2025 and 2035
  • Figure 64: East Asia Market Value Share and BPS Analysis by Product, 2025 and 2035
  • Figure 65: East Asia Market Y-o-Y Growth Comparison by Product, 2025 to 2035
  • Figure 66: East Asia Market Attractiveness Analysis by Product
  • Figure 67: East Asia Market Value Share and BPS Analysis by Application, 2025 and 2035
  • Figure 68: East Asia Market Y-o-Y Growth Comparison by Application, 2025 to 2035
  • Figure 69: East Asia Market Attractiveness Analysis by Application
  • Figure 70: East Asia Market Value Share and BPS Analysis by Distribution Channel, 2025 and 2035
  • Figure 71: East Asia Market Y-o-Y Growth Comparison by Distribution Channel, 2025 to 2035
  • Figure 72: East Asia Market Attractiveness Analysis by Distribution Channel
  • Figure 73: South Asia & Pacific Market Value Share and BPS Analysis by Country, 2025 and 2035
  • Figure 74: South Asia & Pacific Market Value Share and BPS Analysis by Product, 2025 and 2035
  • Figure 75: South Asia & Pacific Market Y-o-Y Growth Comparison by Product, 2025 to 2035
  • Figure 76: South Asia & Pacific Market Attractiveness Analysis by Product
  • Figure 77: South Asia & Pacific Market Value Share and BPS Analysis by Application, 2025 and 2035
  • Figure 78: South Asia & Pacific Market Y-o-Y Growth Comparison by Application, 2025 to 2035
  • Figure 79: South Asia & Pacific Market Attractiveness Analysis by Application
  • Figure 80: South Asia & Pacific Market Value Share and BPS Analysis by Distribution Channel, 2025 and 2035
  • Figure 81: South Asia & Pacific Market Y-o-Y Growth Comparison by Distribution Channel, 2025 to 2035
  • Figure 82: South Asia & Pacific Market Attractiveness Analysis by Distribution Channel
  • Figure 83: Middle East and Africa Market Value Share and BPS Analysis by Country, 2025 and 2035
  • Figure 84: Middle East and Africa Market Value Share and BPS Analysis by Product, 2025 and 2035
  • Figure 85: Middle East and Africa Market Y-o-Y Growth Comparison by Product, 2025 to 2035
  • Figure 86: Middle East and Africa Market Attractiveness Analysis by Product
  • Figure 87: Middle East and Africa Market Value Share and BPS Analysis by Application, 2025 and 2035
  • Figure 88: Middle East and Africa Market Y-o-Y Growth Comparison by Application, 2025 to 2035
  • Figure 89: Middle East and Africa Market Attractiveness Analysis by Application
  • Figure 90: Middle East and Africa Market Value Share and BPS Analysis by Distribution Channel, 2025 and 2035
  • Figure 91: Middle East and Africa Market Y-o-Y Growth Comparison by Distribution Channel, 2025 to 2035
  • Figure 92: Middle East and Africa Market Attractiveness Analysis by Distribution Channel
  • Figure 93: Global Market - Tier Structure Analysis
  • Figure 94: Global Market - Company Share Analysis

Frequently Asked Questions

What is the projected market size of the food intolerance products market by 2035?

The global industry is anticipated to reach USD 21.6 billion by 2035, expanding from USD 11.1 billion in 2025, growing at a CAGR of 6.9% during the forecast period.

Which product segment holds the largest share in the food intolerance products market?

Gluten-free products dominate the market segment owing to rising gluten sensitivity cases, accounting for over 40% share in 2025.

What is driving the demand for food intolerance products globally?

The increasing prevalence of lactose intolerance and gluten sensitivity, coupled with consumer awareness regarding gut health and allergen-free diets, is propelling demand worldwide.

Who is the leading player in the market?

The leading market player include Nestlé S.A. holding 12% of market share.

Which regions are expected to lead the food intolerance products market by 2035?

North America is forecasted to maintain a dominant share, contributing approximately 35% of the global revenue by 2035.

Explore Similar Insights

Future Market Insights

Food Intolerance Products Market