Food Grade Glass Market Size and Share Forecast Outlook 2025 to 2035

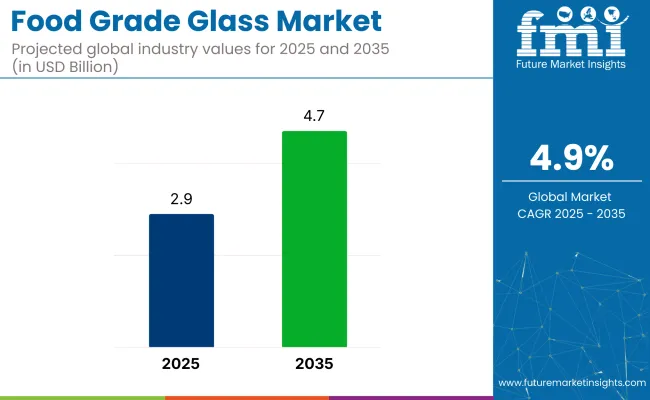
The global food grade glass market is projected to grow from USD 2.9 billion in 2025 to USD 4.7 billion by 2035, expanding at a CAGR of 4.9% during the forecast period.
Quick Stats of Food Grade Glass Market

  • Market Value (2025): USD 2.9 billion
  • Forecast Value (2035): USD 4.7 billion
  • Forecast CAGR (2025 to 2035): 4.9%
  • Leading Segment in 2035: Borosilicate (66% share)
  • Key Growth Region: Europe (United Kingdom, France), and Asia Pacific (China)
  • Key Players: O-I Glass, Inc., Stölzle Glass Group, Vidrala, Ardagh Group, Verallia.

Food Grade Glass Market

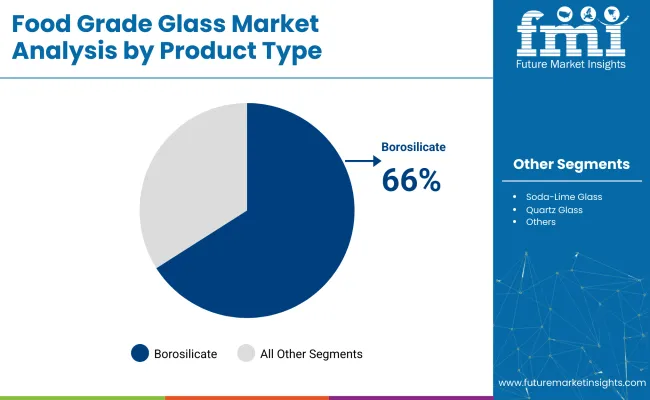
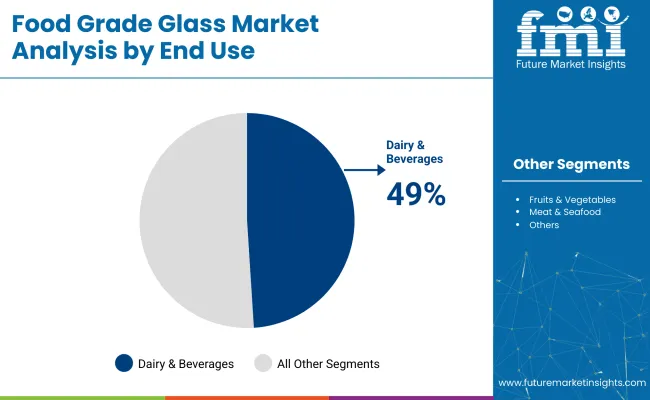
Borosilicate glass is expected to account for about 66% of the market in 2025, reflecting steady demand for its durability and chemical resistance. The dairy & beverage sector is likely to remain the largest end-use category, with an estimated 49% share. These trends are expected to shape the market through 2035.

The food grade glass industry comprises approximately 85-90% of the total glass packaging industry, as the majority of glass containers are used for food and beverage applications. This translates to nearly 90-95% of glass used specifically in consumable goods packaging. Within the broader food and beverage packaging materials industry, food grade glass holds an estimated 11-12% share, competing with plastics, metal, and paper-based materials.

Its presence in the wider food grade packaging sector is smaller, typically under 5%, due to the dominance of flexible and lightweight alternatives. However, in the beverage packaging segment, glass remains prominent, accounting for roughly 38-46% of usage, particularly in alcoholic and premium non-alcoholic drinks where quality preservation and branding are priorities.

In May 2025, GCA (Gürok Glass Packaging), part of Türkiye’sGürok Group, successfully retained its prestigious AA+ rating under the BRCGS Global Standard for Packaging Materials (BRC PM) after an unannounced audit conducted by RINA.

This certification, recognized by the Global Food Safety Initiative (GFSI), reaffirms GCA’s commitment to top-tier food safety, hygiene, and packaging quality standards. As the first Turkish glass packaging producer to achieve this rating, GCA continues to supply over 40 countries worldwide. The company also focuses on incorporating environmentally friendly practices into its operations to meet the rising global demand for safe, high-quality food-grade glass containers.

Analysis of Food Grade Glass Market by Top Investment Segments

The industry has been segmented by product type, material composition, and end use. Borosilicate glass, lead-free formulations, and dairy & beverage applications are projected to dominate in 2025. This leadership has been attributed to durability, non-toxicity, and widespread demand for hygienic, premium packaging formats in industries.

Borosilicate Glass Leads Product Type Segment

Borosilicate glass is projected to maintain its dominance in the industry, accounting for a 66% share in 2025 due to its superior thermal resistance, chemical durability, and safety profile. Its extensive usage in beverage bottles, storage jars, and food containers highlights its versatility across various food-grade applications.
  • Soda-lime glass remains preferred for cost-sensitive mass packaging, while quartz glass finds niche applications requiring high heat resistance such as laboratory and specialty food storage. Other specialty glass types are produced in limited volumes for specific industrial or gourmet uses.
  • Key manufacturers like Schott AG and Corning continue expanding their borosilicate glass lines to meet growing demand from food and beverage sectors globally.

Food Grade Glass Market Analysis By Product Type

Dairy & Beverages Dominate End Use Segment

The dairy & beverages segment is forecasted to retain the largest end-use share of 49% in 2025, driven by the global consumer preference for glass-packaged milk, juices, carbonated drinks, and alcoholic beverages. Glass enhances product integrity, taste preservation, and food safety-critical features valued in premium beverage packaging.
  • The bakery & confectionery segment increasingly employs glass jars for gourmet spreads and specialty desserts, whereas producers of fruits, vegetables, meats, and seafood are shifting towards glass to enhance shelf appeal in high-end industries.
  • Niche applications such as ready-to-eat meals, sauces, and condiments packaged in glass are emerging but remain relatively small compared to the dominant dairy and beverage use.

Food Grade Glass Market Analysis By End Use

Lead-free Glass Preferred in Material Composition

Lead-free glass is expected to lead the material composition category, capturing a 40% share in 2025, as demand rises for toxin-free, eco-friendly food packaging solutions. This glass type offers safe storage without harmful leaching, aligning with strict international food safety standards.

  • Recycled glass is gaining traction, especially in regions prioritizing circular economy practices, while coated and laminated glasses meet specialized packaging needs such as UV protection or impact resistance. Other material formulations, although present, serve niche purposes or region-specific demands.
  • Major producers like Owens-Illinois are emphasizing the development of lead-free glass lines to cater to both regulatory pressures and increasing global health-conscious consumer preferences.

Top Food Grade Glass Market Dynamics

Growing consumer preference for safe, inert packaging and rising environmental regulations are reshaping the food grade glass industry. Demand is being driven by the need for chemical-free storage and strong branding, while recyclability mandates are compelling manufacturers to innovate in design, material usage, and post-consumer recovery systems.

Rising Adoption of Inert and Premium Packaging

Food grade glass is being increasingly selected for its non-reactive nature and visual appeal. Its use is being prioritised in baby food, sauces, and specialty beverages to maintain purity and taste integrity. Brands are positioning glass as a reusable, premium option that aligns with consumer health and lifestyle expectations.

  • Sourdough starters and cold brews are being packaged in glass to highlight artisanal quality.
  • Glass containers are being marketed as microwave- and dishwasher-safe, promoting reusability.
  • Health-focused shoppers are opting for glass jars to avoid BPA and plastic migration risks.

Recycling Mandates and Sustainable Design Pressures

Environmental legislation is pushing the industry toward lighter, recyclable, and closed-loop packaging systems. EPR regulations in regions like the EU and California are requiring producers to meet recovery targets. In response, manufacturers are increasing the use of recycled glass and adopting energy-efficient production methods.
  • Lightweight bottles are being engineered to reduce emissions in logistics.
  • Post-consumer glass is being incorporated into new batches to meet circularity goals.
  • Retailers are reviving deposit-return systems to boost glass collection and reuse rates.

Top Countries Manufacturing, Processing, Exporting, and Utilizing Food Grade Glass

Country Wise Analysis Of Food Grade Glass Market

Countries CAGR (2025 to 2035)
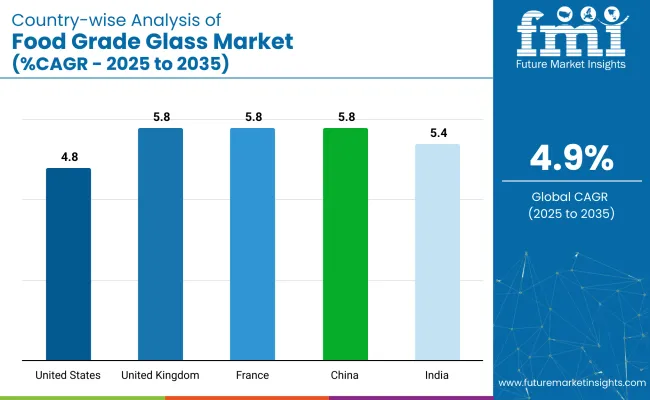
United States 4.8%
United Kingdom 5.8%
France 5.8%
China 5.8%
India 5.4%

The food grade glass industry is expected to expand steadily across both OECD and BRICS nations between 2025 and 2035. Among OECD countries, the United Kingdom and France are each projected to grow at a CAGR of 5.8%, outperforming the global average of 4.9%.

This growth is being driven by strong regulatory frameworks, consumer demand for plastic-free alternatives, and innovations in aesthetic, reusable packaging. The United States follows with a 4.8% CAGR, supported by smart packaging integration and lightweight design adoption. In the BRICS group, China matches OECD leaders with a 5.8% CAGR, propelled by policy-led plastic reduction. India, growing at 5.4%, benefits from rising health awareness and expanding domestic production. Together, BRICS economies are leading volume-driven growth, while OECD nations steer premiumisation.

The report covers detailed analysis of 40+ countries and the top five countries have been shared as a reference.

An Overview of the United States Food Grade Glass Market Growth

The market in the United States is set to grow steadily at a CAGR of 4.8% from 2025 to 2035. This growth is fueled by the country’s well-established packaging industry, which is increasingly adopting recyclable materials and eco-friendly solutions in response to stringent environmental regulations and policies.

Innovative trends such as smart glass technologies offering enhanced barrier properties and longer shelf life are gaining traction, particularly in premium food and beverage packaging. Major producers focus on developing lightweight and energy-efficient glass variants to reduce carbon footprints. The rising demand for eco-friendly and high-performance packaging solutions continues to reinforce the United States' leadership in this industry globally.

  • Specialized UV-blocking glass is being developed to preserve sensitive food and beverage products.
  • Subscription-based grocery services are integrating returnable glass packaging models.
  • Collaboration with tech startups is enabling digital serialization for reuse tracking.

In-depth Analysis of the United Kingdom Food Grade Glass Market Expansion

The market in United Kingdom is projected to expand at a CAGR of 5.8% through 2035, fueled by growing consumer preference for environmentally conscious, plastic-free packaging solutions. Regulations like the Plastic Packaging Tax push manufacturers toward glass alternatives. Premium alcoholic beverages, specialty condiments, and gourmet foods are increasingly packaged in glass to meet aesthetic and functional demands.

Local producers are innovating with design trends such as embossed bottles and reusable jars, catering to environmentally conscious consumers. The UK industry’s emphasis on eco-innovation and high-end product presentation reinforces its rapid growth and positions it as a key European player in food-grade glass packaging.

  • Biodegradable closures are being paired with glass jars to offer fully compostable packaging formats.
  • Urban zero-waste stores are deploying bulk dispensers with refillable glass containers.
  • Artisan food producers are experimenting with seasonal limited-edition designs to differentiate shelf presence.

France Food Grade Glass Market Analysis and Growth Opportunities

Food grade glass industry in France is anticipated to grow at a CAGR of 5.8% during the forecast period, owing to its rich culinary heritage and a national drive toward eco-friendly packaging. French food producers prioritize glass jars and bottles for gourmet items like sauces, wines, and preserves to maintain authenticity and premium image.

Government-backed initiatives supporting recycling and circular economy practices encourage wider use of food-grade glass. The industry also benefits from consumer expectations for artistic and elegant packaging, reinforcing glass as the material of choice for premium food and beverage products. These factors collectively contribute to France’s steady industry expansion.

  • Heat-resistant embossed glass jars are being adopted for traditional oven-ready meals.
  • Culinary tourism is promoting premium glass-packaged regional delicacies for export industries.
  • Public grants are being issued to SMEs transitioning to glass from composite plastics.

China Food Grade Glass Market Development in Response to Shifting Consumer Demand

The market in China is expected to expand at a strong CAGR of 5.8%, supported by modernization of food distribution systems. The rising middle class demands high-quality, safe, and attractive food packaging, where glass offers a superior alternative to plastic. China’s large-scale industrial base allows cost-effective production of food-grade glass containers for both domestic use and export.

Environmental policies restricting single-use plastics also stimulate glass adoption across beverage, sauce, and condiment industries. The government’s focus on renewable and resource efficiency is pushing manufacturers to scale up recycled and lightweight glass packaging production, reinforcing China’s industry position globally.

  • Embedded RFID labels are being tested on glass packaging to optimise supply chain traceability.
  • Partnerships with food-delivery platforms are pushing glass containers into hot-meal logistics.
  • Aesthetic-led packaging designs are gaining traction in the health drink and herbal tonic categories.

India Food Grade Glass Industry Growth Driven by Health and Eco-Friendly Trends

The industry in India is forecasted to grow at a CAGR of 5.4% between 2025 and 2035, driven by increasing health awareness and the shift toward eco-conscious packaging. Rising consumer concerns regarding plastic contamination in food have elevated demand for safe, reusable glass containers.

The expanding processed food sector, particularly for traditional sweets, pickles, and ready-to-eat meals, is fueling this transition. Government initiatives encouraging recyclable packaging solutions further support industry growth. Domestic glass manufacturers are also enhancing their capabilities to meet local and export demand, positioning India as one of the fastest-growing industries in the Asia Pacific food-grade glass industry.

  • Indigenous raw material sourcing is being promoted to reduce reliance on imported silica.
  • Returnable packaging systems are being trialled in regional sweet shops and home tiffin services.
  • Skill development programs are being launched to train local glassworkers in automated forming processes.

Leading Food Grade Glass Suppliers

The food grade glass industry is being led by established suppliers such as O-I Glass, Inc., Stölzle Glass Group, Ardagh Group, and Verallia, supported by advanced production systems and extensive global distribution networks. Significant investments are being made in R&D to improve recyclability, product strength, and aesthetic appeal. Innovations in premium packaging formats are being introduced by Stölzle and Verallia to meet evolving consumer expectations.

Emerging players like BEAUSINO and JiningBaolin Glass are being recognised for offering cost-effective solutions in developing regions, though industry access is being restricted by high capital requirements and stringent food safety regulations. Industry consolidation is being observed, with mergers and acquisitions being pursued to strengthen technological capabilities and expand regional presence.

Recent Food Grade Glass Market News

In April 2025, Ardagh Glass Packaging’s Bridgeton, New Jersey facility achieved the globally recognized FSSC 22000 food safety certification, as officially announced by the company. This certification underscores Ardagh’s commitment to ensuring the highest food safety and quality management standards for its glass packaging solutions. The achievement boosts customer confidence, particularly among food and beverage brands seeking secure, compliant, and premium-grade glass containers for their products.

Leading Players in Food Grade Glass Market

  • O-I Glass, Inc. (Owens-Illinois)
  • Stölzle Glass Group
  • Vidrala
  • Ardagh Group (Luxembourg & USA)
  • Verallia (France & Europe & USA)
  • Bormioli Rocco (Italy & Europe
  • Evergreen Resources (USA)
  • Croxsons (UK)
  • BEAUSINO
  • Guangdong Huaxing Glass Co., LTD.
  • JiningBaolin Glass

Report Coverage and Scope Summary

Report Attributes Details
Industry Size (2025) USD 2.9 billion
Projected Industry Size (2035) USD 4.7 billion
CAGR (2025 to 2035) 4.9%
Base Year for Estimation 2024
Historical Period 2020 to 2024
Projections Period 2025 to 2035
Quantitative Units USD billion for value and million metric tons for volume
Product Types Analyzed (Segment 1) Borosilicate Glass, Soda-Lime Glass, Quartz Glass, Others
Material Compositions Analyzed (Segment 2) Lead-Free Glass, Recycled Glass, Coated Glass, Laminated Glass, Others
End Uses Analyzed (Segment 3) Dairy & Beverages, Bakery & Confectionery, Fruits & Vegetables, Meat & Seafood, Others (Ready-to-Eat Meals, Sauces)
Regions Covered North America, Europe, Asia Pacific, Latin America, Middle East & Africa
Countries Covered United States, Canada, Germany, United Kingdom, France, Italy, Spain, China, India, Japan, Australia, South Korea, Brazil, Mexico, Argentina, Saudi Arabia, South Africa, UAE
Key Players O-I Glass, Inc. (Owens-Illinois), Stölzle Glass Group, Vidrala, Ardagh Group (Luxembourg & USA), Verallia (France, Europe & USA), Bormioli Rocco (Italy & Europe), Evergreen Resources (USA), Croxsons (UK), BEAUSINO, Guangdong Huaxing Glass Co., LTD., Jining Baolin Glass.
Additional Attributes Dollar sales, share by pr oduct type and end use, rise in recycled glass demand, expansion of dairy & beverage packaging, technological innovations in coated and laminated glass, regional supply chain trends

Food Grade Glass Market Analyzed by Key Investment Segments

By Product Type:

The industry is segmented by product type into borosilicate glass, soda-lime glass, quartz glass, and others.

By Material Composition:

By material composition, the industry is divided into lead-free glass, recycled glass, coated glass, laminated glass, and others.

By End Use:

By end use, the industry is classified into dairy & beverages, bakery & confectionery, fruits & vegetables, meat & seafood, and others (ready-to-eat meals, sauces).

By Region:

By region, the industry is categorized into North America, Europe, Asia Pacific, Latin America, and the Middle East & Africa.

Table of Content

  1. Executive Summary
    • Global Market Outlook
    • Demand-side Trends
    • Supply-side Trends
    • Technology Roadmap Analysis
    • Analysis and Recommendations
  2. Market Overview
    • Market Coverage / Taxonomy
    • Market Definition / Scope / Limitations
  3. Market Background
    • Market Dynamics
      • Drivers
      • Restraints
      • Opportunity
      • Trends
    • Scenario Forecast
      • Demand in Optimistic Scenario
      • Demand in Likely Scenario
      • Demand in Conservative Scenario
    • Opportunity Map Analysis
    • Product Life Cycle Analysis
    • Supply Chain Analysis
      • Supply Side Participants and their Roles
        • Producers
        • Mid-Level Participants (Traders/ Agents/ Brokers)
        • Wholesalers and Distributors
      • Value Added and Value Created at Node in the Supply Chain
      • List of Raw Material Suppliers
      • List of Existing and Potential Buyer’s
    • Investment Feasibility Matrix
    • Value Chain Analysis
      • Profit Margin Analysis
      • Wholesalers and Distributors
      • Retailers
    • PESTLE and Porter’s Analysis
    • Regulatory Landscape
      • By Key Regions
      • By Key Countries
    • Regional Parent Market Outlook
    • Production and Consumption Statistics
    • Import and Export Statistics
  4. Global Market Analysis 2020 to 2024 and Forecast, 2025 to 2035
    • Historical Market Size Value (USD Billion) & Volume (MT) Analysis, 2020 to 2024
    • Current and Future Market Size Value (USD Billion) & Volume (MT) Projections, 2025 to 2035
      • Y-o-Y Growth Trend Analysis
      • Absolute $ Opportunity Analysis
  5. Global Market Pricing Analysis 2020 to 2024 and Forecast 2025 to 2035
  6. Global Market Analysis 2020 to 2024 and Forecast 2025 to 2035, By Product Type
    • Introduction / Key Findings
    • Historical Market Size Value (USD Billion) & Volume (MT) Analysis By Product Type, 2020 to 2024
    • Current and Future Market Size Value (USD Billion) & Volume (MT) Analysis and Forecast By Product Type, 2025 to 2035
      • Borosilicate Glass
      • Soda-Lime Glass
      • Quartz Glass
      • Others
    • Y-o-Y Growth Trend Analysis By Product Type, 2020 to 2024
    • Absolute $ Opportunity Analysis By Product Type, 2025 to 2035
  7. Global Market Analysis 2020 to 2024 and Forecast 2025 to 2035, By Material Composition
    • Introduction / Key Findings
    • Historical Market Size Value (USD Billion) & Volume (MT) Analysis By Material Composition, 2020 to 2024
    • Current and Future Market Size Value (USD Billion) & Volume (MT) Analysis and Forecast By Material Composition, 2025 to 2035
      • Lead-Free Glass
      • Recycled Glass
      • Coated Glass
      • Laminated Glass
      • Others
    • Y-o-Y Growth Trend Analysis By Material Composition, 2020 to 2024
    • Absolute $ Opportunity Analysis By Material Composition, 2025 to 2035
  8. Global Market Analysis 2020 to 2024 and Forecast 2025 to 2035, By End Use
    • Introduction / Key Findings
    • Historical Market Size Value (USD Billion) & Volume (MT) Analysis By End Use, 2020 to 2024
    • Current and Future Market Size Value (USD Billion) & Volume (MT) Analysis and Forecast By End Use, 2025 to 2035
      • Dairy & Beverages
      • Bakery & Confectionery
      • Fruits & Vegetables
      • Meat & Seafood
      • Others (Ready-To-Eat Meals, Sauces)
    • Y-o-Y Growth Trend Analysis By End Use, 2020 to 2024
    • Absolute $ Opportunity Analysis By End Use, 2025 to 2035
  9. Global Market Analysis 2020 to 2024 and Forecast 2025 to 2035, By Region
    • Introduction
    • Historical Market Size Value (USD Billion) & Volume (MT) Analysis By Region, 2020 to 2024
    • Current Market Size Value (USD Billion) & Volume (MT) Analysis and Forecast By Region, 2025 to 2035
      • North America
      • Latin America
      • Europe
      • East Asia
      • South Asia
      • Oceania
      • MEA
    • Market Attractiveness Analysis By Region
  10. North America Market Analysis 2020 to 2024 and Forecast 2025 to 2035, By Country
    • Historical Market Size Value (USD Billion) & Volume (MT) Trend Analysis By Market Taxonomy, 2020 to 2024
    • Market Size Value (USD Billion) & Volume (MT) Forecast By Market Taxonomy, 2025 to 2035
      • By Country
        • USA
        • Canada
      • By Product Type
      • By Material Composition
      • By End Use
    • Market Attractiveness Analysis
      • By Country
      • By Product Type
      • By Material Composition
      • By End Use
    • Key Takeaways
  11. Latin America Market Analysis 2020 to 2024 and Forecast 2025 to 2035, By Country
    • Historical Market Size Value (USD Billion) & Volume (MT) Trend Analysis By Market Taxonomy, 2020 to 2024
    • Market Size Value (USD Billion) & Volume (MT) Forecast By Market Taxonomy, 2025 to 2035
      • By Country
        • Brazil
        • Mexico
        • Argentina
        • Chile
        • Peru
        • Rest of Latin America
      • By Product Type
      • By Material Composition
      • By End Use
    • Market Attractiveness Analysis
      • By Country
      • By Product Type
      • By Material Composition
      • By End Use
    • Key Takeaways
  12. Europe Market Analysis 2020 to 2024 and Forecast 2025 to 2035, By Country
    • Historical Market Size Value (USD Billion) & Volume (MT) Trend Analysis By Market Taxonomy, 2020 to 2024
    • Market Size Value (USD Billion) & Volume (MT) Forecast By Market Taxonomy, 2025 to 2035
      • By Country
        • Germany
        • Italy
        • France
        • UK
        • Spain
        • Russia
        • BENELUX
        • Rest of Europe
      • By Product Type
      • By Material Composition
      • By End Use
    • Market Attractiveness Analysis
      • By Country
      • By Product Type
      • By Material Composition
      • By End Use
    • Key Takeaways
  13. East Asia Market Analysis 2020 to 2024 and Forecast 2025 to 2035, By Country
    • Historical Market Size Value (USD Billion) & Volume (MT) Trend Analysis By Market Taxonomy, 2020 to 2024
    • Market Size Value (USD Billion) & Volume (MT) Forecast By Market Taxonomy, 2025 to 2035
      • By Country
        • China
        • Japan
        • South Korea
      • By Product Type
      • By Material Composition
      • By End Use
    • Market Attractiveness Analysis
      • By Country
      • By Product Type
      • By Material Composition
      • By End Use
    • Key Takeaways
  14. South Asia Market Analysis 2020 to 2024 and Forecast 2025 to 2035, By Country
    • Historical Market Size Value (USD Billion) & Volume (MT) Trend Analysis By Market Taxonomy, 2020 to 2024
    • Market Size Value (USD Billion) & Volume (MT) Forecast By Market Taxonomy, 2025 to 2035
      • By Country
        • India
        • Thailand
        • Malaysia
        • Indonesia
        • Rest of South Asia
      • By Product Type
      • By Material Composition
      • By End Use
    • Market Attractiveness Analysis
      • By Country
      • By Product Type
      • By Material Composition
      • By End Use
    • Key Takeaways
  15. Oceania Market Analysis 2020 to 2024 and Forecast 2025 to 2035, By Country
    • Historical Market Size Value (USD Billion) & Volume (MT) Trend Analysis By Market Taxonomy, 2020 to 2024
    • Market Size Value (USD Billion) & Volume (MT) Forecast By Market Taxonomy, 2025 to 2035
      • By Country
        • Australia
        • New Zealand
      • By Product Type
      • By Material Composition
      • By End Use
    • Market Attractiveness Analysis
      • By Country
      • By Product Type
      • By Material Composition
      • By End Use
    • Key Takeaways
  16. MEA Market Analysis 2020 to 2024 and Forecast 2025 to 2035, By Country
    • Historical Market Size Value (USD Billion) & Volume (MT) Trend Analysis By Market Taxonomy, 2020 to 2024
    • Market Size Value (USD Billion) & Volume (MT) Forecast By Market Taxonomy, 2025 to 2035
      • By Country
        • GCC
        • Rest of MEA
      • By Product Type
      • By Material Composition
      • By End Use
    • Market Attractiveness Analysis
      • By Country
      • By Product Type
      • By Material Composition
      • By End Use
    • Key Takeaways
  17. Key Countries Market Analysis
    • USA
      • Pricing Analysis
      • Market Share Analysis, 2024
        • By Product Type
        • By Material Composition
        • By End Use
    • Canada
      • Pricing Analysis
      • Market Share Analysis, 2024
        • By Product Type
        • By Material Composition
        • By End Use
    • Brazil
      • Pricing Analysis
      • Market Share Analysis, 2024
        • By Product Type
        • By Material Composition
        • By End Use
    • Mexico
      • Pricing Analysis
      • Market Share Analysis, 2024
        • By Product Type
        • By Material Composition
        • By End Use
    • Argentina
      • Pricing Analysis
      • Market Share Analysis, 2024
        • By Product Type
        • By Material Composition
        • By End Use
  18. Market Structure Analysis
    • Competition Dashboard
    • Competition Benchmarking
    • Market Share Analysis of Top Players
      • By Regional
      • By Product Type
      • By Material Composition
      • By End Use
  19. Competition Analysis
    • Competition Deep Dive
      • Owens-Illinois, Inc. (O-I Glass)
        • Overview
        • Product Portfolio
        • Profitability by Market Segments (Product/Age /Sales Channel/Region)
        • Sales Footprint
        • Strategy Overview
          • Marketing Strategy
          • Product Strategy
          • Channel Strategy
      • Ardagh Group S.A.
        • Overview
        • Product Portfolio
        • Profitability by Market Segments (Product/Age /Sales Channel/Region)
        • Sales Footprint
        • Strategy Overview
          • Marketing Strategy
          • Product Strategy
          • Channel Strategy
      • Verallia
        • Overview
        • Product Portfolio
        • Profitability by Market Segments (Product/Age /Sales Channel/Region)
        • Sales Footprint
        • Strategy Overview
          • Marketing Strategy
          • Product Strategy
          • Channel Strategy
      • Vetropack Holding Ltd.
        • Overview
        • Product Portfolio
        • Profitability by Market Segments (Product/Age /Sales Channel/Region)
        • Sales Footprint
        • Strategy Overview
          • Marketing Strategy
          • Product Strategy
          • Channel Strategy
      • Schott AG
        • Overview
        • Product Portfolio
        • Profitability by Market Segments (Product/Age /Sales Channel/Region)
        • Sales Footprint
        • Strategy Overview
          • Marketing Strategy
          • Product Strategy
          • Channel Strategy
      • Sisecam Group
        • Overview
        • Product Portfolio
        • Profitability by Market Segments (Product/Age /Sales Channel/Region)
        • Sales Footprint
        • Strategy Overview
          • Marketing Strategy
          • Product Strategy
          • Channel Strategy
      • BA Glass Germany GmbH
        • Overview
        • Product Portfolio
        • Profitability by Market Segments (Product/Age /Sales Channel/Region)
        • Sales Footprint
        • Strategy Overview
          • Marketing Strategy
          • Product Strategy
          • Channel Strategy
      • AGI Glaspac
        • Overview
        • Product Portfolio
        • Profitability by Market Segments (Product/Age /Sales Channel/Region)
        • Sales Footprint
        • Strategy Overview
          • Marketing Strategy
          • Product Strategy
          • Channel Strategy
      • Piramal Glass Private Limited
        • Overview
        • Product Portfolio
        • Profitability by Market Segments (Product/Age /Sales Channel/Region)
        • Sales Footprint
        • Strategy Overview
          • Marketing Strategy
          • Product Strategy
          • Channel Strategy
      • Heinz Glas GmbH & Co. KGaA
        • Overview
        • Product Portfolio
        • Profitability by Market Segments (Product/Age /Sales Channel/Region)
        • Sales Footprint
        • Strategy Overview
          • Marketing Strategy
          • Product Strategy
          • Channel Strategy
      • Nihon Yamamura Glass Co., Ltd.
        • Overview
        • Product Portfolio
        • Profitability by Market Segments (Product/Age /Sales Channel/Region)
        • Sales Footprint
        • Strategy Overview
          • Marketing Strategy
          • Product Strategy
          • Channel Strategy
      • Shandong Huapeng Glass Co., Ltd.
        • Overview
        • Product Portfolio
        • Profitability by Market Segments (Product/Age /Sales Channel/Region)
        • Sales Footprint
        • Strategy Overview
          • Marketing Strategy
          • Product Strategy
          • Channel Strategy
  20. Assumptions & Acronyms Used
  21. Research Methodology

List of Tables

  • Table 1: Global Market Value (USD Billion) Forecast by Region, 2020 to 2035
  • Table 2: Global Market Volume (MT) Forecast by Region, 2020 to 2035
  • Table 3: Global Market Value (USD billion) Forecast by Product Type, 2020 to 2035
  • Table 4: Global Market Volume (MT) Forecast by Product Type, 2020 to 2035
  • Table 5: Global Market Value (USD Billion) Forecast by Material Composition, 2020 to 2035
  • Table 6: Global Market Volume (MT) Forecast by Material Composition, 2020 to 2035
  • Table 7: Global Market Value (USD Billion) Forecast by End Use, 2020 to 2035
  • Table 8: Global Market Volume (MT) Forecast by End Use, 2020 to 2035
  • Table 9: North America Market Value (USD Billion) Forecast by Country, 2020 to 2035
  • Table 10: North America Market Volume (MT) Forecast by Country, 2020 to 2035
  • Table 11: North America Market Value (USD Billion) Forecast by Product Type, 2020 to 2035
  • Table 12: North America Market Volume (MT) Forecast by Product Type, 2020 to 2035
  • Table 13: North America Market Value (USD Billion) Forecast by Material Composition, 2020 to 2035
  • Table 14: North America Market Volume (MT) Forecast by Material Composition, 2020 to 2035
  • Table 15: North America Market Value (USD Billion) Forecast by End Use, 2020 to 2035
  • Table 16: North America Market Volume (MT) Forecast by End Use, 2020 to 2035
  • Table 17: Latin America Market Value (USD Billion) Forecast by Country, 2020 to 2035
  • Table 18: Latin America Market Volume (MT) Forecast by Country, 2020 to 2035
  • Table 19: Latin America Market Value (USD Billion) Forecast by Product Type, 2020 to 2035
  • Table 20: Latin America Market Volume (MT) Forecast by Product Type, 2020 to 2035
  • Table 21: Latin America Market Value (USD Billion) Forecast by Material Composition, 2020 to 2035
  • Table 22: Latin America Market Volume (MT) Forecast by Material Composition, 2020 to 2035
  • Table 23: Latin America Market Value (USD Billion) Forecast by End Use, 2020 to 2035
  • Table 24: Latin America Market Volume (MT) Forecast by End Use, 2020 to 2035
  • Table 25: Europe Market Value (USD Billion) Forecast by Country, 2020 to 2035
  • Table 26: Europe Market Volume (MT) Forecast by Country, 2020 to 2035
  • Table 27: Europe Market Value (USD Billion) Forecast by Product Type, 2020 to 2035
  • Table 28: Europe Market Volume (MT) Forecast by Product Type, 2020 to 2035
  • Table 29: Europe Market Value (USD Billion) Forecast by Material Composition, 2020 to 2035
  • Table 30: Europe Market Volume (MT) Forecast by Material Composition, 2020 to 2035
  • Table 31: Europe Market Value (USD Billion) Forecast by End Use, 2020 to 2035
  • Table 32: Europe Market Volume (MT) Forecast by End Use, 2020 to 2035
  • Table 33: East Asia Market Value (USD Billion) Forecast by Country, 2020 to 2035
  • Table 34: East Asia Market Volume (MT) Forecast by Country, 2020 to 2035
  • Table 35: East Asia Market Value (USD Billion) Forecast by Product Type, 2020 to 2035
  • Table 36: East Asia Market Volume (MT) Forecast by Product Type, 2020 to 2035
  • Table 37: East Asia Market Value (USD Billion) Forecast by Material Composition, 2020 to 2035
  • Table 38: East Asia Market Volume (MT) Forecast by Material Composition, 2020 to 2035
  • Table 39: East Asia Market Value (USD Billion) Forecast by End Use, 2020 to 2035
  • Table 40: East Asia Market Volume (MT) Forecast by End Use, 2020 to 2035
  • Table 41: South Asia Market Value (USD Billion) Forecast by Country, 2020 to 2035
  • Table 42: South Asia Market Volume (MT) Forecast by Country, 2020 to 2035
  • Table 43: South Asia Market Value (USD Billion) Forecast by Product Type, 2020 to 2035
  • Table 44: South Asia Market Volume (MT) Forecast by Product Type, 2020 to 2035
  • Table 45: South Asia Market Value (USD Billion) Forecast by Material Composition, 2020 to 2035
  • Table 46: South Asia Market Volume (MT) Forecast by Material Composition, 2020 to 2035
  • Table 47: South Asia Market Value (USD Billion) Forecast by End Use, 2020 to 2035
  • Table 48: South Asia Market Volume (MT) Forecast by End Use, 2020 to 2035
  • Table 49: Oceania Market Value (USD Billion) Forecast by Country, 2020 to 2035
  • Table 50: Oceania Market Volume (MT) Forecast by Country, 2020 to 2035
  • Table 51: Oceania Market Value (USD Billion) Forecast by Product Type, 2020 to 2035
  • Table 52: Oceania Market Volume (MT) Forecast by Product Type, 2020 to 2035
  • Table 53: Oceania Market Value (USD Billion) Forecast by Material Composition, 2020 to 2035
  • Table 54: Oceania Market Volume (MT) Forecast by Material Composition, 2020 to 2035
  • Table 55: Oceania Market Value (USD Billion) Forecast by End Use, 2020 to 2035
  • Table 56: Oceania Market Volume (MT) Forecast by End Use, 2020 to 2035
  • Table 57: MEA Market Value (USD Billion) Forecast by Country, 2020 to 2035
  • Table 58: MEA Market Volume (MT) Forecast by Country, 2020 to 2035
  • Table 59: MEA Market Value (USD Billion) Forecast by Product Type, 2020 to 2035
  • Table 60: MEA Market Volume (MT) Forecast by Product Type, 2020 to 2035
  • Table 61: MEA Market Value (USD Billion) Forecast by Material Composition, 2020 to 2035
  • Table 62: MEA Market Volume (MT) Forecast by Material Composition, 2020 to 2035
  • Table 63: MEA Market Value (USD Billion) Forecast by End Use, 2020 to 2035
  • Table 64: MEA Market Volume (MT) Forecast by End Use, 2020 to 2035

List of Figures

  • Figure 1: Global Market Volume (MT) Forecast 2020 to 2035
  • Figure 2: Global Market Pricing Analysis
  • Figure 3: Global Market Value (USD Billion) Forecast 2020 to 2035
  • Figure 4: Global Market Value Share and BPS Analysis by Product Type, 2025 and 2035
  • Figure 5: Global Market Y-o-Y Growth Comparison by Product Type, 2025 to 2035
  • Figure 6: Global Market Attractiveness Analysis by Product Type
  • Figure 7: Global Market Value Share and BPS Analysis by Material Composition, 2025 and 2035
  • Figure 8: Global Market Y-o-Y Growth Comparison by Material Composition, 2025 to 2035
  • Figure 9: Global Market Attractiveness Analysis by Material Composition
  • Figure 10: Global Market Value Share and BPS Analysis by End Use, 2025 and 2035
  • Figure 11: Global Market Y-o-Y Growth Comparison by End Use, 2025 to 2035
  • Figure 12: Global Market Attractiveness Analysis by End Use
  • Figure 13: Global Market Value (USD Billion) Share and BPS Analysis by Region, 2025 and 2035
  • Figure 14: Global Market Y-o-Y Growth Comparison by Region, 2025 to 2035
  • Figure 15: Global Market Attractiveness Analysis by Region
  • Figure 16: North America Market Incremental $ Opportunity, 2025 to 2035
  • Figure 17: Latin America Market Incremental $ Opportunity, 2025 to 2035
  • Figure 18: Europe Market Incremental $ Opportunity, 2025 to 2035
  • Figure 19: East Asia Market Incremental $ Opportunity, 2025 to 2035
  • Figure 20: South Asia Market Incremental $ Opportunity, 2025 to 2035
  • Figure 21: Oceania Market Incremental $ Opportunity, 2025 to 2035
  • Figure 22: MEA Market Incremental $ Opportunity, 2025 to 2035
  • Figure 23: North America Market Value Share and BPS Analysis by Country, 2025 and 2035
  • Figure 24: North America Market Value Share and BPS Analysis by Product Type, 2025 and 2035
  • Figure 25: North America Market Y-o-Y Growth Comparison by Product Type, 2025 to 2035
  • Figure 26: North America Market Attractiveness Analysis by Product Type
  • Figure 27: North America Market Value Share and BPS Analysis by Material Composition, 2025 and 2035
  • Figure 28: North America Market Y-o-Y Growth Comparison by Material Composition, 2025 to 2035
  • Figure 29: North America Market Attractiveness Analysis by Material Composition
  • Figure 30: North America Market Value Share and BPS Analysis by End Use, 2025 and 2035
  • Figure 31: North America Market Y-o-Y Growth Comparison by End Use, 2025 to 2035
  • Figure 32: North America Market Attractiveness Analysis by End Use
  • Figure 33: Latin America Market Value Share and BPS Analysis by Country, 2025 and 2035
  • Figure 34: Latin America Market Value Share and BPS Analysis by Product Type, 2025 and 2035
  • Figure 35: Latin America Market Y-o-Y Growth Comparison by Product Type, 2025 to 2035
  • Figure 36: Latin America Market Attractiveness Analysis by Product Type
  • Figure 37: Latin America Market Value Share and BPS Analysis by Material Composition, 2025 and 2035
  • Figure 38: Latin America Market Y-o-Y Growth Comparison by Material Composition, 2025 to 2035
  • Figure 39: Latin America Market Attractiveness Analysis by Material Composition
  • Figure 40: Latin America Market Value Share and BPS Analysis by End Use, 2025 and 2035
  • Figure 41: Latin America Market Y-o-Y Growth Comparison by End Use, 2025 to 2035
  • Figure 42: Latin America Market Attractiveness Analysis by End Use
  • Figure 43: Europe Market Value Share and BPS Analysis by Country, 2025 and 2035
  • Figure 44: Europe Market Value Share and BPS Analysis by Product Type, 2025 and 2035
  • Figure 45: Europe Market Y-o-Y Growth Comparison by Product Type, 2025 to 2035
  • Figure 46: Europe Market Attractiveness Analysis by Product Type
  • Figure 47: Europe Market Value Share and BPS Analysis by Material Composition, 2025 and 2035
  • Figure 48: Europe Market Y-o-Y Growth Comparison by Material Composition, 2025 to 2035
  • Figure 49: Europe Market Attractiveness Analysis by Material Composition
  • Figure 50: Europe Market Value Share and BPS Analysis by End Use, 2025 and 2035
  • Figure 51: Europe Market Y-o-Y Growth Comparison by End Use, 2025 to 2035
  • Figure 52: Europe Market Attractiveness Analysis by End Use
  • Figure 53: East Asia Market Value Share and BPS Analysis by Country, 2025 and 2035
  • Figure 54: East Asia Market Value Share and BPS Analysis by Product Type, 2025 and 2035
  • Figure 55: East Asia Market Y-o-Y Growth Comparison by Product Type, 2025 to 2035
  • Figure 56: East Asia Market Attractiveness Analysis by Product Type
  • Figure 57: East Asia Market Value Share and BPS Analysis by Material Composition, 2025 and 2035
  • Figure 58: East Asia Market Y-o-Y Growth Comparison by Material Composition, 2025 to 2035
  • Figure 59: East Asia Market Attractiveness Analysis by Material Composition
  • Figure 60: East Asia Market Value Share and BPS Analysis by End Use, 2025 and 2035
  • Figure 61: East Asia Market Y-o-Y Growth Comparison by End Use, 2025 to 2035
  • Figure 62: East Asia Market Attractiveness Analysis by End Use
  • Figure 63: South Asia Market Value Share and BPS Analysis by Country, 2025 and 2035
  • Figure 64: South Asia Market Value Share and BPS Analysis by Product Type, 2025 and 2035
  • Figure 65: South Asia Market Y-o-Y Growth Comparison by Product Type, 2025 to 2035
  • Figure 66: South Asia Market Attractiveness Analysis by Product Type
  • Figure 67: South Asia Market Value Share and BPS Analysis by Material Composition, 2025 and 2035
  • Figure 68: South Asia Market Y-o-Y Growth Comparison by Material Composition, 2025 to 2035
  • Figure 69: South Asia Market Attractiveness Analysis by Material Composition
  • Figure 70: South Asia Market Value Share and BPS Analysis by End Use, 2025 and 2035
  • Figure 71: South Asia Market Y-o-Y Growth Comparison by End Use, 2025 to 2035
  • Figure 72: South Asia Market Attractiveness Analysis by End Use
  • Figure 73: Oceania Market Value Share and BPS Analysis by Country, 2025 and 2035
  • Figure 74: Oceania Market Value Share and BPS Analysis by Product Type, 2025 and 2035
  • Figure 75: Oceania Market Y-o-Y Growth Comparison by Product Type, 2025 to 2035
  • Figure 76: Oceania Market Attractiveness Analysis by Product Type
  • Figure 77: Oceania Market Value Share and BPS Analysis by Material Composition, 2025 and 2035
  • Figure 78: Oceania Market Y-o-Y Growth Comparison by Material Composition, 2025 to 2035
  • Figure 79: Oceania Market Attractiveness Analysis by Material Composition
  • Figure 80: Oceania Market Value Share and BPS Analysis by End Use, 2025 and 2035
  • Figure 81: Oceania Market Y-o-Y Growth Comparison by End Use, 2025 to 2035
  • Figure 82: Oceania Market Attractiveness Analysis by End Use
  • Figure 83: MEA Market Value Share and BPS Analysis by Country, 2025 and 2035
  • Figure 84: MEA Market Value Share and BPS Analysis by Product Type, 2025 and 2035
  • Figure 85: MEA Market Y-o-Y Growth Comparison by Product Type, 2025 to 2035
  • Figure 86: MEA Market Attractiveness Analysis by Product Type
  • Figure 87: MEA Market Value Share and BPS Analysis by Material Composition, 2025 and 2035
  • Figure 88: MEA Market Y-o-Y Growth Comparison by Material Composition, 2025 to 2035
  • Figure 89: MEA Market Attractiveness Analysis by Material Composition
  • Figure 90: MEA Market Value Share and BPS Analysis by End Use, 2025 and 2035
  • Figure 91: MEA Market Y-o-Y Growth Comparison by End Use, 2025 to 2035
  • Figure 92: MEA Market Attractiveness Analysis by End Use
  • Figure 93: Global Market - Tier Structure Analysis
  • Figure 94: Global Market - Company Share Analysis

Frequently Asked Questions

What is the projected size of the food grade glass market by 2035?

The food grade glass industry is forecasted to reach USD 4.7 billion by 2035.

What CAGR is expected for the food grade glass market during 2025 to 2035?

The industry is anticipated to grow at a CAGR of 4.9% over the forecast period.

What was the estimated valuation of the food grade glass market in 2025?

The food grade glass industry was valued at USD 2.9 billion in 2025.

What share is held by borosilicate in the food grade glass market in 2025?

Borosilicate glass accounts for 66% of the industry in 2025.

How much of the beverage packaging segment is occupied by glass in the food grade glass market?

Glass represents about 38-46% of the beverage packaging segment within the food grade glass industry.

Explore Similar Insights

Future Market Insights

Food Grade Glass Market