Reports

- Global Locations -

Headquarters

Future Market Insights, Inc.

Christiana Corporate, 200
Continental Drive, Suite 401,
Newark, Delaware - 19713,
United States

T: +1-845-579-5705

Americas

Future Market Insights, Inc.

616 Corporate Way, Suite 2-9018,
Valley Cottage, NY 10989, United States

T: +1-347-918-3531

MEA

Future Market Insights

1602-6 Jumeirah Bay X2 Tower, Plot No: JLT-PH2-X2A,
Jumeirah Lakes Towers, Dubai,
United Arab Emirates

Europe

Future Market Insights

3rd Floor, 207 Regent Street,
W1B 3HH London
United Kingdom

T: + 44 (0) 20 8123 9659
D: +44 (0) 20 3287 4268

Asia Pacific

Future Market Insights

IndiaLand Global Tech Park, Unit UG-1, Behind Grand HighStreet, Phase 1, Hinjawadi, MH, Pune – 411057, India

Food Irradiation Equipment Market Outlook (2023 to 2033)

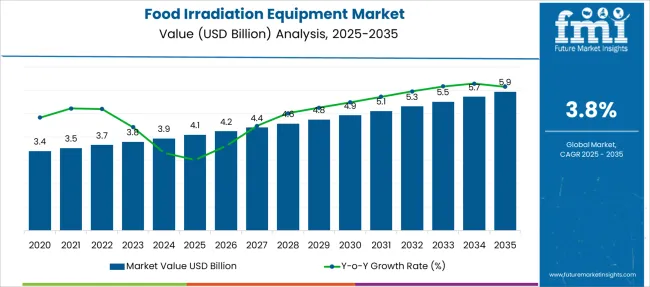
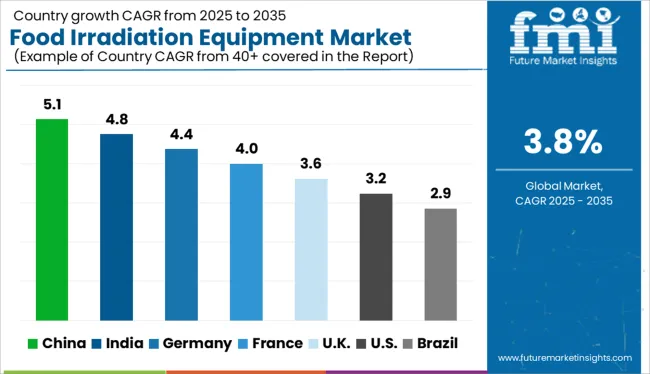
During the projected period (2023 to 2033), the global food irradiation equipment market is expected to grow at a CAGR of 3.8%. The food irradiation equipment market is projected to grow from US$ 13,800 million in 2022 to US$ 20,037.9 million by the end of 2033.

Food irradiation is considered to be a unique process in which X-rays, electron beams, and gamma rays are utilized to preserve, disinfect, and sterilize food items. The novel process helps to lower food spoilage by parasites, bacteria, and insects.

Rising consumer acceptance of food irradiation is anticipated to push the global food irradiation equipment market in the next ten years. The US Food and Drug Administration (FDA), for instance, recently approved the irradiation of fresh fruits and vegetables as a phytosanitary treatment. The US FDA has also suggested that the food irradiation process is effective and safe in offering protection against spoilage of vegetables and fruits.

Besides, rising concerns regarding high food losses from spoilage, contamination, and infection are another crucial factor that is projected to drive the global food irradiation equipment market in the assessment period. The increasing prevalence of various food-borne diseases is also expected to augur well for the global market.

As per the World Health Organization (WHO), nearly 600 million, i.e. 1 in 10 people across the globe fall ill after eating contaminated food, while over 4,20,000 people die every year, which results in the loss of 33 million healthy life years. Also, approximately US$ 10 Billion is lost each year in terms of medical expenses and productivity resulting from unsafe food in middle- and low-income countries.

Foodborne illnesses are primarily toxic and infectious in nature. These are caused due to chemical substances, parasites, viruses, or bacteria entering the body through contaminated food. Thus, government agencies in various countries are investing huge sums to set up food disinfection units to keep up with the surging demand for safe food & beverages.

Moreover, chemical contamination often results in long-term diseases such as cancer or acute poisoning. Several foodborne diseases can lead to death, as well as long-lasting disability. Therefore, food manufacturing companies are striving to maintain their leading positions in the industry by disinfecting their in-house products through food irradiation equipment.

Attributes Key Insights
Global Food Irradiation Equipment Market Estimated Size (2023E) US$ 13,800.0 Million
Projected Market Valuation (2033F) US$ 20,037.9 Million
Value-based CAGR (2023 to 2033) 3.8%
Market Share of the US in North America 68%

Don't pay for what you don't need

Customize your report by selecting specific countries or regions and save 30%!

2018 to 2022 Global Food Irradiation Equipment Market Outlook Compared to 2023 to 2033 Demand Forecast

As per FMI, the global food irradiation equipment market witnessed steady growth at a CAGR of 5.8% during the historical period from 2018 to 2022. As superior food quality and safety could be ensured by extensively using irradiation in conjunction with standard food safety procedures such as heat or chemical treatments, packaging, washing, and refrigeration or freezing, demand for food irradiation equipment is likely to surge in the next ten years.

Furthermore, the rising propensity to food irradiation on the back of high acceptance among modern consumers is another significant factor pushing sales in the global food irradiation equipment market. Rising awareness among consumers regarding food-borne disease prevention is also expected to bolster the market.

The ability of food irradiation technology to eliminate pathogenic microorganisms, accelerate decontamination & process safety, reduce the use of chemical disinfestation, and extend the shelf life of food is further estimated to fuel the global food irradiation equipment market. Based on the type of products that are permitted for irradiation in several regions across the globe, the level of irradiated food acceptance varies significantly.

Some of the most commonly irradiated food products around the world include dry seasonings, herbs, and spices. Owing to the aforementioned factors, the food irradiation equipment market is expected to witness a CAGR of around 3.8% from 2023 to 2033.

Some of the Crucial Drivers, Restraints, and Opportunities in the Global Food Irradiation Equipment Market Include

DRIVERS

  • Implementation of stringent food safety norms by governments of various countries is likely to push the market.
  • As the consumption of contaminated food items can lead to legal consequences, key companies are set to demand advanced irradiation equipment.

RESTRAINTS

  • Unorganized and small companies may not have necessarily adopted advanced food safety practices, thereby resulting in a greater risk of contamination.
  • Lack of expertise for the use of legislation at grass root levels, technical skills, and institutional coordination may hamper sales of food irradiation equipment.

OPPORTUNITIES

  • High demand for better food hygiene methods can create pressure on value chain participants to provide high food safety.
  • The use of information technology in the market is set to help firms to track down customer information and food expiration dates.
Nandini Roy Choudhury

Principal Consultant

Talk to Analyst

Find your sweet spots for generating winning opportunities in this market.

Country-wise Insights

How are US-based Food Irradiation Equipment Companies Progressing?

“The US Government to Place High Importance on Food Irradiation Machines by 2033”

According to food safety experts in the US, food irradiation, which is referred to as the application of radiation exposure to food, is an ideal food safety practice since it does not make food products radioactive, compromises the nutritional quality, and significantly alters their taste, texture, or appearance.

Some items imported into the country require this approach. In the US, some producers also irradiate uncooked ground beef. As a result, the demand for food irradiation equipment is quickly increasing in the country.

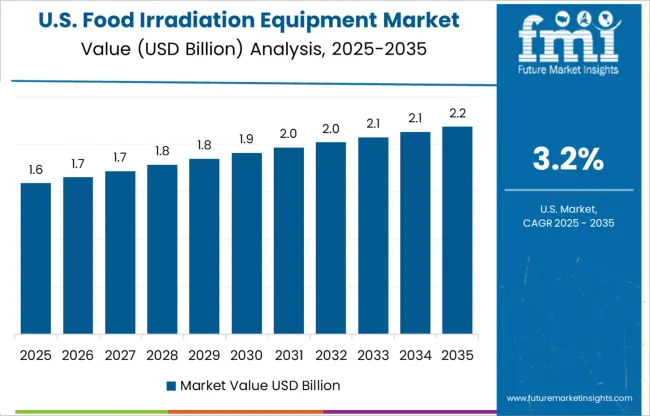
The US Food and Drug Administration (FDA), the World Health Organization (WHO), the Centers for Disease Control and Prevention (CDC), and the United States Department of Agriculture (USDA) all view irradiated food as safe. The FDA is in charge of controlling food irradiation in the country. The above-mentioned organizations are projected to boost sales in the US food irradiation equipment market during the next ten years.

What is the Performance of the Indian Food Irradiation Equipment Manufacturers?

“Rising Export of Spices and Mangoes from India to Spur Sales of Gamma Irradiation Equipment”

In India, food can be processed with radiation for both international and domestic markets. Food can also be treated for export to extend its life span, preserve production, and evade quarantine hurdles. India is well-known for its diverse culinary exports. Food irradiation equipment can be used to lower the costs of bulk materials in international markets and to immediately provide clients with value-added packaged items.

Using this technology, the country was reportedly able to export a famous Indian mango to the United States. India has one of the largest domestic markets in the world. Cereals, legumes, by-products, fruits & vegetables, seafood, and spice are all procured, stored, and delivered in massive numbers throughout the country. Infestations can be eradicated by radiation processing. As a result, the demand for food irradiation equipment is constantly expanding in India.

How Will Key Food Irradiation Equipment Firms Target the Emerging Nation of China?

“High Demand for Shelf-Stable Products in China to Augment the Need for High-Pressure Processing Equipment”

According to FMI, China has long struggled to balance food supplies and needs. Regional shortages caused by natural disasters and other factors continue to be a severe worry. China, while being a top-ranking country in terms of population, only has around one-fifth of the world's fertile land. Rising food manufacturing alone may not have been the answer for China. Instead, China needs to expand shelf-stable products and thus food irradiation equipment is in high demand in the country.

More than 200,000 metric tons of food are allegedly radioactively treated in China. Around 13 irradiation facilities in Yunnan, Sichuan, Chongqing, Guizhou, Shanxi, Gansu, and Xinjiang treated a total of 6800 tons of beef pickled chicken, and other meats. There are around twenty (20) cobalt and 60 irradiation facilities in China.

Category-wise Insights

Who is the Leading End User of Food Irradiation Equipment across the Globe?

“Food Irradiation Tools are Likely to Be Used by Various Food Processing Companies”

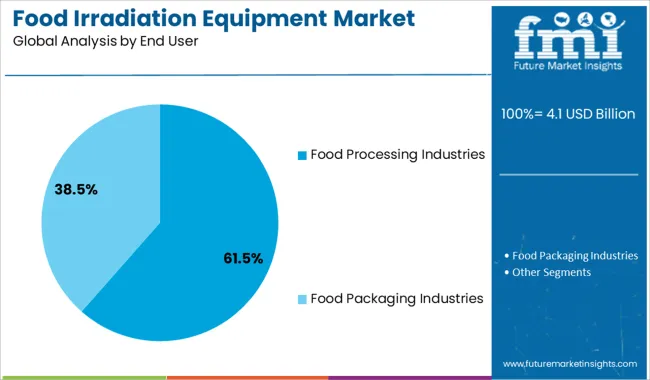
By end user, the food processing industry segment is estimated to remain at the forefront in the global food irradiation equipment market during the next ten years. Irradiation does not render foods radioactive, decrease nutritional content, or alter the taste, consistency, and texture of food in any noticeable way. The effects of irradiation are so minor that determining whether or not a foodstuff has been irradiated is difficult.

Ionizing irradiation is a novel method that reduces or eliminates bacteria and insects from foods, thereby improving their safety and extending their shelf life. Irradiation, like pasteurized milk and the canning of fruits and vegetables, can make the food safer for consumers. As a result, there is a good likelihood that demand for food irradiation equipment will rise in the food processing industry.
Get the data you need at a Fraction of the cost

Personalize your report by choosing insights you need
and save 40%!

Competitive Landscape

The global food irradiation equipment market is highly fragmented with the presence of a large number of medium- and small-scale companies. The majority of the companies are aiming to expand their portfolios by launching state-of-the-art products. A few others are joining hands with government organizations to distribute their in-house products in various parts of the globe by gaining fast-track approvals.

For instance,

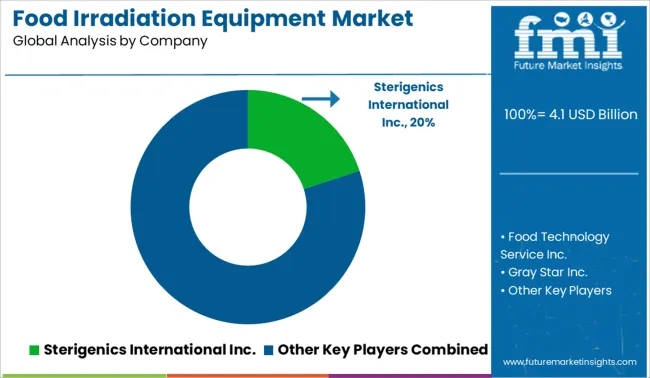
  • For regulatory compliance, Sterigenics International Inc. has years of experience in lowering the pathogen count in packaging. Sterigenics provides radiation-based gamma processing through its global network of facilities to help its clients achieve their microbial reduction objectives. Processing with gamma radiation is non-intrusive and economical. The US Food and Drug Administration (FDA) has also provided its approval for radiation-based gamma processing for pathogen reduction and sterilization of food and beverage packaging.

Scope of the Food Irradiation Equipment Machine Market Report

Attribute Details
Estimated Market Size (2023) US$ 13,800.0 Million
Projected Market Valuation (2033) US$ 20,037.9 Million
Value-based CAGR (2023 to 2033) 3.8%
Forecast Period 2018 to 2022
Historical Data Available for 2023 to 2033
Market Analysis Value (US$ Million)
Key Regions Covered
  • North America
  • Latin America
  • Europe
  • South Asia
  • East Asia
  • Oceania
  • Middle East & Africa (MEA)
Key Countries Covered
  • The US
  • Canada
  • Brazil
  • Mexico
  • Germany
  • France
  • The UK
  • BENELUX
  • India
  • Thailand
  • Indonesia
  • Malaysia
  • China
  • Japan
  • South Korea
  • Australia
  • Indonesia
  • New-Zealand
  • North America
  • South America
Key Segments Covered
  • Source
  • Technology
  • End User
  • Region
Key Companies Profiled
  • Food Technology Service Inc.
  • Sterigenics International Inc.
  • Gray Star Inc.
  • Ionisos SA
  • Nordion Inc.
  • Reviss Services Ltd.
  • Sadex Corporation
  • Sterix Isomedix Services
  • Scantech Sciences Inc.
  • Phytosan SA De C
  • Tacleor LLC.
Report Coverage Market Forecast, Company Share Analysis, Competitive Landscape, DROT Analysis, Market Dynamics and Challenges, and Strategic Growth Initiatives

Food Irradiation Equipment Market Outlook by Category

By Source:

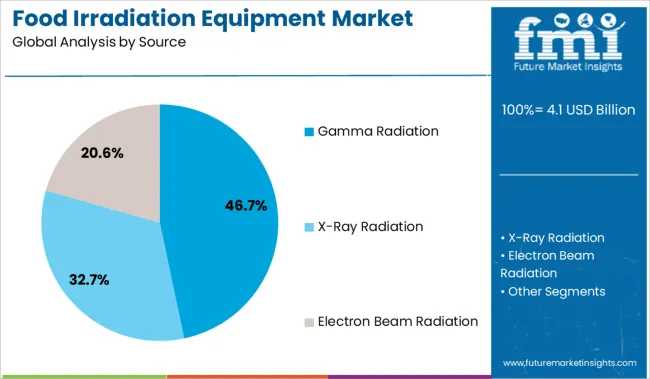
  • Gamma Radiation
  • X-Ray Radiation
  • Electron Beam Radiation

By Technology:

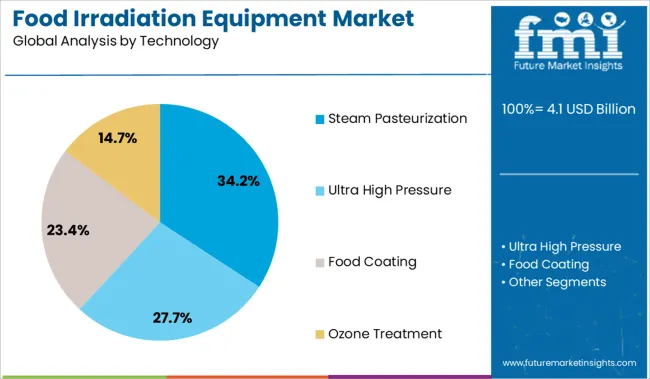
  • Ultra High Pressure
  • Steam Pasteurization
  • Food Coating
  • Ozone Treatment

By End User:

  • Food Processing Industries
  • Food Packaging Industries

By Region:

  • North America
  • Latin America
  • Europe
  • Asia Pacific
  • Middle East & Africa (MEA)

Frequently Asked Questions

How big is the food irradiation equipment market?

The food irradiation equipment market size is expected to reach US$ 13,800.0 Million by the end of 2023.

At what rate is the food irradiation market expected to rise?

The global food irradiation market is expected to witness a CAGR of 3.8% in the forecast period.

What is the North America food irradiation equipment market outlook?

The North American food irradiation equipment market is expected to register a 3.8% CAGR between 2023 and 2033.

Which are the major countries driving demand in the food irradiation equipment market?

The US, Canada, Brazil, Mexico, and Germany are the major countries driving demand in the food irradiation equipment market.

At what rate will the China food irradiation equipment market grow?

The China food irradiation equipment market is projected to grow at a CAGR of around 3.9% over the next ten years.

At what rate will the food irradiation equipment market grow in Europe?

The Europe food irradiation equipment market is expected to grow at a 5.6% CAGR between 2023 and 2033.

Who are the top 5 players operating in the food irradiation equipment market?

Food Technology Service Inc., Sterigenics International Inc., Gray Star Inc., Ionisos SA, and Nordion Inc. are expected to be the top players driving the food irradiation equipment market.

What is the demand outlook forecast for the food irradiation equipment market?

The global food irradiation equipment market is anticipated to surpass US$ 20037.9 Million by the end of 2033.

Table of Content

1. Executive Summary | Food Irradiation Equipment Market

    1.1. Global Market Outlook

    1.2. Demand-side Trends

    1.3. Supply-side Trends

    1.4. Technology Roadmap Analysis

    1.5. Analysis and Recommendations

2. Market Overview

    2.1. Market Coverage / Taxonomy

    2.2. Market Definition / Scope / Limitations

3. Market Background

    3.1. Market Dynamics

        3.1.1. Drivers

        3.1.2. Restraints

        3.1.3. Opportunity 

        3.1.4. Trends

    3.2. Scenario Forecast

        3.2.1. Demand in Optimistic Scenario

        3.2.2. Demand in Likely Scenario

        3.2.3. Demand in Conservative Scenario

    3.3. Product launches & Recent Developments

    3.4. Product Life Cycle Analysis

    3.5. Value Chain Analysis

        3.5.1. Supply Side Participants and their Roles

            3.5.1.1. Producers

            3.5.1.2. Mid-Level Participants (Traders / Agents / Brokers)

            3.5.1.3. Wholesalers and Distributors

        3.5.2. % of Operating Margin Analysis

        3.5.3. List of Raw Material Suppliers

        3.5.4. List of Existing and Potential Buyers

    3.6. Global Drinkable Yogurt Market - Pricing Analysis

        3.6.1. Price Point Assessment by Region 

        3.6.2. Price Point Assessment by Product Type

        3.6.3. Price Forecast till 2033

        3.6.4. Factors affecting Pricing

    3.7. Forecast Factors - Relevance & Impact

    3.8. Regulatory Landscape

        3.8.1. Packaging & Labelling Regulations

        3.8.2. Certifications and Certifying Agency Overview

        3.8.3. Import/Export Policies

    3.9. Regional Parent Market Outlook

    3.10. Consumers Survey Analysis

    3.11. Macro-Economic Factors

    3.12. Product Claims & Nutritional Information scanned by Buyers

4. Global Market Analysis 2018 to 2022 and Forecast, 2023 to 2033

    4.1. Historical Market Size Value (US$ Million) & Volume (MT) Analysis, 2018 to 2022

    4.2. Current and Future Market Size Value (US$ Million) & Volume (MT) Projections, 2023 to 2033

        4.2.1. Y-o-Y Growth Trend Analysis

        4.2.2. Absolute $ Opportunity Analysis

5. Global Market Analysis 2018 to 2022 and Forecast 2023 to 2033, By Source

    5.1. Introduction / Key Findings

    5.2. Historical Market Size Value (US$ Million) & Volume (MT) Analysis By Source, 2018 to 2022

    5.3. Current and Future Market Size Value (US$ Million) & Volume (MT) Analysis and Forecast By Source, 2023 to 2033

        5.3.1. Gama Radiation

        5.3.2. X-Ray Radiation

        5.3.3. Electron Beam Radiation

    5.4. Y-o-Y Growth Trend Analysis By Source, 2018 to 2022

    5.5. Absolute $ Opportunity Analysis By Source, 2023 to 2033

6. Global Market Analysis 2018 to 2022 and Forecast 2023 to 2033, By Technology

    6.1. Introduction / Key Findings

    6.2. Historical Market Size Value (US$ Million) & Volume (MT) Analysis By Technology, 2018 to 2022

    6.3. Current and Future Market Size Value (US$ Million) & Volume (MT) Analysis and Forecast By Technology, 2023 to 2033

        6.3.1. Ultra High Pressure

        6.3.2. Steam Pasteurization

        6.3.3. Food Coating

        6.3.4. Ozone Treatment

    6.4. Y-o-Y Growth Trend Analysis By Technology, 2018 to 2022

    6.5. Absolute $ Opportunity Analysis By Technology, 2023 to 2033

7. Global Market Analysis 2018 to 2022 and Forecast 2023 to 2033, By End-user

    7.1. Introduction / Key Findings

    7.2. Historical Market Size Value (US$ Million) & Volume (MT) Analysis By End-user, 2018 to 2022

    7.3. Current and Future Market Size Value (US$ Million) & Volume (MT) Analysis and Forecast By End-user, 2023 to 2033

        7.3.1. Food processing Industries

        7.3.2. Food packaging Industries

    7.4. Y-o-Y Growth Trend Analysis By End-user, 2018 to 2022

    7.5. Absolute $ Opportunity Analysis By End-user, 2023 to 2033

8. Global Market Analysis 2018 to 2022 and Forecast 2023 to 2033, By Region

    8.1. Introduction

    8.2. Historical Market Size Value (US$ Million) & Volume (MT) Analysis By Region, 2018 to 2022

    8.3. Current Market Size Value (US$ Million) & Volume (MT) Analysis and Forecast By Region, 2023 to 2033

        8.3.1. North America

        8.3.2. Latin America

        8.3.3. Europe

        8.3.4. East Asia

        8.3.5. South Asia

        8.3.6. Oceania

        8.3.7. Middle East & Africa (MEA)

    8.4. Market Attractiveness Analysis By Region

9. North America Market Analysis 2018 to 2022 and Forecast 2023 to 2033, By Country

    9.1. Historical Market Size Value (US$ Million) & Volume (MT) Trend Analysis By Market Taxonomy, 2018 to 2022

    9.2. Market Size Value (US$ Million) & Volume (MT) Forecast By Market Taxonomy, 2023 to 2033

        9.2.1. By Country

            9.2.1.1. The US

            9.2.1.2. Canada

        9.2.2. By Type

        9.2.3. By Technology

        9.2.4. By End-user

    9.3. Market Attractiveness Analysis

        9.3.1. By Country

        9.3.2. By Type

        9.3.3. By Technology

        9.3.4. By End-user

    9.4. Key Takeaways

10. Latin America Market Analysis 2018 to 2022 and Forecast 2023 to 2033, By Country

    10.1. Historical Market Size Value (US$ Million) & Volume (MT) Trend Analysis By Market Taxonomy, 2018 to 2022

    10.2. Market Size Value (US$ Million) & Volume (MT) Forecast By Market Taxonomy, 2023 to 2033

        10.2.1. By Country

            10.2.1.1. Brazil

            10.2.1.2. Mexico

            10.2.1.3. Argentina

            10.2.1.4. Chile

            10.2.1.5. Peru

            10.2.1.6. Rest of Latin America

        10.2.2. By Type

        10.2.3. By Technology

        10.2.4. By End-user

    10.3. Market Attractiveness Analysis

        10.3.1. By Country

        10.3.2. By Type

        10.3.3. By Technology

        10.3.4. By End-user

    10.4. Key Takeaways

11. Europe Market Analysis 2018 to 2022 and Forecast 2023 to 2033, By Country

    11.1. Historical Market Size Value (US$ Million) & Volume (MT) Trend Analysis By Market Taxonomy, 2018 to 2022

    11.2. Market Size Value (US$ Million) & Volume (MT) Forecast By Market Taxonomy, 2023 to 2033

        11.2.1. By Country

            11.2.1.1. Germany

            11.2.1.2. Italy

            11.2.1.3. France

            11.2.1.4. The UK

            11.2.1.5. Spain

            11.2.1.6. Russia

            11.2.1.7. BENELUX

            11.2.1.8. Poland

            11.2.1.9. Nordic Countries

            11.2.1.10. Rest of Europe

        11.2.2. By Type

        11.2.3. By Technology

        11.2.4. By End-user

    11.3. Market Attractiveness Analysis

        11.3.1. By Country

        11.3.2. By Type

        11.3.3. By Technology

        11.3.4. By End-user

    11.4. Key Takeaways

12. East Asia Market Analysis 2018 to 2022 and Forecast 2023 to 2033, By Country

    12.1. Historical Market Size Value (US$ Million) & Volume (MT) Trend Analysis By Market Taxonomy, 2018 to 2022

    12.2. Market Size Value (US$ Million) & Volume (MT) Forecast By Market Taxonomy, 2023 to 2033

        12.2.1. By Country

            12.2.1.1. China

            12.2.1.2. Japan

            12.2.1.3. South Korea

        12.2.2. By Type

        12.2.3. By Technology

        12.2.4. By End-user

    12.3. Market Attractiveness Analysis

        12.3.1. By Country

        12.3.2. By Type

        12.3.3. By Technology

        12.3.4. By End-user

    12.4. Key Takeaways

13. South Asia Market Analysis 2018 to 2022 and Forecast 2023 to 2033, By Country

    13.1. Historical Market Size Value (US$ Million) & Volume (MT) Trend Analysis By Market Taxonomy, 2018 to 2022

    13.2. Market Size Value (US$ Million) & Volume (MT) Forecast By Market Taxonomy, 2023 to 2033

        13.2.1. By Country

            13.2.1.1. India

            13.2.1.2. Thailand

            13.2.1.3. Malaysia

            13.2.1.4. Indonesia

            13.2.1.5. Rest of South Asia

        13.2.2. By Type

        13.2.3. By Technology

        13.2.4. By End-user

    13.3. Market Attractiveness Analysis

        13.3.1. By Country

        13.3.2. By Type

        13.3.3. By Technology

        13.3.4. By End-user

    13.4. Key Takeaways

14. Oceania Market Analysis 2018 to 2022 and Forecast 2023 to 2033, By Country

    14.1. Historical Market Size Value (US$ Million) & Volume (MT) Trend Analysis By Market Taxonomy, 2018 to 2022

    14.2. Market Size Value (US$ Million) & Volume (MT) Forecast By Market Taxonomy, 2023 to 2033

        14.2.1. By Country

            14.2.1.1. Australia

            14.2.1.2. New Zealand

        14.2.2. By Type

        14.2.3. By Technology

        14.2.4. By End-user

    14.3. Market Attractiveness Analysis

        14.3.1. By Country

        14.3.2. By Type

        14.3.3. By Technology

        14.3.4. By End-user

    14.4. Key Takeaways

15. MEA Market Analysis 2018 to 2022 and Forecast 2023 to 2033, By Country

    15.1. Historical Market Size Value (US$ Million) & Volume (MT) Trend Analysis By Market Taxonomy, 2018 to 2022

    15.2. Market Size Value (US$ Million) & Volume (MT) Forecast By Market Taxonomy, 2023 to 2033

        15.2.1. By Country

            15.2.1.1. GCC Countries

            15.2.1.2. South Africa

            15.2.1.3. Central Africa

            15.2.1.4. North Africa

        15.2.2. By Type

        15.2.3. By Technology

        15.2.4. By End-user

    15.3. Market Attractiveness Analysis

        15.3.1. By Country

        15.3.2. By Type

        15.3.3. By Technology

        15.3.4. By End-user

    15.4. Key Takeaways

16. Key Countries Market Analysis

    16.1. The US

        16.1.1. Pricing Analysis

        16.1.2. Market Share Analysis, 2022

            16.1.2.1. By Type

            16.1.2.2. By Technology

            16.1.2.3. By End-user

    16.2. Canada

        16.2.1. Pricing Analysis

        16.2.2. Market Share Analysis, 2022

            16.2.2.1. By Type

            16.2.2.2. By Technology

            16.2.2.3. By End-user

    16.3. Brazil

        16.3.1. Pricing Analysis

        16.3.2. Market Share Analysis, 2022

            16.3.2.1. By Type

            16.3.2.2. By Technology

            16.3.2.3. By End-user

    16.4. Mexico

        16.4.1. Pricing Analysis

        16.4.2. Market Share Analysis, 2022

            16.4.2.1. By Type

            16.4.2.2. By Technology

            16.4.2.3. By End-user

    16.5. Argentina

        16.5.1. Pricing Analysis

        16.5.2. Market Share Analysis, 2022

            16.5.2.1. By Type

            16.5.2.2. By Technology

            16.5.2.3. By End-user

    16.6. Chile

        16.6.1. Pricing Analysis

        16.6.2. Market Share Analysis, 2022

            16.6.2.1. By Type

            16.6.2.2. By Technology

            16.6.2.3. By End-user

    16.7. Peru

        16.7.1. Pricing Analysis

        16.7.2. Market Share Analysis, 2022

            16.7.2.1. By Type

            16.7.2.2. By Technology

            16.7.2.3. By End-user

    16.8. Germany

        16.8.1. Pricing Analysis

        16.8.2. Market Share Analysis, 2022

            16.8.2.1. By Type

            16.8.2.2. By Technology

            16.8.2.3. By End-user

    16.9. Italy

        16.9.1. Pricing Analysis

        16.9.2. Market Share Analysis, 2022

            16.9.2.1. By Type

            16.9.2.2. By Technology

            16.9.2.3. By End-user

    16.10. France

        16.10.1. Pricing Analysis

        16.10.2. Market Share Analysis, 2022

            16.10.2.1. By Type

            16.10.2.2. By Technology

            16.10.2.3. By End-user

    16.11. Spain

        16.11.1. Pricing Analysis

        16.11.2. Market Share Analysis, 2022

            16.11.2.1. By Type

            16.11.2.2. By Technology

            16.11.2.3. By End-user

    16.12. The UK

        16.12.1. Pricing Analysis

        16.12.2. Market Share Analysis, 2022

            16.12.2.1. By Type

            16.12.2.2. By Technology

            16.12.2.3. By End-user

    16.13. Russia

        16.13.1. Pricing Analysis

        16.13.2. Market Share Analysis, 2022

            16.13.2.1. By Type

            16.13.2.2. By Technology

            16.13.2.3. By End-user

    16.14. Poland

        16.14.1. Pricing Analysis

        16.14.2. Market Share Analysis, 2022

            16.14.2.1. By Type

            16.14.2.2. By Technology

            16.14.2.3. By End-user

    16.15. BENELUX

        16.15.1. Pricing Analysis

        16.15.2. Market Share Analysis, 2022

            16.15.2.1. By Type

            16.15.2.2. By Technology

            16.15.2.3. By End-user

    16.16. Nordic Countries

        16.16.1. Pricing Analysis

        16.16.2. Market Share Analysis, 2022

            16.16.2.1. By Type

            16.16.2.2. By Technology

            16.16.2.3. By End-user

    16.17. China

        16.17.1. Pricing Analysis

        16.17.2. Market Share Analysis, 2022

            16.17.2.1. By Type

            16.17.2.2. By Technology

            16.17.2.3. By End-user

    16.18. Japan

        16.18.1. Pricing Analysis

        16.18.2. Market Share Analysis, 2022

            16.18.2.1. By Type

            16.18.2.2. By Technology

            16.18.2.3. By End-user

    16.19. South Korea

        16.19.1. Pricing Analysis

        16.19.2. Market Share Analysis, 2022

            16.19.2.1. By Type

            16.19.2.2. By Technology

            16.19.2.3. By End-user

    16.20. India

        16.20.1. Pricing Analysis

        16.20.2. Market Share Analysis, 2022

            16.20.2.1. By Type

            16.20.2.2. By Technology

            16.20.2.3. By End-user

    16.21. Thailand

        16.21.1. Pricing Analysis

        16.21.2. Market Share Analysis, 2022

            16.21.2.1. By Type

            16.21.2.2. By Technology

            16.21.2.3. By End-user

    16.22. Indonesia

        16.22.1. Pricing Analysis

        16.22.2. Market Share Analysis, 2022

            16.22.2.1. By Type

            16.22.2.2. By Technology

            16.22.2.3. By End-user

    16.23. Malaysia

        16.23.1. Pricing Analysis

        16.23.2. Market Share Analysis, 2022

            16.23.2.1. By Type

            16.23.2.2. By Technology

            16.23.2.3. By End-user

    16.24. Singapore

        16.24.1. Pricing Analysis

        16.24.2. Market Share Analysis, 2022

            16.24.2.1. By Type

            16.24.2.2. By Technology

            16.24.2.3. By End-user

    16.25. GCC Countries

        16.25.1. Pricing Analysis

        16.25.2. Market Share Analysis, 2022

            16.25.2.1. By Type

            16.25.2.2. By Technology

            16.25.2.3. By End-user

    16.26. South Africa

        16.26.1. Pricing Analysis

        16.26.2. Market Share Analysis, 2022

            16.26.2.1. By Type

            16.26.2.2. By Technology

            16.26.2.3. By End-user

    16.27. Central Africa

        16.27.1. Pricing Analysis

        16.27.2. Market Share Analysis, 2022

            16.27.2.1. By Type

            16.27.2.2. By Technology

            16.27.2.3. By End-user

    16.28. North Africa

        16.28.1. Pricing Analysis

        16.28.2. Market Share Analysis, 2022

            16.28.2.1. By Type

            16.28.2.2. By Technology

            16.28.2.3. By End-user

17. Market Structure Analysis

    17.1. Competition Dashboard

    17.2. Competition Benchmarking

    17.3. Market Share Analysis of Top Players

        17.3.1. By Regional

        17.3.2. By Type

        17.3.3. By Technology

        17.3.4. By End-user

18. Competition Analysis

    18.1. Competition Deep Dive

        18.1.1. Food Technology Service Inc.

            18.1.1.1. Overview

            18.1.1.2. Product Portfolio

            18.1.1.3. Profitability by Market Segments

            18.1.1.4. Sales Footprint

            18.1.1.5. Strategy Overview

                18.1.1.5.1. Marketing Strategy

                18.1.1.5.2. Product Strategy

                18.1.1.5.3. Channel Strategy

        18.1.2. Sterigenics International Inc.

            18.1.2.1. Overview

            18.1.2.2. Product Portfolio

            18.1.2.3. Profitability by Market Segments

            18.1.2.4. Sales Footprint

            18.1.2.5. Strategy Overview

                18.1.2.5.1. Marketing Strategy

                18.1.2.5.2. Product Strategy

                18.1.2.5.3. Channel Strategy

        18.1.3. Gray Star Inc.

            18.1.3.1. Overview

            18.1.3.2. Product Portfolio

            18.1.3.3. Profitability by Market Segments

            18.1.3.4. Sales Footprint

            18.1.3.5. Strategy Overview

                18.1.3.5.1. Marketing Strategy

                18.1.3.5.2. Product Strategy

                18.1.3.5.3. Channel Strategy

        18.1.4. Ionisos SA

            18.1.4.1. Overview

            18.1.4.2. Product Portfolio

            18.1.4.3. Profitability by Market Segments

            18.1.4.4. Sales Footprint

            18.1.4.5. Strategy Overview

                18.1.4.5.1. Marketing Strategy

                18.1.4.5.2. Product Strategy

                18.1.4.5.3. Channel Strategy

        18.1.5. Nordion Inc.

            18.1.5.1. Overview

            18.1.5.2. Product Portfolio

            18.1.5.3. Profitability by Market Segments

            18.1.5.4. Sales Footprint

            18.1.5.5. Strategy Overview

                18.1.5.5.1. Marketing Strategy

                18.1.5.5.2. Product Strategy

                18.1.5.5.3. Channel Strategy

        18.1.6. Reviss Services Ltd.

            18.1.6.1. Overview

            18.1.6.2. Product Portfolio

            18.1.6.3. Profitability by Market Segments

            18.1.6.4. Sales Footprint

            18.1.6.5. Strategy Overview

                18.1.6.5.1. Marketing Strategy

                18.1.6.5.2. Product Strategy

                18.1.6.5.3. Channel Strategy

        18.1.7. Sadex Corporation

            18.1.7.1. Overview

            18.1.7.2. Product Portfolio

            18.1.7.3. Profitability by Market Segments

            18.1.7.4. Sales Footprint

            18.1.7.5. Strategy Overview

                18.1.7.5.1. Marketing Strategy

                18.1.7.5.2. Product Strategy

                18.1.7.5.3. Channel Strategy

        18.1.8. Sterix Isomedix Services

            18.1.8.1. Overview

            18.1.8.2. Product Portfolio

            18.1.8.3. Profitability by Market Segments

            18.1.8.4. Sales Footprint

            18.1.8.5. Strategy Overview

                18.1.8.5.1. Marketing Strategy

                18.1.8.5.2. Product Strategy

                18.1.8.5.3. Channel Strategy

        18.1.9. Scantech Sciences Inc.

            18.1.9.1. Overview

            18.1.9.2. Product Portfolio

            18.1.9.3. Profitability by Market Segments

            18.1.9.4. Sales Footprint

            18.1.9.5. Strategy Overview

                18.1.9.5.1. Marketing Strategy

                18.1.9.5.2. Product Strategy

                18.1.9.5.3. Channel Strategy

        18.1.10. Phytosan SA De C

            18.1.10.1. Overview

            18.1.10.2. Product Portfolio

            18.1.10.3. Profitability by Market Segments

            18.1.10.4. Sales Footprint

            18.1.10.5. Strategy Overview

                18.1.10.5.1. Marketing Strategy

                18.1.10.5.2. Product Strategy

                18.1.10.5.3. Channel Strategy

        18.1.11. Tacleor LLC.

            18.1.11.1. Overview

            18.1.11.2. Product Portfolio

            18.1.11.3. Profitability by Market Segments

            18.1.11.4. Sales Footprint

            18.1.11.5. Strategy Overview

                18.1.11.5.1. Marketing Strategy

                18.1.11.5.2. Product Strategy

                18.1.11.5.3. Channel Strategy

19. Assumptions & Acronyms Used

20. Research Methodology

Don't pay for what you don't need

Customize your report by selecting specific countries or regions and save 30%!

List of Tables

Table 1: Global Market Value (US$ Million) Forecast by Region, 2018 to 2033

Table 2: Global Market Volume (MT) Forecast by Region, 2018 to 2033

Table 3: Global Market Value (US$ Million) Forecast by Type, 2018 to 2033

Table 4: Global Market Volume (MT) Forecast by Type, 2018 to 2033

Table 5: Global Market Value (US$ Million) Forecast by Technology, 2018 to 2033

Table 6: Global Market Volume (MT) Forecast by Technology, 2018 to 2033

Table 7: Global Market Value (US$ Million) Forecast by End-user, 2018 to 2033

Table 8: Global Market Volume (MT) Forecast by End-user, 2018 to 2033

Table 9: North America Market Value (US$ Million) Forecast by Country, 2018 to 2033

Table 10: North America Market Volume (MT) Forecast by Country, 2018 to 2033

Table 11: North America Market Value (US$ Million) Forecast by Type, 2018 to 2033

Table 12: North America Market Volume (MT) Forecast by Type, 2018 to 2033

Table 13: North America Market Value (US$ Million) Forecast by Technology, 2018 to 2033

Table 14: North America Market Volume (MT) Forecast by Technology, 2018 to 2033

Table 15: North America Market Value (US$ Million) Forecast by End-user, 2018 to 2033

Table 16: North America Market Volume (MT) Forecast by End-user, 2018 to 2033

Table 17: Latin America Market Value (US$ Million) Forecast by Country, 2018 to 2033

Table 18: Latin America Market Volume (MT) Forecast by Country, 2018 to 2033

Table 19: Latin America Market Value (US$ Million) Forecast by Type, 2018 to 2033

Table 20: Latin America Market Volume (MT) Forecast by Type, 2018 to 2033

Table 21: Latin America Market Value (US$ Million) Forecast by Technology, 2018 to 2033

Table 22: Latin America Market Volume (MT) Forecast by Technology, 2018 to 2033

Table 23: Latin America Market Value (US$ Million) Forecast by End-user, 2018 to 2033

Table 24: Latin America Market Volume (MT) Forecast by End-user, 2018 to 2033

Table 25: Europe Market Value (US$ Million) Forecast by Country, 2018 to 2033

Table 26: Europe Market Volume (MT) Forecast by Country, 2018 to 2033

Table 27: Europe Market Value (US$ Million) Forecast by Type, 2018 to 2033

Table 28: Europe Market Volume (MT) Forecast by Type, 2018 to 2033

Table 29: Europe Market Value (US$ Million) Forecast by Technology, 2018 to 2033

Table 30: Europe Market Volume (MT) Forecast by Technology, 2018 to 2033

Table 31: Europe Market Value (US$ Million) Forecast by End-user, 2018 to 2033

Table 32: Europe Market Volume (MT) Forecast by End-user, 2018 to 2033

Table 33: East Asia Market Value (US$ Million) Forecast by Country, 2018 to 2033

Table 34: East Asia Market Volume (MT) Forecast by Country, 2018 to 2033

Table 35: East Asia Market Value (US$ Million) Forecast by Type, 2018 to 2033

Table 36: East Asia Market Volume (MT) Forecast by Type, 2018 to 2033

Table 37: East Asia Market Value (US$ Million) Forecast by Technology, 2018 to 2033

Table 38: East Asia Market Volume (MT) Forecast by Technology, 2018 to 2033

Table 39: East Asia Market Value (US$ Million) Forecast by End-user, 2018 to 2033

Table 40: East Asia Market Volume (MT) Forecast by End-user, 2018 to 2033

Table 41: South Asia Market Value (US$ Million) Forecast by Country, 2018 to 2033

Table 42: South Asia Market Volume (MT) Forecast by Country, 2018 to 2033

Table 43: South Asia Market Value (US$ Million) Forecast by Type, 2018 to 2033

Table 44: South Asia Market Volume (MT) Forecast by Type, 2018 to 2033

Table 45: South Asia Market Value (US$ Million) Forecast by Technology, 2018 to 2033

Table 46: South Asia Market Volume (MT) Forecast by Technology, 2018 to 2033

Table 47: South Asia Market Value (US$ Million) Forecast by End-user, 2018 to 2033

Table 48: South Asia Market Volume (MT) Forecast by End-user, 2018 to 2033

Table 49: Oceania Market Value (US$ Million) Forecast by Country, 2018 to 2033

Table 50: Oceania Market Volume (MT) Forecast by Country, 2018 to 2033

Table 51: Oceania Market Value (US$ Million) Forecast by Type, 2018 to 2033

Table 52: Oceania Market Volume (MT) Forecast by Type, 2018 to 2033

Table 53: Oceania Market Value (US$ Million) Forecast by Technology, 2018 to 2033

Table 54: Oceania Market Volume (MT) Forecast by Technology, 2018 to 2033

Table 55: Oceania Market Value (US$ Million) Forecast by End-user, 2018 to 2033

Table 56: Oceania Market Volume (MT) Forecast by End-user, 2018 to 2033

Table 57: MEA Market Value (US$ Million) Forecast by Country, 2018 to 2033

Table 58: MEA Market Volume (MT) Forecast by Country, 2018 to 2033

Table 59: MEA Market Value (US$ Million) Forecast by Type, 2018 to 2033

Table 60: MEA Market Volume (MT) Forecast by Type, 2018 to 2033

Table 61: MEA Market Value (US$ Million) Forecast by Technology, 2018 to 2033

Table 62: MEA Market Volume (MT) Forecast by Technology, 2018 to 2033

Table 63: MEA Market Value (US$ Million) Forecast by End-user, 2018 to 2033

Table 64: MEA Market Volume (MT) Forecast by End-user, 2018 to 2033
Nandini Roy Choudhury

Principal Consultant

Talk to Analyst

Find your sweet spots for generating winning opportunities in this market.

List of Charts

Figure 1: Global Value (US$ Million) by Source, 2022 to 2032

Figure 2: Global Value (US$ Million) by Technology, 2022 to 2032

Figure 3: Global Value (US$ Million) by End User, 2022 to 2032

Figure 4: Global Value (US$ Million) by Region, 2022 to 2032

Figure 5: Global Value (US$ Million) Analysis by Region, 2017 to 2032

Figure 6: Global Volume (No.) Analysis by Region, 2017 to 2032

Figure 7: Global Value Share (%) and BPS Analysis by Region, 2022 to 2032

Figure 8: Global Y-o-Y Growth (%) Projections by Region, 2022 to 2032

Figure 9: Global Value (US$ Million) Analysis by Source, 2017 to 2032

Figure 10: Global Volume (No.) Analysis by Source, 2017 to 2032

Figure 11: Global Value Share (%) and BPS Analysis by Source, 2022 to 2032

Figure 12: Global Y-o-Y Growth (%) Projections by Source, 2022 to 2032

Figure 13: Global Value (US$ Million) Analysis by Technology, 2017 to 2032

Figure 14: Global Volume (No.) Analysis by Technology, 2017 to 2032

Figure 15: Global Value Share (%) and BPS Analysis by Technology, 2022 to 2032

Figure 16: Global Y-o-Y Growth (%) Projections by Technology, 2022 to 2032

Figure 17: Global Value (US$ Million) Analysis by End User, 2017 to 2032

Figure 18: Global Volume (No.) Analysis by End User, 2017 to 2032

Figure 19: Global Value Share (%) and BPS Analysis by End User, 2022 to 2032

Figure 20: Global Y-o-Y Growth (%) Projections by End User, 2022 to 2032

Figure 21: Global Attractiveness by Source, 2022 to 2032

Figure 22: Global Attractiveness by Technology, 2022 to 2032

Figure 23: Global Attractiveness by End User, 2022 to 2032

Figure 24: Global Attractiveness by Region, 2022 to 2032

Figure 25: North America Value (US$ Million) by Source, 2022 to 2032

Figure 26: North America Value (US$ Million) by Technology, 2022 to 2032

Figure 27: North America Value (US$ Million) by End User, 2022 to 2032

Figure 28: North America Value (US$ Million) by Country, 2022 to 2032

Figure 29: North America Value (US$ Million) Analysis by Country, 2017 to 2032

Figure 30: North America Volume (No.) Analysis by Country, 2017 to 2032

Figure 31: North America Value Share (%) and BPS Analysis by Country, 2022 to 2032

Figure 32: North America Y-o-Y Growth (%) Projections by Country, 2022 to 2032

Figure 33: North America Value (US$ Million) Analysis by Source, 2017 to 2032

Figure 34: North America Volume (No.) Analysis by Source, 2017 to 2032

Figure 35: North America Value Share (%) and BPS Analysis by Source, 2022 to 2032

Figure 36: North America Y-o-Y Growth (%) Projections by Source, 2022 to 2032

Figure 37: North America Value (US$ Million) Analysis by Technology, 2017 to 2032

Figure 38: North America Volume (No.) Analysis by Technology, 2017 to 2032

Figure 39: North America Value Share (%) and BPS Analysis by Technology, 2022 to 2032

Figure 40: North America Y-o-Y Growth (%) Projections by Technology, 2022 to 2032

Figure 41: North America Value (US$ Million) Analysis by End User, 2017 to 2032

Figure 42: North America Volume (No.) Analysis by End User, 2017 to 2032

Figure 43: North America Value Share (%) and BPS Analysis by End User, 2022 to 2032

Figure 44: North America Y-o-Y Growth (%) Projections by End User, 2022 to 2032

Figure 45: North America Attractiveness by Source, 2022 to 2032

Figure 46: North America Attractiveness by Technology, 2022 to 2032

Figure 47: North America Attractiveness by End User, 2022 to 2032

Figure 48: North America Attractiveness by Country, 2022 to 2032

Figure 49: Latin America Value (US$ Million) by Source, 2022 to 2032

Figure 50: Latin America Value (US$ Million) by Technology, 2022 to 2032

Figure 51: Latin America Value (US$ Million) by End User, 2022 to 2032

Figure 52: Latin America Value (US$ Million) by Country, 2022 to 2032

Figure 53: Latin America Value (US$ Million) Analysis by Country, 2017 to 2032

Figure 54: Latin America Volume (No.) Analysis by Country, 2017 to 2032

Figure 55: Latin America Value Share (%) and BPS Analysis by Country, 2022 to 2032

Figure 56: Latin America Y-o-Y Growth (%) Projections by Country, 2022 to 2032

Figure 57: Latin America Value (US$ Million) Analysis by Source, 2017 to 2032

Figure 58: Latin America Volume (No.) Analysis by Source, 2017 to 2032

Figure 59: Latin America Value Share (%) and BPS Analysis by Source, 2022 to 2032

Figure 60: Latin America Y-o-Y Growth (%) Projections by Source, 2022 to 2032

Figure 61: Latin America Value (US$ Million) Analysis by Technology, 2017 to 2032

Figure 62: Latin America Volume (No.) Analysis by Technology, 2017 to 2032

Figure 63: Latin America Value Share (%) and BPS Analysis by Technology, 2022 to 2032

Figure 64: Latin America Y-o-Y Growth (%) Projections by Technology, 2022 to 2032

Figure 65: Latin America Value (US$ Million) Analysis by End User, 2017 to 2032

Figure 66: Latin America Volume (No.) Analysis by End User, 2017 to 2032

Figure 67: Latin America Value Share (%) and BPS Analysis by End User, 2022 to 2032

Figure 68: Latin America Y-o-Y Growth (%) Projections by End User, 2022 to 2032

Figure 69: Latin America Attractiveness by Source, 2022 to 2032

Figure 70: Latin America Attractiveness by Technology, 2022 to 2032

Figure 71: Latin America Attractiveness by End User, 2022 to 2032

Figure 72: Latin America Attractiveness by Country, 2022 to 2032

Figure 73: Europe Value (US$ Million) by Source, 2022 to 2032

Figure 74: Europe Value (US$ Million) by Technology, 2022 to 2032

Figure 75: Europe Value (US$ Million) by End User, 2022 to 2032

Figure 76: Europe Value (US$ Million) by Country, 2022 to 2032

Figure 77: Europe Value (US$ Million) Analysis by Country, 2017 to 2032

Figure 78: Europe Volume (No.) Analysis by Country, 2017 to 2032

Figure 79: Europe Value Share (%) and BPS Analysis by Country, 2022 to 2032

Figure 80: Europe Y-o-Y Growth (%) Projections by Country, 2022 to 2032

Figure 81: Europe Value (US$ Million) Analysis by Source, 2017 to 2032

Figure 82: Europe Volume (No.) Analysis by Source, 2017 to 2032

Figure 83: Europe Value Share (%) and BPS Analysis by Source, 2022 to 2032

Figure 84: Europe Y-o-Y Growth (%) Projections by Source, 2022 to 2032

Figure 85: Europe Value (US$ Million) Analysis by Technology, 2017 to 2032

Figure 86: Europe Volume (No.) Analysis by Technology, 2017 to 2032

Figure 87: Europe Value Share (%) and BPS Analysis by Technology, 2022 to 2032

Figure 88: Europe Y-o-Y Growth (%) Projections by Technology, 2022 to 2032

Figure 89: Europe Value (US$ Million) Analysis by End User, 2017 to 2032

Figure 90: Europe Volume (No.) Analysis by End User, 2017 to 2032

Figure 91: Europe Value Share (%) and BPS Analysis by End User, 2022 to 2032

Figure 92: Europe Y-o-Y Growth (%) Projections by End User, 2022 to 2032

Figure 93: Europe Attractiveness by Source, 2022 to 2032

Figure 94: Europe Attractiveness by Technology, 2022 to 2032

Figure 95: Europe Attractiveness by End User, 2022 to 2032

Figure 96: Europe Attractiveness by Country, 2022 to 2032

Figure 97: East Asia Value (US$ Million) by Source, 2022 to 2032

Figure 98: East Asia Value (US$ Million) by Technology, 2022 to 2032

Figure 99: East Asia Value (US$ Million) by End User, 2022 to 2032

Figure 100: East Asia Value (US$ Million) by Country, 2022 to 2032

Figure 101: East Asia Value (US$ Million) Analysis by Country, 2017 to 2032

Figure 102: East Asia Volume (No.) Analysis by Country, 2017 to 2032

Figure 103: East Asia Value Share (%) and BPS Analysis by Country, 2022 to 2032

Figure 104: East Asia Y-o-Y Growth (%) Projections by Country, 2022 to 2032

Figure 105: East Asia Value (US$ Million) Analysis by Source, 2017 to 2032

Figure 106: East Asia Volume (No.) Analysis by Source, 2017 to 2032

Figure 107: East Asia Value Share (%) and BPS Analysis by Source, 2022 to 2032

Figure 108: East Asia Y-o-Y Growth (%) Projections by Source, 2022 to 2032

Figure 109: East Asia Value (US$ Million) Analysis by Technology, 2017 to 2032

Figure 110: East Asia Volume (No.) Analysis by Technology, 2017 to 2032

Figure 111: East Asia Value Share (%) and BPS Analysis by Technology, 2022 to 2032

Figure 112: East Asia Y-o-Y Growth (%) Projections by Technology, 2022 to 2032

Figure 113: East Asia Value (US$ Million) Analysis by End User, 2017 to 2032

Figure 114: East Asia Volume (No.) Analysis by End User, 2017 to 2032

Figure 115: East Asia Value Share (%) and BPS Analysis by End User, 2022 to 2032

Figure 116: East Asia Y-o-Y Growth (%) Projections by End User, 2022 to 2032

Figure 117: East Asia Attractiveness by Source, 2022 to 2032

Figure 118: East Asia Attractiveness by Technology, 2022 to 2032

Figure 119: East Asia Attractiveness by End User, 2022 to 2032

Figure 120: East Asia Attractiveness by Country, 2022 to 2032

Figure 121: South Asia Value (US$ Million) by Source, 2022 to 2032

Figure 122: South Asia Value (US$ Million) by Technology, 2022 to 2032

Figure 123: South Asia Value (US$ Million) by End User, 2022 to 2032

Figure 124: South Asia Value (US$ Million) by Country, 2022 to 2032

Figure 125: South Asia Value (US$ Million) Analysis by Country, 2017 to 2032

Figure 126: South Asia Volume (No.) Analysis by Country, 2017 to 2032

Figure 127: South Asia Value Share (%) and BPS Analysis by Country, 2022 to 2032

Figure 128: South Asia Y-o-Y Growth (%) Projections by Country, 2022 to 2032

Figure 129: South Asia Value (US$ Million) Analysis by Source, 2017 to 2032

Figure 130: South Asia Volume (No.) Analysis by Source, 2017 to 2032

Figure 131: South Asia Value Share (%) and BPS Analysis by Source, 2022 to 2032

Figure 132: South Asia Y-o-Y Growth (%) Projections by Source, 2022 to 2032

Figure 133: South Asia Value (US$ Million) Analysis by Technology, 2017 to 2032

Figure 134: South Asia Volume (No.) Analysis by Technology, 2017 to 2032

Figure 135: South Asia Value Share (%) and BPS Analysis by Technology, 2022 to 2032

Figure 136: South Asia Y-o-Y Growth (%) Projections by Technology, 2022 to 2032

Figure 137: South Asia Value (US$ Million) Analysis by End User, 2017 to 2032

Figure 138: South Asia Volume (No.) Analysis by End User, 2017 to 2032

Figure 139: South Asia Value Share (%) and BPS Analysis by End User, 2022 to 2032

Figure 140: South Asia Y-o-Y Growth (%) Projections by End User, 2022 to 2032

Figure 141: South Asia Attractiveness by Source, 2022 to 2032

Figure 142: South Asia Attractiveness by Technology, 2022 to 2032

Figure 143: South Asia Attractiveness by End User, 2022 to 2032

Figure 144: South Asia Attractiveness by Country, 2022 to 2032

Figure 145: Oceania Value (US$ Million) by Source, 2022 to 2032

Figure 146: Oceania Value (US$ Million) by Technology, 2022 to 2032

Figure 147: Oceania Value (US$ Million) by End User, 2022 to 2032

Figure 148: Oceania Value (US$ Million) by Country, 2022 to 2032

Figure 149: Oceania Value (US$ Million) Analysis by Country, 2017 to 2032

Figure 150: Oceania Volume (No.) Analysis by Country, 2017 to 2032

Figure 151: Oceania Value Share (%) and BPS Analysis by Country, 2022 to 2032

Figure 152: Oceania Y-o-Y Growth (%) Projections by Country, 2022 to 2032

Figure 153: Oceania Value (US$ Million) Analysis by Source, 2017 to 2032

Figure 154: Oceania Volume (No.) Analysis by Source, 2017 to 2032

Figure 155: Oceania Value Share (%) and BPS Analysis by Source, 2022 to 2032

Figure 156: Oceania Y-o-Y Growth (%) Projections by Source, 2022 to 2032

Figure 157: Oceania Value (US$ Million) Analysis by Technology, 2017 to 2032

Figure 158: Oceania Volume (No.) Analysis by Technology, 2017 to 2032

Figure 159: Oceania Value Share (%) and BPS Analysis by Technology, 2022 to 2032

Figure 160: Oceania Y-o-Y Growth (%) Projections by Technology, 2022 to 2032

Figure 161: Oceania Value (US$ Million) Analysis by End User, 2017 to 2032

Figure 162: Oceania Volume (No.) Analysis by End User, 2017 to 2032

Figure 163: Oceania Value Share (%) and BPS Analysis by End User, 2022 to 2032

Figure 164: Oceania Y-o-Y Growth (%) Projections by End User, 2022 to 2032

Figure 165: Oceania Attractiveness by Source, 2022 to 2032

Figure 166: Oceania Attractiveness by Technology, 2022 to 2032

Figure 167: Oceania Attractiveness by End User, 2022 to 2032

Figure 168: Oceania Attractiveness by Country, 2022 to 2032

Figure 169: MEA Value (US$ Million) by Source, 2022 to 2032

Figure 170: MEA Value (US$ Million) by Technology, 2022 to 2032

Figure 171: MEA Value (US$ Million) by End User, 2022 to 2032

Figure 172: MEA Value (US$ Million) by Country, 2022 to 2032

Figure 173: MEA Value (US$ Million) Analysis by Country, 2017 to 2032

Figure 174: MEA Volume (No.) Analysis by Country, 2017 to 2032

Figure 175: MEA Value Share (%) and BPS Analysis by Country, 2022 to 2032

Figure 176: MEA Y-o-Y Growth (%) Projections by Country, 2022 to 2032

Figure 177: MEA Value (US$ Million) Analysis by Source, 2017 to 2032

Figure 178: MEA Volume (No.) Analysis by Source, 2017 to 2032

Figure 179: MEA Value Share (%) and BPS Analysis by Source, 2022 to 2032

Figure 180: MEA Y-o-Y Growth (%) Projections by Source, 2022 to 2032

Figure 181: MEA Value (US$ Million) Analysis by Technology, 2017 to 2032

Figure 182: MEA Volume (No.) Analysis by Technology, 2017 to 2032

Figure 183: MEA Value Share (%) and BPS Analysis by Technology, 2022 to 2032

Figure 184: MEA Y-o-Y Growth (%) Projections by Technology, 2022 to 2032

Figure 185: MEA Value (US$ Million) Analysis by End User, 2017 to 2032

Figure 186: MEA Volume (No.) Analysis by End User, 2017 to 2032

Figure 187: MEA Value Share (%) and BPS Analysis by End User, 2022 to 2032

Figure 188: MEA Y-o-Y Growth (%) Projections by End User, 2022 to 2032

Figure 189: MEA Attractiveness by Source, 2022 to 2032

Figure 190: MEA Attractiveness by Technology, 2022 to 2032

Figure 191: MEA Attractiveness by End User, 2022 to 2032

Figure 192: MEA Attractiveness by Country, 2022 to 2032

Explore Process Automation Insights

View Reports

Food Irradiation Equipment Market