The Food Blue 5 Market is estimated to be valued at USD 11.4 billion in 2025 and is projected to reach USD 15.2 billion by 2035, registering a compound annual growth rate (CAGR) of 2.9% over the forecast period.
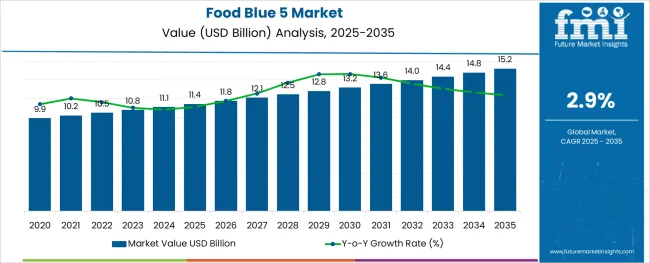
The Food Blue 5 market is witnessing steady growth, driven by rising demand for visually appealing food and beverage products, coupled with advancements in synthetic food coloring formulations. With manufacturers prioritizing color consistency, heat stability, and water solubility, Food Blue 5 has become a preferred additive across regulated geographies.
Increasing consumer preference for vibrant product presentation, especially in beverages, candies, and processed foods, has created favorable market conditions for high-performance artificial colorants. Industry adoption is further supported by regulatory bodies in major markets, where Food Blue 5 has been approved under defined usage limits. Manufacturers are investing in refining formulation standards to enhance dispersion, reduce fading, and align with clean label expectations.
In addition, cost advantages over natural pigments and compatibility with automated processing systems are influencing procurement strategies. As innovation continues in encapsulated and micro-dosed coloring systems, the Food Blue 5 market is expected to maintain relevance in mass-market and convenience product categories globally.
The market is segmented by Form and Application and region. By Form, the market is divided into Dyes and Lakes. In terms of Application, the market is classified into Beverage, Bakery, Snacks, and Cereals, Candy/ Confectionery, Dairy, Fruit Preparations/ Fillings, Meat, Poultry, Fish, and Eggs, Potatoes, Pasta, and Rice, Sauces, Soups, and Dressings, Seasonings, Pet Food, and Others. Regionally, the market is classified into North America, Latin America, Western Europe, Eastern Europe, Balkan & Baltic Countries, Russia & Belarus, Central Asia, East Asia, South Asia & Pacific, and the Middle East & Africa.
The market is segmented by Form and Application and region. By Form, the market is divided into Dyes and Lakes. In terms of Application, the market is classified into Beverage, Bakery, Snacks, and Cereals, Candy/ Confectionery, Dairy, Fruit Preparations/ Fillings, Meat, Poultry, Fish, and Eggs, Potatoes, Pasta, and Rice, Sauces, Soups, and Dressings, Seasonings, Pet Food, and Others. Regionally, the market is classified into North America, Latin America, Western Europe, Eastern Europe, Balkan & Baltic Countries, Russia & Belarus, Central Asia, East Asia, South Asia & Pacific, and the Middle East & Africa.
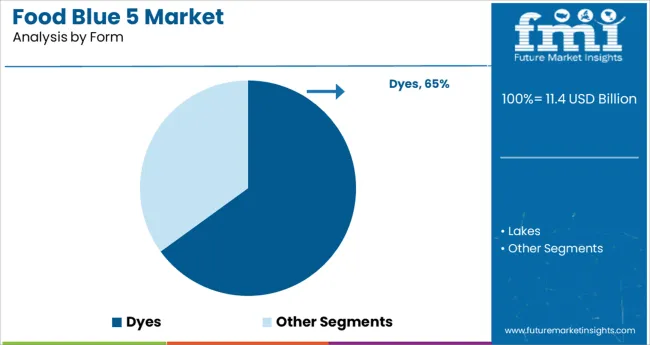
The dyes subsegment is projected to hold 65.0% of the total revenue within the form category in 2025, positioning it as the dominant type. This leadership is attributed to the superior solubility, ease of incorporation, and economic efficiency that dyes provide during large-scale food and beverage manufacturing.
Food Blue 5 in dye form is preferred for its uniform distribution in aqueous environments, which makes it particularly suitable for liquid-based applications and high-throughput production lines. The ability of dyes to offer vivid and stable coloration with minimal dosage enhances shelf appeal while minimizing formulation costs.
Additionally, regulatory frameworks in multiple regions have continued to support the use of synthetic dyes under specified conditions, reinforcing their adoption. Manufacturers have optimized production processes to ensure batch consistency, lightfastness, and compatibility with automated dosing equipment, further strengthening the dominance of dyes in the Food Blue 5 market.
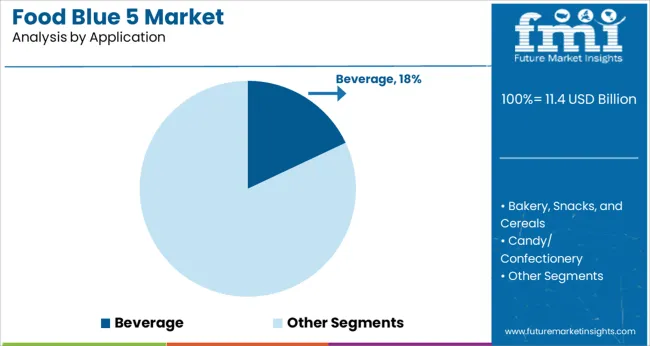
The beverage application segment is anticipated to account for 18.0% of the total revenue in 2025, emerging as a key application area for Food Blue 5. This share is supported by the high visual standards expected in soft drinks, sports beverages, and energy drinks where vibrant color is a core consumer attraction factor.
The compatibility of Food Blue 5 with water-based formulations allows it to deliver consistent and intense coloration without affecting taste or pH levels. Beverage manufacturers have increasingly favored synthetic colorants like Food Blue 5 for their cost effectiveness, regulatory compliance, and performance across temperature and light exposures.
Innovation in flavored waters and ready-to-drink functional beverages has further expanded its usage scope. As marketing strategies continue to emphasize sensory appeal and product differentiation through appearance, the demand for high-quality colorants in the beverage industry is expected to maintain upward momentum, securing the application’s leading role in market expansion.
Food Blue 5 is a sky blue synthetic triphenylmethane dye that is used as a food and beverage colorant. As a food additive, it has E number E131. Patent Blue V is a sodium or calcium salt. Future Market Insights estimates that the food blue 5 markets will account for nearly USD 15.2 Billion of sales in the global food color market in 2035.
The food color market registered revenue, in terms of volume, of around 185,000 metric tons in 2024, with sales of food blue 5 dyes reaching 1500 metric tons in 2024.
The market study suggests that the demand for food blue 5 colorants are expected to be at approximately 1900 metric tons by 2035. The rising need for natural food ingredients as people are becoming more conscious of food ingredients is propelling the demand for natural blue food colors over the forecast period.
The food Blue 5 markets are highly driven by the growing demand for innovative, unique-looking food dishes, and altering taste and food appeal preferences.
Patent Blue V's color in an aqueous solution varies from a deep blue in an alkaline or moderate acidic media to a yellowish-orange in a stronger acidic medium. The colorants are used in medicine and are also used as a stain to reveal dental plaque. Hence, the rising application of food blue 5 in the pharmaceutical and food & beverage industries is propelling the demand in the market.
The European Union has approved food blue 5 as a valid food color. In Europe, it is available in certain blue Curaç ao, jelly sweets, certain gelatin desserts, and scotch eggs, among others. On the back of this, the food blue 5 sales are expected to surge in the UK and Germany due to its affordability and accessibility.
Patent Blue V has been banned in certain countries such as the USA and Australia as a food additive due to allergic reactions. These tight regulations around synthetic food colorants and reluctance are expected to hamper the demand in the market.
Being a dye produced by full chemical synthesis, they lack nutritional content, thus consumption of natural food colors by big food processing industries might impact the sales of synthetic food colors. This is the key factor impeding the growth in the food blue 5 markets.
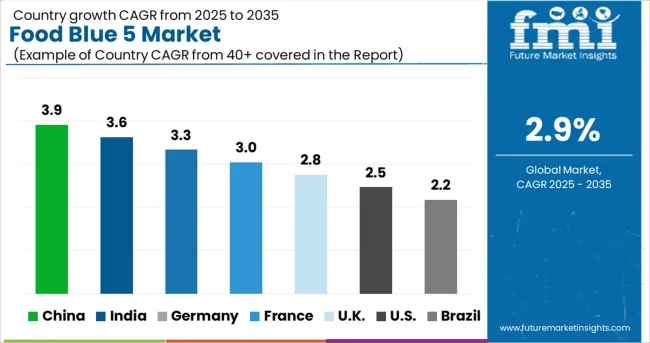
India Food Blue 5 Market to Gain Impetus Amid Rising Application in Beverage Sector
As per Future Market Insights (FMI), India is considered to have one of the largest beverage industries. Sales of food blue 5 in India across the beverage industry are expected to reach USD 5.3 Million. This is primarily due to the increasing consumption of ready-to-drink carbonated beverages in the country.
According to the study, the Asia Pacific food blue 5 markets totaled USD 11.1 Million in 11.1011.11 which is nearly 11.10% of the global market. However, China is one of the largest markets for synthetic food colorants.
Numerous food coloring manufacturers have strong manufacturing facilities and distribution networks in China, Japan, and South-East Asia. Hence, the demand for patent blue V is expected to grow at a steady pace in the Asia Pacific.
Demand for Food Blue 5 in Germany to Surge at a Robust Pace Through 11.10311.1
Europe's food blue 5 markets are expected to reach a valuation of USD 4 Million in 11.1011.11, according to FMI. Expansion of food processing industries in France and Germany is expected to create remunerative prospects for food blue 5 market players. Germany and France are estimated to be the leading markets for food blue 5, with sales in Germany accounting for USD 1.1 Million in 11.1011.11.
Over 1/4th of Food Blue 5 Sales to Remain Concentrated in Beverage Segment
In terms of application, beverages account for the largest share in the food blue 5 markets. The beverage segment is expected to account for over 25% of food blue 5’s market share. Besides this, the demand for the bakery, snacks, and cereals segment is expected to accelerate with a CAGR of 2.9% over the assessment period.
The dairy and meat, poultry, and eggs segment is also one of the leading applications of food blue 5 food colorants. As per the study, these segments are expected to collectively account for 22% of the demand share in the global food blue 5 markets.
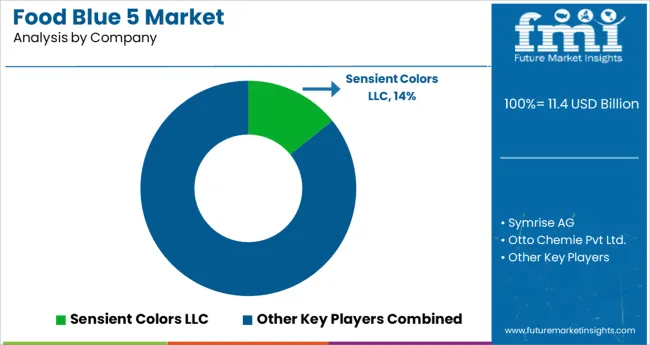
Patent Blue V manufacturers are adopting strategies such as penetrating into emerging economies, funding research for safety checks, and establishing trade agreements with regional food processing industries.
Food Blue V manufacturing corporations have been re-modeling the product to attract end-user industries and consumers. Moreover, leading manufacturers are investing in research and development and acquiring regional innovative units.
| Attribute | Details |
|---|---|
| Market Expected Size (2025E) | USD 10.5 Million |
| Market Projected Size (2035F) | USD 14.7 Million |
| Value CAGR (2025-2035) | 2.9% |
| Forecast Period | 2025 to 2035 |
| Historical Data Available for | 2020 to 2024 |
| Market Analysis | million for Value and MT for Volume |
| Key Regions Covered | North America; Latin America; Europe; Middle East and Africa; and India; Asia Pacific |
| Key Countries Covered | USA, Canada, Mexico, Brazil, Peru, Argentina, UK, China, India, Japan, Germany, Italy, France, South Africa, South Korea, Australia, and GCC Countries |
| Key Segments Covered | Type, Application, and Region |
| Key Companies Profiled | Sensient Colors LLC.; Symrise AG; Chr. Hansen Holding A/S; DIC Corporation (BASF SE); Archer Daniels Midland Company; BioconColors; DSM; DDW; San-Ei Gen F.F.I., Inc.; Others |
| Report Coverage | Market Forecast, Drivers, Restraints, Opportunities and Threats Analysis, Company Share Analysis, Competition Intelligence, Market Dynamics and Challenges, and Strategic Growth Initiatives |
The global food blue 5 market is estimated to be valued at USD 11.4 billion in 2025.
It is projected to reach USD 15.2 billion by 2035.
The market is expected to grow at a 2.9% CAGR between 2025 and 2035.
The key product types are dyes and lakes.
beverage segment is expected to dominate with a 18.0% industry share in 2025.


Our Research Products

The "Full Research Suite" delivers actionable market intel, deep dives on markets or technologies, so clients act faster, cut risk, and unlock growth.

The Leaderboard benchmarks and ranks top vendors, classifying them as Established Leaders, Leading Challengers, or Disruptors & Challengers.

Locates where complements amplify value and substitutes erode it, forecasting net impact by horizon

We deliver granular, decision-grade intel: market sizing, 5-year forecasts, pricing, adoption, usage, revenue, and operational KPIs—plus competitor tracking, regulation, and value chains—across 60 countries broadly.

Spot the shifts before they hit your P&L. We track inflection points, adoption curves, pricing moves, and ecosystem plays to show where demand is heading, why it is changing, and what to do next across high-growth markets and disruptive tech

Real-time reads of user behavior. We track shifting priorities, perceptions of today’s and next-gen services, and provider experience, then pace how fast tech moves from trial to adoption, blending buyer, consumer, and channel inputs with social signals (#WhySwitch, #UX).

Partner with our analyst team to build a custom report designed around your business priorities. From analysing market trends to assessing competitors or crafting bespoke datasets, we tailor insights to your needs.
Supplier Intelligence
Discovery & Profiling
Capacity & Footprint
Performance & Risk
Compliance & Governance
Commercial Readiness
Who Supplies Whom
Scorecards & Shortlists
Playbooks & Docs
Category Intelligence
Definition & Scope
Demand & Use Cases
Cost Drivers
Market Structure
Supply Chain Map
Trade & Policy
Operating Norms
Deliverables
Buyer Intelligence
Account Basics
Spend & Scope
Procurement Model
Vendor Requirements
Terms & Policies
Entry Strategy
Pain Points & Triggers
Outputs
Pricing Analysis
Benchmarks
Trends
Should-Cost
Indexation
Landed Cost
Commercial Terms
Deliverables
Brand Analysis
Positioning & Value Prop
Share & Presence
Customer Evidence
Go-to-Market
Digital & Reputation
Compliance & Trust
KPIs & Gaps
Outputs
Full Research Suite comprises of:
Market outlook & trends analysis
Interviews & case studies
Strategic recommendations
Vendor profiles & capabilities analysis
5-year forecasts
8 regions and 60+ country-level data splits
Market segment data splits
12 months of continuous data updates
DELIVERED AS:
PDF EXCEL ONLINE
5G Electromechanical RF Switch Market Size and Share Forecast Outlook 2025 to 2035
Food & Beverage OEE Software Market Size and Share Forecast Outlook 2025 to 2035
5G Solid State Switches Market Size and Share Forecast Outlook 2025 to 2035
5G Gain Block Amplifier Market Size and Share Forecast Outlook 2025 to 2035
5G Driver Amplifier Market Size and Share Forecast Outlook 2025 to 2035
Food Grade Crosslinked Polyvinylpolypyrrolidone (PVPP) Market Size and Share Forecast Outlook 2025 to 2035
Food Grade Cassia Gum Powder Market Size and Share Forecast Outlook 2025 to 2035
Food Grade Dry Film Lubricant Market Size and Share Forecast Outlook 2025 to 2035
Blue Light Protection Ingredient Market Size and Share Forecast Outlook 2025 to 2035
Foodservice Equipment Market Analysis - Size, Share, and Forecast Outlook 2025 to 2035
Food Basket Market Forecast and Outlook 2025 to 2035
5G Millimeter Wave RF Transceiver Market Size and Share Forecast Outlook 2025 to 2035
Food Grade Tremella Polysaccharide Market Size and Share Forecast Outlook 2025 to 2035
Food Sorting Machine Market Size and Share Forecast Outlook 2025 to 2035
Foodservice Paper Bag Market Size and Share Forecast Outlook 2025 to 2035
Food Stabilizers Market Size and Share Forecast Outlook 2025 to 2035
Food Packaging Film Market Size and Share Forecast Outlook 2025 to 2035
Food Certification Market Size and Share Forecast Outlook 2025 to 2035
Food Tray Market Size and Share Forecast Outlook 2025 to 2035
Food & Beverage Industrial Disinfection and Cleaning Market Size and Share Forecast Outlook 2025 to 2035

Thank you!
You will receive an email from our Business Development Manager. Please be sure to check your SPAM/JUNK folder too.
Chat With
MaRIA