Food Colors Market
Market Insights on Food Colors covering sales outlook, demand forecast & up-to-date key trends
Food Colors Market By Color Palette, Form, Solubility, Application & Region - Forecast 2022 - 2032
Food Color Market Outlook (2022-2032)
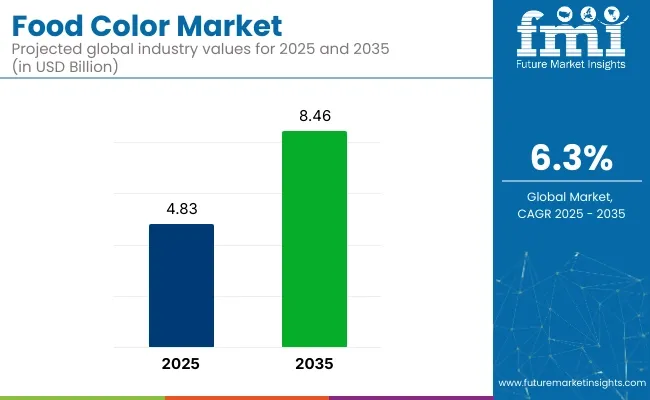
[250 Pages Report] The global food colors market is expected to reach a market valuation of US$ 2.6 Bn by the year 2022, accelerating with a CAGR of 7.3% by 2022-2032. Bakery, Cereal, and Snacks accounted for 18% of sales by volume in the food colors market in 2021.
Food Colors Market Size (2022E) |
USD 2.6 Bn |
Food Colors Projected Size (2032F) |
USD 5.3 Bn |
Value CAGR (2022-2032) |
7.3% |
Top Region Market Share (North America) |
35.8% |
FMI analysis indicates that food colors will account for nearly USD 5.3 Bn of sales in the global market in 2032. The food colors market exhibited a sale by volume of about 185,000 metric tons in 2021 and is expected to have a consumption of 340,000 metric tons by 2030.
Market research suggests that the demand in the natural food colorants sector is expected to grow at 8.1% during the forecast period. The need for natural food ingredients along with traceability of their origin and extraction process has become an important factor due to COVID-19, making people more conscious of food ingredients, propelling the demand for natural food colors over synthetic ones.
The global food colors market is driven by the highly growing demand for innovative, unique-looking food dishes, and altering taste and food appeal preferences due to the rise of social media among the populations worldwide. An increase in consumer awareness for clean-label food products and the additional health benefits that certain natural food colors possess is estimated to drive the market for food colors.
Let us know your requirement to get
100% FREE customization
In What Way, The Consumer Demand For Natural Food Products Drive The Growth Of The Global Food Colors Market?
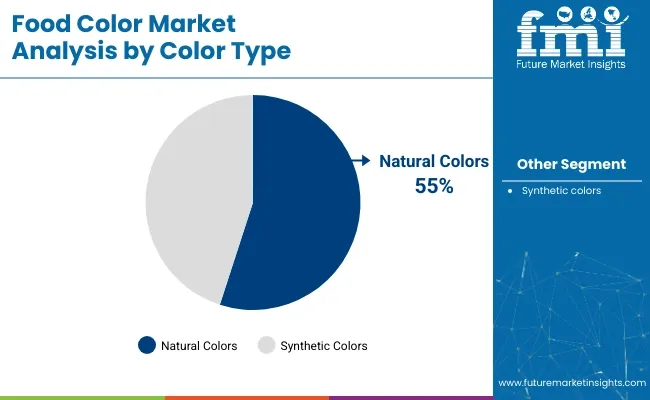
Food manufacturers are increasingly employing natural food colours instead of synthetic food colours to restore the beauty of food and beverage products after processing, owing to the increased demand for natural food products and functional foods. Natural food colors account for over 67% of sales by value but only 26% by volume of the overall food colors market.
The natural food colors are expensive and are still to achieve large scales of production, giving a lot of potential leeway for manufacturers. In organic food, natural food colors are highly applied to make them attractive and to influence the buyers’ purchasing decisions.
What Is The Competition Outlook For The Entire Industry?
Because there is no significant equivalent for the food colours in their whole, there is little risk of product substitution. However, internal substitution is projected in the food colour business, with natural food colours rapidly replacing synthetic food colours. Because of the current high level of volatility in raw material costs, the market is projected to be hazardous.
Find your sweet spots for generating winning opportunities in this market.
Talk to AnalystWhat Is A Key Challenge To The Food Colors Market?
Stringent regulation and misperceptions about synthetic and titanium dioxide food colors among consumers is a key restraint to the market. Both color palettes account for over one-fourth of sales of food colors. Titanium dioxide has been classified as a safe food colourant by the FDA. It is safe to consume food-grade titanium dioxide within the maximum permissible limits.
However, Consumers perceive titanium dioxide as a chemical causing life-threatening diseases, such as cancer, which is untrue and false. Further, information regarding the health hazards of synthetic colors and consumer hesitations has created a significant challenge in the food colors market growth.
Country-Wise Insights
How is the U.S. Food Colors Market Shaping?
The U.S. is one of the largest markets for food colorants. Key food colors manufacturers have a strong commercial presence in North America, peculiarly the U.S. They also have manufacturing facilities and well-established distribution networks in these areas.
The FDA is a main regulating body for food additives in the United States, therefore the food colours. It actively controls the use of artificial colours in food and beverages. Stringent laws passed by FDA restrain the growth of food colors in the U.S.
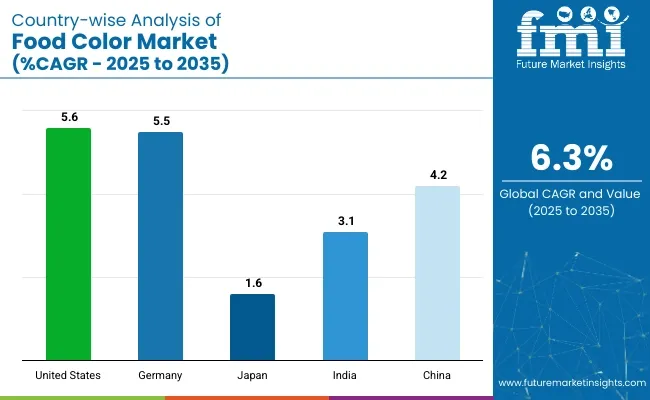
Veganism has witnessed significant growth in the US over the last couple of years. It is further projected to increase, and consumer demand is bound to shift to plant-based ingredients and products propelling sales of Plant-based food colors. As per FMI, the U.S. food colors market totaled US$ 670.5 Mn in 2021 which is approximately 27.8% of the global food colors market.
Why European region accounts for a high market share?
European food colors sales clocked over USD 400 Mn in 2021. Germany is a leading industrial hub in Europe, followed by France. The expansion of food processing industries in Central and Eastern Europe will continue to create impressive prospects for the growth of the food colors in Europe.
The rise in demand for new food colours by food producers, as well as the growth of various food industries such as meat processing, bakery & confectionery, pet food industry, and functional food items, is likely to fuel the food colours market growth in the European area. Germany, France, the UK, Italy, and Spain already have the largest food industries that are estimated to be the leading markets for food colors in the European continent.
Poland, the Nordic countries, Denmark, and the Netherlands, on the other hand, are important markets for raw materials for totally natural food colours. Food colours are expected to expand in popularity in Europe due to a growing awareness of healthy diets and nutrition.

A unified Market Research Subscription Platform, built for today's disparate research needs.
Category-Wise Insights
What is the leading application of food colors?
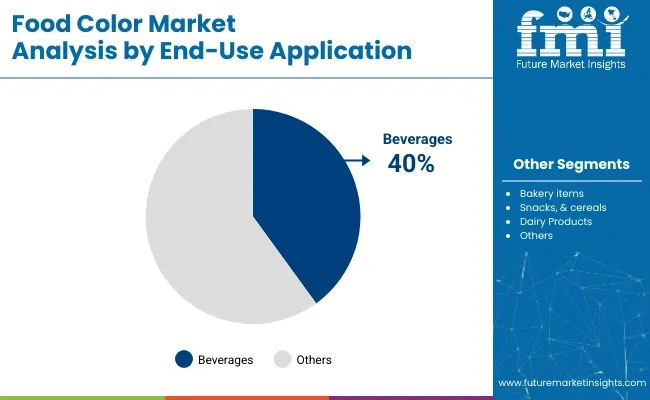
Among all food coloring applications, beverages have been and are expected to account for the largest share in the food colors market. The beverage segment has over 22% of food colors market share. Besides this, the demand for beverages is expected to accelerate with a CAGR of 5.8% through the course of the forecast period.
Will Liquid Remain Top-selling Product Form over Powder and Gel?
Food colors are widely available in the form of liquid and also the most preferred as it becomes highly convenient to use and is highly affordable. Liquid dyes are the most conventional form of food colorants, applied in almost all varieties of foods. They are readily available in a squeeze bottle or a sachet that allows gradual coloring until the desired tone of color is achieved.
Food colors are usually available in liquid form which are applied for foods that require lighter and more pastel colorings for items, such as candies, confectioneries, cake icings, and meat substitutes. Their applications also include batters, tinting icings, mixing drinks, and doughs. They provide color consistency, also helps in reduction of poor pigment dispersion, and are easy to mix.
Competitive Landscape
Food Colors Market players have been reshaping the product to attract end-user industries and consumers. Moreover, manufacturers such as Chr. Hansen Holding A/S is improvising on the products by investing in research and development, launching new ones, and acquiring regional innovative units.
Manufacturers are diversifying towards various applications in pet foods to expand the food colors consumption. Besides this, they are focusing on better distribution channels like e-commerce to gain a competitive edge.
- In August 2021, GNT Group launched coloring foods made from turmeric and spirulina for catering to the cost-effective green, clean-label food ingredients sector.
- In August 2020, Phytolon, an Israeli firm secured funding of USD 4.2 million for its fermentation-based technology to create natural, high-quality food colorings.
Scope Of The Report
Attribute |
Details |
Forecast Period |
2022-2032 |
Historical Data Available for |
2017-2021 |
Market Analysis |
USD Mn for Value and MT for Volume |
Key Regions Covered |
Global, North America, Latin America, Europe, Middle east and Africa, and India, Asia Pacific |
Key Countries Covered |
US, Canada, Mexico, Brazil, Peru, Argentina, U.K., China, India, Japan, Germany, Italy, France, South Africa, South Korea, Australia, and GCC Countries |
Key Segments Covered |
Color Palette, Form, Solubility, Application, and Region |
Key Companies Profiled |
|
Report Coverage |
Market Forecast, DROT Analysis, Company Share Analysis, Competition Intelligence, Market Dynamics and Challenges, and Strategic Growth Initiatives |
Customization & Pricing |
Available upon Request |
Food Colors Market By Category
By Color Palette, Food Colors Market is Segmented as:
- Natural Food Colors
- Synthetic Food Colors
- Caramel Food Colors
- Titanium Dioxide Food Colors
On the basis of form, the food colors market has been segmented as follows:
- Liquid
- Powder
- Gel
On the basis of solubility, the food colors market has been segmented as follows:
- Dyes
- Lakes
By Application, Food Colors Market is Segmented as:
- Beverage
- Bakery, Snacks, and Cereals
- Candy/ Confectionery
- Dairy
- Fruit Preparations/ Fillings
- Meat, Poultry, Fish, and Eggs
- Potatoes, Pasta, and Rice
- Sauces, Soups, and Dressings
- Seasonings
- Pet Food
By Region, Food Colors Market is Segmented as:
- Global
- North America
- Latin America
- Europe, Middle east and Africa, and India
- Asia Pacific
Frequently Asked Questions
The Food Colors market will reach nearly USD 2.6 Bn by 2022.
Bakery, Cereal, and Snacks accounted for 18% of sales by volume in the food colors market in 2021.
The North America food colors market is expected to register 6.2% CAGR between the forecasted period of 2022 and 2032.
In Europe, the Middle East, Africa, and India, the demand for food colors is expected to grow at 5.88% CAGR between 2022 and 2032.
Increasing demand for Food Colors, especially Natural Food Colors from various end-use industries, including food & beverages, bakery & confectionery, dairy products, meat & poultry, and seafood will continue augmenting growth in the market. To gain a competitive edge, the market players are likely to focus on expanding their production facilities into emerging economies.
The Japanese food colors market exhibited sales of 12,461 metric tons by volume and is expected to grow at 6.18% CAGR between 2022 and 2032.
Table of Content
1. Executive Summary
1.1. Global Market Outlook
1.2. Demand-side Trends
1.3. Supply-side Trends
1.4. Technology Roadmap Analysis
1.5. Analysis and Recommendations
2. Market Overview
2.1. Market Coverage / Taxonomy
2.2. Market Definition / Scope / Limitations
3. Market Background
3.1. Market Dynamics
3.1.1. Drivers
3.1.2. Restraints
3.1.3. Opportunity
3.1.4. Trends
3.2. Scenario Forecast
3.2.1. Demand in Optimistic Scenario
3.2.2. Demand in Likely Scenario
3.2.3. Demand in Conservative Scenario
3.3. Product launches & Recent Developments
3.4. Product Life Cycle Analysis
3.5. Value Chain Analysis
3.5.1. Supply Side Participants and their Roles
3.5.1.1. Producers
3.5.1.2. Mid-Level Participants (Traders/ Agents/ Brokers)
3.5.1.3. Wholesalers and Distributors
3.5.2. % of Operating Margin Analysis
3.5.3. List of Raw Material Suppliers
3.5.4. List of Existing and Potential Buyer’s
3.6. Global Food Colors Market- Pricing Analysis
3.6.1. Price Point Assessment by Region
3.6.2. Price Point Assessment by Form
3.6.3. Price Forecast till 2032
3.6.4. Factors affecting Pricing
3.7. Forecast Factors - Relevance & Impact
3.8. PESTLE and Porter’s Analysis
3.9. Regulatory Landscape
3.9.1. Packaging & Labelling Regulations
3.9.2. Certifications and Certifying Agency Overview
3.9.3. Import/Export Policies
3.10. Regional Parent Market Outlook
3.11. Consumers Survey Analysis
3.12. Macro-Economic Factors
3.13. Product Claims & Nutritional Information Scan by Buyers
4. Global Food Colors Market Analysis 2017-2021 and Forecast, 2022-2032
4.1. Historical Market Size Value (US$ Mn) & Volume (MT) Analysis, 2017-2021
4.2. Current and Future Market Size Value (US$ Mn) & Volume (MT) Projections, 2022-2032
4.2.1. Y-o-Y Growth Trend Analysis
4.2.2. Absolute $ Opportunity Analysis
5. Global Food Colors Market Analysis 2017-2021 and Forecast 2022-2032, By Solubility
5.1. Introduction / Key Findings
5.2. Historical Market Size Value (US$ Mn) & Volume (MT) Analysis By Solubility, 2017-2021
5.3. Current and Future Market Size Value (US$ Mn) & Volume (MT) Analysis and Forecast By Solubility, 2022-2032
5.3.1. Dyes
5.3.2. Lakes
5.4. Y-o-Y Growth Trend Analysis By Solubility, 2017-2021
5.5. Absolute $ Opportunity Analysis By Solubility, 2022-2032
6. Global Food Colors Market Analysis 2017-2021 and Forecast 2022-2032, By Application
6.1. Introduction / Key Findings
6.2. Historical Market Size Value (US$ Mn) & Volume (MT) Analysis By Application, 2017-2021
6.3. Current and Future Market Size Value (US$ Mn) & Volume (MT) Analysis and Forecast By Application, 2022-2032
6.3.1. Beverages
6.3.2. Bakery, Snacks, and Cereals
6.3.3. Candy/Confectionary
6.3.4. Dairy
6.3.5. Fruit Preparations/ Fillings
6.3.6. Meat, Poultry, Fish, and Eggs
6.3.7. Potatoes, Pasta, and Rice
6.3.8. Sauces, Soups, and Dressings
6.3.9. Seasonings
6.3.10. Pet Food
6.3.11. Others
6.4. Y-o-Y Growth Trend Analysis By Application, 2017-2021
6.5. Absolute $ Opportunity Analysis By Application, 2022-2032
7. Global Food Colors Market Analysis 2017-2021 and Forecast 2022-2032, By Color Pallete
7.1. Introduction / Key Findings
7.2. Historical Market Size Value (US$ Mn) & Volume (MT) Analysis By Color Pallete, 2017-2021
7.3. Current and Future Market Size Value (US$ Mn) & Volume (MT) Analysis and Forecast By Color Pallete, 2022-2032
7.3.1. Natural Food Colors
7.3.2. Synthetic Food Colors
7.3.3. Caramel Food Colors
7.3.4. Titanium Dioxide Food Colors
7.4. Y-o-Y Growth Trend Analysis By Color Pallete, 2017-2021
7.5. Absolute $ Opportunity Analysis By Color Pallete, 2022-2032
8. Global Food Colors Market Analysis 2017-2021 and Forecast 2022-2032, By Form
8.1. Introduction / Key Findings
8.2. Historical Market Size Value (US$ Mn) & Volume (MT) Analysis By Form, 2017-2021
8.3. Current and Future Market Size Value (US$ Mn) & Volume (MT) Analysis and Forecast By Form, 2022-2032
8.3.1. Liquid
8.3.2. Powder
8.3.3. Gel
8.4. Y-o-Y Growth Trend Analysis By Form, 2017-2021
8.5. Absolute $ Opportunity Analysis By Form, 2022-2032
9. Global Food Colors Market Analysis 2017-2021 and Forecast 2022-2032, By Region
9.1. Introduction
9.2. Historical Market Size Value (US$ Mn) & Volume (MT) Analysis By Region, 2017-2021
9.3. Current Market Size Value (US$ Mn) & Volume (MT) Analysis and Forecast By Region, 2022-2032
9.3.1. North America
9.3.2. Latin America
9.3.3. Europe
9.3.4. East Asia
9.3.5. South Asia
9.3.6. Oceania
9.3.7. MEA
9.4. Market Attractiveness Analysis By Region
10. North America Food Colors Market Analysis 2017-2021 and Forecast 2022-2032, By Country
10.1. Historical Market Size Value (US$ Mn) & Volume (MT) Trend Analysis By Market Taxonomy, 2017-2021
10.2. Market Size Value (US$ Mn) & Volume (MT) Forecast By Market Taxonomy, 2022-2032
10.2.1. By Country
10.2.1.1. U.S.
10.2.1.2. Canada
10.2.2. By Solubility
10.2.3. By Application
10.2.4. By Color Pallete
10.2.5. By Form
10.3. Market Attractiveness Analysis
10.3.1. By Country
10.3.2. By Solubility
10.3.3. By Application
10.3.4. By Color Pallete
10.3.5. By Form
10.4. Key Takeaways
11. Latin America Food Colors Market Analysis 2017-2021 and Forecast 2022-2032, By Country
11.1. Historical Market Size Value (US$ Mn) & Volume (MT) Trend Analysis By Market Taxonomy, 2017-2021
11.2. Market Size Value (US$ Mn) & Volume (MT) Forecast By Market Taxonomy, 2022-2032
11.2.1. By Country
11.2.1.1. Brazil
11.2.1.2. Mexico
11.2.1.3. Argentina
11.2.1.4. Chile
11.2.1.5. Peru
11.2.1.6. Rest of Latin America
11.2.2. By Solubility
11.2.3. By Application
11.2.4. By Color Pallete
11.2.5. By Form
11.3. Market Attractiveness Analysis
11.3.1. By Country
11.3.2. By Solubility
11.3.3. By Application
11.3.4. By Color Pallete
11.3.5. By Form
11.4. Key Takeaways
12. Europe Food Colors Market Analysis 2017-2021 and Forecast 2022-2032, By Country
12.1. Historical Market Size Value (US$ Mn) & Volume (MT) Trend Analysis By Market Taxonomy, 2017-2021
12.2. Market Size Value (US$ Mn) & Volume (MT) Forecast By Market Taxonomy, 2022-2032
12.2.1. By Country
12.2.1.1. Germany
12.2.1.2. Italy
12.2.1.3. France
12.2.1.4. U.K.
12.2.1.5. Spain
12.2.1.6. Russia
12.2.1.7. BENELUX
12.2.1.8. Poland
12.2.1.9. Nordic Countries
12.2.1.10. Rest of Europe
12.2.2. By Solubility
12.2.3. By Application
12.2.4. By Color Pallete
12.2.5. By Form
12.3. Market Attractiveness Analysis
12.3.1. By Country
12.3.2. By Solubility
12.3.3. By Application
12.3.4. By Color Pallete
12.3.5. By Form
12.4. Key Takeaways
13. East Asia Food Colors Market Analysis 2017-2021 and Forecast 2022-2032, By Country
13.1. Historical Market Size Value (US$ Mn) & Volume (MT) Trend Analysis By Market Taxonomy, 2017-2021
13.2. Market Size Value (US$ Mn) & Volume (MT) Forecast By Market Taxonomy, 2022-2032
13.2.1. By Country
13.2.1.1. China
13.2.1.2. Japan
13.2.1.3. South Korea
13.2.2. By Solubility
13.2.3. By Application
13.2.4. By Color Pallete
13.2.5. By Form
13.3. Market Attractiveness Analysis
13.3.1. By Country
13.3.2. By Solubility
13.3.3. By Application
13.3.4. By Color Pallete
13.3.5. By Form
13.4. Key Takeaways
14. South Asia Food Colors Market Analysis 2017-2021 and Forecast 2022-2032, By Country
14.1. Historical Market Size Value (US$ Mn) & Volume (MT) Trend Analysis By Market Taxonomy, 2017-2021
14.2. Market Size Value (US$ Mn) & Volume (MT) Forecast By Market Taxonomy, 2022-2032
14.2.1. By Country
14.2.1.1. India
14.2.1.2. Thailand
14.2.1.3. Malaysia
14.2.1.4. Indonesia
14.2.1.5. Rest of South Asia
14.2.2. By Solubility
14.2.3. By Application
14.2.4. By Color Pallete
14.2.5. By Form
14.3. Market Attractiveness Analysis
14.3.1. By Country
14.3.2. By Solubility
14.3.3. By Application
14.3.4. By Color Pallete
14.3.5. By Form
14.4. Key Takeaways
15. Oceania Food Colors Market Analysis 2017-2021 and Forecast 2022-2032, By Country
15.1. Historical Market Size Value (US$ Mn) & Volume (MT) Trend Analysis By Market Taxonomy, 2017-2021
15.2. Market Size Value (US$ Mn) & Volume (MT) Forecast By Market Taxonomy, 2022-2032
15.2.1. By Country
15.2.1.1. Australia
15.2.1.2. New Zealand
15.2.2. By Solubility
15.2.3. By Application
15.2.4. By Color Pallete
15.2.5. By Form
15.3. Market Attractiveness Analysis
15.3.1. By Country
15.3.2. By Solubility
15.3.3. By Application
15.3.4. By Color Pallete
15.3.5. By Form
15.4. Key Takeaways
16. MEA Food Colors Market Analysis 2017-2021 and Forecast 2022-2032, By Country
16.1. Historical Market Size Value (US$ Mn) & Volume (MT) Trend Analysis By Market Taxonomy, 2017-2021
16.2. Market Size Value (US$ Mn) & Volume (MT) Forecast By Market Taxonomy, 2022-2032
16.2.1. By Country
16.2.1.1. GCC Countries
16.2.1.2. South Africa
16.2.1.3. Central Africa
16.2.1.4. North Africa
16.2.2. By Solubility
16.2.3. By Application
16.2.4. By Color Pallete
16.2.5. By Form
16.3. Market Attractiveness Analysis
16.3.1. By Country
16.3.2. By Solubility
16.3.3. By Application
16.3.4. By Color Pallete
16.3.5. By Form
16.4. Key Takeaways
17. Key Countries Food Colors Market Analysis
17.1. U.S.
17.1.1. Pricing Analysis
17.1.2. Market Share Analysis, 2021
17.1.2.1. By Solubility
17.1.2.2. By Application
17.1.2.3. By Color Pallete
17.1.2.4. By Form
17.2. Canada
17.2.1. Pricing Analysis
17.2.2. Market Share Analysis, 2021
17.2.2.1. By Solubility
17.2.2.2. By Application
17.2.2.3. By Color Pallete
17.2.2.4. By Form
17.3. Brazil
17.3.1. Pricing Analysis
17.3.2. Market Share Analysis, 2021
17.3.2.1. By Solubility
17.3.2.2. By Application
17.3.2.3. By Color Pallete
17.3.2.4. By Form
17.4. Mexico
17.4.1. Pricing Analysis
17.4.2. Market Share Analysis, 2021
17.4.2.1. By Solubility
17.4.2.2. By Application
17.4.2.3. By Color Pallete
17.4.2.4. By Form
17.5. Argentina
17.5.1. Pricing Analysis
17.5.2. Market Share Analysis, 2021
17.5.2.1. By Solubility
17.5.2.2. By Application
17.5.2.3. By Color Pallete
17.5.2.4. By Form
17.6. Chile
17.6.1. Pricing Analysis
17.6.2. Market Share Analysis, 2021
17.6.2.1. By Solubility
17.6.2.2. By Application
17.6.2.3. By Color Pallete
17.6.2.4. By Form
17.7. Peru
17.7.1. Pricing Analysis
17.7.2. Market Share Analysis, 2021
17.7.2.1. By Solubility
17.7.2.2. By Application
17.7.2.3. By Color Pallete
17.7.2.4. By Form
17.8. Germany
17.8.1. Pricing Analysis
17.8.2. Market Share Analysis, 2021
17.8.2.1. By Solubility
17.8.2.2. By Application
17.8.2.3. By Color Pallete
17.8.2.4. By Form
17.9. Italy
17.9.1. Pricing Analysis
17.9.2. Market Share Analysis, 2021
17.9.2.1. By Solubility
17.9.2.2. By Application
17.9.2.3. By Color Pallete
17.9.2.4. By Form
17.10. France
17.10.1. Pricing Analysis
17.10.2. Market Share Analysis, 2021
17.10.2.1. By Solubility
17.10.2.2. By Application
17.10.2.3. By Color Pallete
17.10.2.4. By Form
17.11. Spain
17.11.1. Pricing Analysis
17.11.2. Market Share Analysis, 2021
17.11.2.1. By Solubility
17.11.2.2. By Application
17.11.2.3. By Color Pallete
17.11.2.4. By Form
17.12. U.K.
17.12.1. Pricing Analysis
17.12.2. Market Share Analysis, 2021
17.12.2.1. By Solubility
17.12.2.2. By Application
17.12.2.3. By Color Pallete
17.12.2.4. By Form
17.13. Russia
17.13.1. Pricing Analysis
17.13.2. Market Share Analysis, 2021
17.13.2.1. By Solubility
17.13.2.2. By Application
17.13.2.3. By Color Pallete
17.13.2.4. By Form
17.14. Poland
17.14.1. Pricing Analysis
17.14.2. Market Share Analysis, 2021
17.14.2.1. By Solubility
17.14.2.2. By Application
17.14.2.3. By Color Pallete
17.14.2.4. By Form
17.15. BENELUX
17.15.1. Pricing Analysis
17.15.2. Market Share Analysis, 2021
17.15.2.1. By Solubility
17.15.2.2. By Application
17.15.2.3. By Color Pallete
17.15.2.4. By Form
17.16. Nordic Countries
17.16.1. Pricing Analysis
17.16.2. Market Share Analysis, 2021
17.16.2.1. By Solubility
17.16.2.2. By Application
17.16.2.3. By Color Pallete
17.16.2.4. By Form
17.17. China
17.17.1. Pricing Analysis
17.17.2. Market Share Analysis, 2021
17.17.2.1. By Solubility
17.17.2.2. By Application
17.17.2.3. By Color Pallete
17.17.2.4. By Form
17.18. Japan
17.18.1. Pricing Analysis
17.18.2. Market Share Analysis, 2021
17.18.2.1. By Solubility
17.18.2.2. By Application
17.18.2.3. By Color Pallete
17.18.2.4. By Form
17.19. South Korea
17.19.1. Pricing Analysis
17.19.2. Market Share Analysis, 2021
17.19.2.1. By Solubility
17.19.2.2. By Application
17.19.2.3. By Color Pallete
17.19.2.4. By Form
17.20. India
17.20.1. Pricing Analysis
17.20.2. Market Share Analysis, 2021
17.20.2.1. By Solubility
17.20.2.2. By Application
17.20.2.3. By Color Pallete
17.20.2.4. By Form
17.21. Thailand
17.21.1. Pricing Analysis
17.21.2. Market Share Analysis, 2021
17.21.2.1. By Solubility
17.21.2.2. By Application
17.21.2.3. By Color Pallete
17.21.2.4. By Form
17.22. Indonesia
17.22.1. Pricing Analysis
17.22.2. Market Share Analysis, 2021
17.22.2.1. By Solubility
17.22.2.2. By Application
17.22.2.3. By Color Pallete
17.22.2.4. By Form
17.23. Malaysia
17.23.1. Pricing Analysis
17.23.2. Market Share Analysis, 2021
17.23.2.1. By Solubility
17.23.2.2. By Application
17.23.2.3. By Color Pallete
17.23.2.4. By Form
17.24. Singapore
17.24.1. Pricing Analysis
17.24.2. Market Share Analysis, 2021
17.24.2.1. By Solubility
17.24.2.2. By Application
17.24.2.3. By Color Pallete
17.24.2.4. By Form
17.25. GCC Countries
17.25.1. Pricing Analysis
17.25.2. Market Share Analysis, 2021
17.25.2.1. By Solubility
17.25.2.2. By Application
17.25.2.3. By Color Pallete
17.25.2.4. By Form
17.26. South Africa
17.26.1. Pricing Analysis
17.26.2. Market Share Analysis, 2021
17.26.2.1. By Solubility
17.26.2.2. By Application
17.26.2.3. By Color Pallete
17.26.2.4. By Form
17.27. Central Africa
17.27.1. Pricing Analysis
17.27.2. Market Share Analysis, 2021
17.27.2.1. By Solubility
17.27.2.2. By Application
17.27.2.3. By Color Pallete
17.27.2.4. By Form
17.28. North Africa
17.28.1. Pricing Analysis
17.28.2. Market Share Analysis, 2021
17.28.2.1. By Solubility
17.28.2.2. By Application
17.28.2.3. By Color Pallete
17.28.2.4. By Form
18. Market Structure Analysis
18.1. Competition Dashboard
18.2. Competition Benchmarking
18.3. Market Share Analysis of Top Players
18.3.1. By Regional
18.3.2. By Solubility
18.3.3. By Application
18.3.4. By Color Pallete
18.3.5. By Form
19. Competition Analysis
19.1. Competition Deep Dive
19.1.1. Archer Daniels Midland Company
19.1.1.1. Overview
19.1.1.2. Product Portfolio
19.1.1.3. Profitability by Market Segments (Product/Age /Sales Channel/Region)
19.1.1.4. Sales Footprint
19.1.1.5. Strategy Overview
19.1.1.5.1. Marketing Strategy
19.1.1.5.2. Product Strategy
19.1.1.5.3. Channel Strategy
19.1.2. Allied Biotech Corporation
19.1.2.1. Overview
19.1.2.2. Product Portfolio
19.1.2.3. Profitability by Market Segments (Product/Age /Sales Channel/Region)
19.1.2.4. Sales Footprint
19.1.2.5. Strategy Overview
19.1.2.5.1. Marketing Strategy
19.1.2.5.2. Product Strategy
19.1.2.5.3. Channel Strategy
19.1.3. DIC Corporation (BASF SE)
19.1.3.1. Overview
19.1.3.2. Product Portfolio
19.1.3.3. Profitability by Market Segments (Product/Age /Sales Channel/Region)
19.1.3.4. Sales Footprint
19.1.3.5. Strategy Overview
19.1.3.5.1. Marketing Strategy
19.1.3.5.2. Product Strategy
19.1.3.5.3. Channel Strategy
19.1.4. BioconColors
19.1.4.1. Overview
19.1.4.2. Product Portfolio
19.1.4.3. Profitability by Market Segments (Product/Age /Sales Channel/Region)
19.1.4.4. Sales Footprint
19.1.4.5. Strategy Overview
19.1.4.5.1. Marketing Strategy
19.1.4.5.2. Product Strategy
19.1.4.5.3. Channel Strategy
19.1.5. DDW, The Color House
19.1.5.1. Overview
19.1.5.2. Product Portfolio
19.1.5.3. Profitability by Market Segments (Product/Age /Sales Channel/Region)
19.1.5.4. Sales Footprint
19.1.5.5. Strategy Overview
19.1.5.5.1. Marketing Strategy
19.1.5.5.2. Product Strategy
19.1.5.5.3. Channel Strategy
19.1.6. Döhler Group
19.1.6.1. Overview
19.1.6.2. Product Portfolio
19.1.6.3. Profitability by Market Segments (Product/Age /Sales Channel/Region)
19.1.6.4. Sales Footprint
19.1.6.5. Strategy Overview
19.1.6.5.1. Marketing Strategy
19.1.6.5.2. Product Strategy
19.1.6.5.3. Channel Strategy
19.1.7. GNT International B.V.
19.1.7.1. Overview
19.1.7.2. Product Portfolio
19.1.7.3. Profitability by Market Segments (Product/Age /Sales Channel/Region)
19.1.7.4. Sales Footprint
19.1.7.5. Strategy Overview
19.1.7.5.1. Marketing Strategy
19.1.7.5.2. Product Strategy
19.1.7.5.3. Channel Strategy
19.1.8. Kalsec Inc.
19.1.8.1. Overview
19.1.8.2. Product Portfolio
19.1.8.3. Profitability by Market Segments (Product/Age /Sales Channel/Region)
19.1.8.4. Sales Footprint
19.1.8.5. Strategy Overview
19.1.8.5.1. Marketing Strategy
19.1.8.5.2. Product Strategy
19.1.8.5.3. Channel Strategy
19.1.9. DSM
19.1.9.1. Overview
19.1.9.2. Product Portfolio
19.1.9.3. Profitability by Market Segments (Product/Age /Sales Channel/Region)
19.1.9.4. Sales Footprint
19.1.9.5. Strategy Overview
19.1.9.5.1. Marketing Strategy
19.1.9.5.2. Product Strategy
19.1.9.5.3. Channel Strategy
19.1.10. Naturex S.A.
19.1.10.1. Overview
19.1.10.2. Product Portfolio
19.1.10.3. Profitability by Market Segments (Product/Age /Sales Channel/Region)
19.1.10.4. Sales Footprint
19.1.10.5. Strategy Overview
19.1.10.5.1. Marketing Strategy
19.1.10.5.2. Product Strategy
19.1.10.5.3. Channel Strategy
19.1.11. ROHA ( A JJT Group Company)
19.1.11.1. Overview
19.1.11.2. Product Portfolio
19.1.11.3. Profitability by Market Segments (Product/Age /Sales Channel/Region)
19.1.11.4. Sales Footprint
19.1.11.5. Strategy Overview
19.1.11.5.1. Marketing Strategy
19.1.11.5.2. Product Strategy
19.1.11.5.3. Channel Strategy
19.1.12. San-Ei Gen F.F.I., Inc.
19.1.12.1. Overview
19.1.12.2. Product Portfolio
19.1.12.3. Profitability by Market Segments (Product/Age /Sales Channel/Region)
19.1.12.4. Sales Footprint
19.1.12.5. Strategy Overview
19.1.12.5.1. Marketing Strategy
19.1.12.5.2. Product Strategy
19.1.12.5.3. Channel Strategy
19.1.13. Sensient Colors LLC.
19.1.13.1. Overview
19.1.13.2. Product Portfolio
19.1.13.3. Profitability by Market Segments (Product/Age /Sales Channel/Region)
19.1.13.4. Sales Footprint
19.1.13.5. Strategy Overview
19.1.13.5.1. Marketing Strategy
19.1.13.5.2. Product Strategy
19.1.13.5.3. Channel Strategy
19.1.14. Symrise AG
19.1.14.1. Overview
19.1.14.2. Product Portfolio
19.1.14.3. Profitability by Market Segments (Product/Age /Sales Channel/Region)
19.1.14.4. Sales Footprint
19.1.14.5. Strategy Overview
19.1.14.5.1. Marketing Strategy
19.1.14.5.2. Product Strategy
19.1.14.5.3. Channel Strategy
19.1.15. Chr. Hansen Holding A/S
19.1.15.1. Overview
19.1.15.2. Product Portfolio
19.1.15.3. Profitability by Market Segments (Product/Age /Sales Channel/Region)
19.1.15.4. Sales Footprint
19.1.15.5. Strategy Overview
19.1.15.5.1. Marketing Strategy
19.1.15.5.2. Product Strategy
19.1.15.5.3. Channel Strategy
19.1.16. Others (On additional request)
20. Assumptions & Acronyms Used
21. Research Methodology
Let us know your requirement to get
100% FREE customization
List of Tables
Table 01: Global Food Colors Market Value (US$ Mn) Forecast by Region, 2017-2032
Table 02: Global Food Colors Market Volume (MT) Forecast by Region, 2017-2032
Table 03: Global Food Colors Market Value (US$ Mn) Forecast by Solubility, 2017-2032
Table 04: Global Food Colors Market Volume (MT) Forecast by Solubility, 2017-2032
Table 05: Global Food Colors Market Value (US$ Mn) Forecast by Application, 2017-2032
Table 06: Global Food Colors Market Volume (MT) Forecast by Application, 2017-2032
Table 07: Global Food Colors Market Value (US$ Mn) Forecast by Color Pallete, 2017-2032
Table 08: Global Food Colors Market Volume (MT) Forecast by Color Pallete, 2017-2032
Table 09: Global Food Colors Market Value (US$ Mn) Forecast by Form, 2017-2032
Table 10: Global Food Colors Market Volume (MT) Forecast by Form, 2017-2032
Table 11: North America Food Colors Market Value (US$ Mn) Forecast by Country, 2017-2032
Table 12: North America Food Colors Market Volume (MT) Forecast by Country, 2017-2032
Table 13: North America Food Colors Market Value (US$ Mn) Forecast by Solubility, 2017-2032
Table 14: North America Food Colors Market Volume (MT) Forecast by Solubility, 2017-2032
Table 15: North America Food Colors Market Value (US$ Mn) Forecast by Application, 2017-2032
Table 16: North America Food Colors Market Volume (MT) Forecast by Application, 2017-2032
Table 17: North America Food Colors Market Value (US$ Mn) Forecast by Color Pallete, 2017-2032
Table 18: North America Food Colors Market Volume (MT) Forecast by Color Pallete, 2017-2032
Table 19: North America Food Colors Market Value (US$ Mn) Forecast by Form, 2017-2032
Table 20: North America Food Colors Market Volume (MT) Forecast by Form, 2017-2032
Table 21: Latin America Food Colors Market Value (US$ Mn) Forecast by Country, 2017-2032
Table 22: Latin America Food Colors Market Volume (MT) Forecast by Country, 2017-2032
Table 23: Latin America Food Colors Market Value (US$ Mn) Forecast by Solubility, 2017-2032
Table 24: Latin America Food Colors Market Volume (MT) Forecast by Solubility, 2017-2032
Table 25: Latin America Food Colors Market Value (US$ Mn) Forecast by Application, 2017-2032
Table 26: Latin America Food Colors Market Volume (MT) Forecast by Application, 2017-2032
Table 27: Latin America Food Colors Market Value (US$ Mn) Forecast by Color Pallete, 2017-2032
Table 28: Latin America Food Colors Market Volume (MT) Forecast by Color Pallete, 2017-2032
Table 29: Latin America Food Colors Market Value (US$ Mn) Forecast by Form, 2017-2032
Table 30: Latin America Food Colors Market Volume (MT) Forecast by Form, 2017-2032
Table 31: Europe Food Colors Market Value (US$ Mn) Forecast by Country, 2017-2032
Table 32: Europe Food Colors Market Volume (MT) Forecast by Country, 2017-2032
Table 33: Europe Food Colors Market Value (US$ Mn) Forecast by Solubility, 2017-2032
Table 34: Europe Food Colors Market Volume (MT) Forecast by Solubility, 2017-2032
Table 35: Europe Food Colors Market Value (US$ Mn) Forecast by Application, 2017-2032
Table 36: Europe Food Colors Market Volume (MT) Forecast by Application, 2017-2032
Table 37: Europe Food Colors Market Value (US$ Mn) Forecast by Color Pallete, 2017-2032
Table 38: Europe Food Colors Market Volume (MT) Forecast by Color Pallete, 2017-2032
Table 39: Europe Food Colors Market Value (US$ Mn) Forecast by Form, 2017-2032
Table 40: Europe Food Colors Market Volume (MT) Forecast by Form, 2017-2032
Table 41: East Asia Food Colors Market Value (US$ Mn) Forecast by Country, 2017-2032
Table 42: East Asia Food Colors Market Volume (MT) Forecast by Country, 2017-2032
Table 43: East Asia Food Colors Market Value (US$ Mn) Forecast by Solubility, 2017-2032
Table 44: East Asia Food Colors Market Volume (MT) Forecast by Solubility, 2017-2032
Table 45: East Asia Food Colors Market Value (US$ Mn) Forecast by Application, 2017-2032
Table 46: East Asia Food Colors Market Volume (MT) Forecast by Application, 2017-2032
Table 47: East Asia Food Colors Market Value (US$ Mn) Forecast by Color Pallete, 2017-2032
Table 48: East Asia Food Colors Market Volume (MT) Forecast by Color Pallete, 2017-2032
Table 49: East Asia Food Colors Market Value (US$ Mn) Forecast by Form, 2017-2032
Table 50: East Asia Food Colors Market Volume (MT) Forecast by Form, 2017-2032
Table 51: South Asia Food Colors Market Value (US$ Mn) Forecast by Country, 2017-2032
Table 52: South Asia Food Colors Market Volume (MT) Forecast by Country, 2017-2032
Table 53: South Asia Food Colors Market Value (US$ Mn) Forecast by Solubility, 2017-2032
Table 54: South Asia Food Colors Market Volume (MT) Forecast by Solubility, 2017-2032
Table 55: South Asia Food Colors Market Value (US$ Mn) Forecast by Application, 2017-2032
Table 56: South Asia Food Colors Market Volume (MT) Forecast by Application, 2017-2032
Table 57: South Asia Food Colors Market Value (US$ Mn) Forecast by Color Pallete, 2017-2032
Table 58: South Asia Food Colors Market Volume (MT) Forecast by Color Pallete, 2017-2032
Table 59: South Asia Food Colors Market Value (US$ Mn) Forecast by Form, 2017-2032
Table 60: South Asia Food Colors Market Volume (MT) Forecast by Form, 2017-2032
Table 61: Oceania Food Colors Market Value (US$ Mn) Forecast by Country, 2017-2032
Table 62: Oceania Food Colors Market Volume (MT) Forecast by Country, 2017-2032
Table 63: Oceania Food Colors Market Value (US$ Mn) Forecast by Solubility, 2017-2032
Table 64: Oceania Food Colors Market Volume (MT) Forecast by Solubility, 2017-2032
Table 65: Oceania Food Colors Market Value (US$ Mn) Forecast by Application, 2017-2032
Table 66: Oceania Food Colors Market Volume (MT) Forecast by Application, 2017-2032
Table 67: Oceania Food Colors Market Value (US$ Mn) Forecast by Color Pallete, 2017-2032
Table 68: Oceania Food Colors Market Volume (MT) Forecast by Color Pallete, 2017-2032
Table 69: Oceania Food Colors Market Value (US$ Mn) Forecast by Form, 2017-2032
Table 70: Oceania Food Colors Market Volume (MT) Forecast by Form, 2017-2032
Table 71: MEA Food Colors Market Value (US$ Mn) Forecast by Country, 2017-2032
Table 72: MEA Food Colors Market Volume (MT) Forecast by Country, 2017-2032
Table 73: MEA Food Colors Market Value (US$ Mn) Forecast by Solubility, 2017-2032
Table 74: MEA Food Colors Market Volume (MT) Forecast by Solubility, 2017-2032
Table 75: MEA Food Colors Market Value (US$ Mn) Forecast by Application, 2017-2032
Table 76: MEA Food Colors Market Volume (MT) Forecast by Application, 2017-2032
Table 77: MEA Food Colors Market Value (US$ Mn) Forecast by Color Pallete, 2017-2032
Table 78: MEA Food Colors Market Volume (MT) Forecast by Color Pallete, 2017-2032
Table 79: MEA Food Colors Market Value (US$ Mn) Forecast by Form, 2017-2032
Table 80: MEA Food Colors Market Volume (MT) Forecast by Form, 2017-2032
Find your sweet spots for generating winning opportunities in this market.
Talk to AnalystList of Charts
Figure 01: Global Food Colors Market Value (US$ Mn) by Solubility, 2022-2032
Figure 02: Global Food Colors Market Value (US$ Mn) by Application, 2022-2032
Figure 03: Global Food Colors Market Value (US$ Mn) by Color Pallete, 2022-2032
Figure 04: Global Food Colors Market Value (US$ Mn) by Form, 2022-2032
Figure 05: Global Food Colors Market Value (US$ Mn) by Region, 2022-2032
Figure 06: Global Food Colors Market Value (US$ Mn) Analysis by Region, 2017-2032
Figure 07: Global Food Colors Market Volume (MT) Analysis by Region, 2017-2032
Figure 08: Global Food Colors Market Value Share (%) and BPS Analysis by Region, 2022-2032
Figure 09: Global Food Colors Market Y-o-Y Growth (%) Projections by Region, 2022-2032
Figure 10: Global Food Colors Market Value (US$ Mn) Analysis by Solubility, 2017-2032
Figure 11: Global Food Colors Market Volume (MT) Analysis by Solubility, 2017-2032
Figure 12: Global Food Colors Market Value Share (%) and BPS Analysis by Solubility, 2022-2032
Figure 13: Global Food Colors Market Y-o-Y Growth (%) Projections by Solubility, 2022-2032
Figure 14: Global Food Colors Market Value (US$ Mn) Analysis by Application, 2017-2032
Figure 15: Global Food Colors Market Volume (MT) Analysis by Application, 2017-2032
Figure 16: Global Food Colors Market Value Share (%) and BPS Analysis by Application, 2022-2032
Figure 17: Global Food Colors Market Y-o-Y Growth (%) Projections by Application, 2022-2032
Figure 18: Global Food Colors Market Value (US$ Mn) Analysis by Color Pallete, 2017-2032
Figure 19: Global Food Colors Market Volume (MT) Analysis by Color Pallete, 2017-2032
Figure 20: Global Food Colors Market Value Share (%) and BPS Analysis by Color Pallete, 2022-2032
Figure 21: Global Food Colors Market Y-o-Y Growth (%) Projections by Color Pallete, 2022-2032
Figure 22: Global Food Colors Market Value (US$ Mn) Analysis by Form, 2017-2032
Figure 23: Global Food Colors Market Volume (MT) Analysis by Form, 2017-2032
Figure 24: Global Food Colors Market Value Share (%) and BPS Analysis by Form, 2022-2032
Figure 25: Global Food Colors Market Y-o-Y Growth (%) Projections by Form, 2022-2032
Figure 26: Global Food Colors Market Attractiveness by Solubility, 2022-2032
Figure 27: Global Food Colors Market Attractiveness by Application, 2022-2032
Figure 28: Global Food Colors Market Attractiveness by Color Pallete, 2022-2032
Figure 29: Global Food Colors Market Attractiveness by Form, 2022-2032
Figure 30: Global Food Colors Market Attractiveness by Region, 2022-2032
Figure 31: North America Food Colors Market Value (US$ Mn) by Solubility, 2022-2032
Figure 32: North America Food Colors Market Value (US$ Mn) by Application, 2022-2032
Figure 33: North America Food Colors Market Value (US$ Mn) by Color Pallete, 2022-2032
Figure 34: North America Food Colors Market Value (US$ Mn) by Form, 2022-2032
Figure 35: North America Food Colors Market Value (US$ Mn) by Country, 2022-2032
Figure 36: North America Food Colors Market Value (US$ Mn) Analysis by Country, 2017-2032
Figure 37: North America Food Colors Market Volume (MT) Analysis by Country, 2017-2032
Figure 38: North America Food Colors Market Value Share (%) and BPS Analysis by Country, 2022-2032
Figure 39: North America Food Colors Market Y-o-Y Growth (%) Projections by Country, 2022-2032
Figure 40: North America Food Colors Market Value (US$ Mn) Analysis by Solubility, 2017-2032
Figure 41: North America Food Colors Market Volume (MT) Analysis by Solubility, 2017-2032
Figure 42: North America Food Colors Market Value Share (%) and BPS Analysis by Solubility, 2022-2032
Figure 43: North America Food Colors Market Y-o-Y Growth (%) Projections by Solubility, 2022-2032
Figure 44: North America Food Colors Market Value (US$ Mn) Analysis by Application, 2017-2032
Figure 45: North America Food Colors Market Volume (MT) Analysis by Application, 2017-2032
Figure 46: North America Food Colors Market Value Share (%) and BPS Analysis by Application, 2022-2032
Figure 47: North America Food Colors Market Y-o-Y Growth (%) Projections by Application, 2022-2032
Figure 48: North America Food Colors Market Value (US$ Mn) Analysis by Color Pallete, 2017-2032
Figure 49: North America Food Colors Market Volume (MT) Analysis by Color Pallete, 2017-2032
Figure 50: North America Food Colors Market Value Share (%) and BPS Analysis by Color Pallete, 2022-2032
Figure 51: North America Food Colors Market Y-o-Y Growth (%) Projections by Color Pallete, 2022-2032
Figure 52: North America Food Colors Market Value (US$ Mn) Analysis by Form, 2017-2032
Figure 53: North America Food Colors Market Volume (MT) Analysis by Form, 2017-2032
Figure 54: North America Food Colors Market Value Share (%) and BPS Analysis by Form, 2022-2032
Figure 55: North America Food Colors Market Y-o-Y Growth (%) Projections by Form, 2022-2032
Figure 56: North America Food Colors Market Attractiveness by Solubility, 2022-2032
Figure 57: North America Food Colors Market Attractiveness by Application, 2022-2032
Figure 58: North America Food Colors Market Attractiveness by Color Pallete, 2022-2032
Figure 59: North America Food Colors Market Attractiveness by Form, 2022-2032
Figure 60: North America Food Colors Market Attractiveness by Country, 2022-2032
Figure 61: Latin America Food Colors Market Value (US$ Mn) by Solubility, 2022-2032
Figure 62: Latin America Food Colors Market Value (US$ Mn) by Application, 2022-2032
Figure 63: Latin America Food Colors Market Value (US$ Mn) by Color Pallete, 2022-2032
Figure 64: Latin America Food Colors Market Value (US$ Mn) by Form, 2022-2032
Figure 65: Latin America Food Colors Market Value (US$ Mn) by Country, 2022-2032
Figure 66: Latin America Food Colors Market Value (US$ Mn) Analysis by Country, 2017-2032
Figure 67: Latin America Food Colors Market Volume (MT) Analysis by Country, 2017-2032
Figure 68: Latin America Food Colors Market Value Share (%) and BPS Analysis by Country, 2022-2032
Figure 69: Latin America Food Colors Market Y-o-Y Growth (%) Projections by Country, 2022-2032
Figure 70: Latin America Food Colors Market Value (US$ Mn) Analysis by Solubility, 2017-2032
Figure 71: Latin America Food Colors Market Volume (MT) Analysis by Solubility, 2017-2032
Figure 72: Latin America Food Colors Market Value Share (%) and BPS Analysis by Solubility, 2022-2032
Figure 73: Latin America Food Colors Market Y-o-Y Growth (%) Projections by Solubility, 2022-2032
Figure 74: Latin America Food Colors Market Value (US$ Mn) Analysis by Application, 2017-2032
Figure 75: Latin America Food Colors Market Volume (MT) Analysis by Application, 2017-2032
Figure 76: Latin America Food Colors Market Value Share (%) and BPS Analysis by Application, 2022-2032
Figure 77: Latin America Food Colors Market Y-o-Y Growth (%) Projections by Application, 2022-2032
Figure 78: Latin America Food Colors Market Value (US$ Mn) Analysis by Color Pallete, 2017-2032
Figure 79: Latin America Food Colors Market Volume (MT) Analysis by Color Pallete, 2017-2032
Figure 80: Latin America Food Colors Market Value Share (%) and BPS Analysis by Color Pallete, 2022-2032
Figure 81: Latin America Food Colors Market Y-o-Y Growth (%) Projections by Color Pallete, 2022-2032
Figure 82: Latin America Food Colors Market Value (US$ Mn) Analysis by Form, 2017-2032
Figure 83: Latin America Food Colors Market Volume (MT) Analysis by Form, 2017-2032
Figure 84: Latin America Food Colors Market Value Share (%) and BPS Analysis by Form, 2022-2032
Figure 85: Latin America Food Colors Market Y-o-Y Growth (%) Projections by Form, 2022-2032
Figure 86: Latin America Food Colors Market Attractiveness by Solubility, 2022-2032
Figure 87: Latin America Food Colors Market Attractiveness by Application, 2022-2032
Figure 88: Latin America Food Colors Market Attractiveness by Color Pallete, 2022-2032
Figure 89: Latin America Food Colors Market Attractiveness by Form, 2022-2032
Figure 90: Latin America Food Colors Market Attractiveness by Country, 2022-2032
Figure 91: Europe Food Colors Market Value (US$ Mn) by Solubility, 2022-2032
Figure 92: Europe Food Colors Market Value (US$ Mn) by Application, 2022-2032
Figure 93: Europe Food Colors Market Value (US$ Mn) by Color Pallete, 2022-2032
Figure 94: Europe Food Colors Market Value (US$ Mn) by Form, 2022-2032
Figure 95: Europe Food Colors Market Value (US$ Mn) by Country, 2022-2032
Figure 96: Europe Food Colors Market Value (US$ Mn) Analysis by Country, 2017-2032
Figure 97: Europe Food Colors Market Volume (MT) Analysis by Country, 2017-2032
Figure 98: Europe Food Colors Market Value Share (%) and BPS Analysis by Country, 2022-2032
Figure 99: Europe Food Colors Market Y-o-Y Growth (%) Projections by Country, 2022-2032
Figure 100: Europe Food Colors Market Value (US$ Mn) Analysis by Solubility, 2017-2032
Figure 101: Europe Food Colors Market Volume (MT) Analysis by Solubility, 2017-2032
Figure 102: Europe Food Colors Market Value Share (%) and BPS Analysis by Solubility, 2022-2032
Figure 103: Europe Food Colors Market Y-o-Y Growth (%) Projections by Solubility, 2022-2032
Figure 104: Europe Food Colors Market Value (US$ Mn) Analysis by Application, 2017-2032
Figure 105: Europe Food Colors Market Volume (MT) Analysis by Application, 2017-2032
Figure 106: Europe Food Colors Market Value Share (%) and BPS Analysis by Application, 2022-2032
Figure 107: Europe Food Colors Market Y-o-Y Growth (%) Projections by Application, 2022-2032
Figure 108: Europe Food Colors Market Value (US$ Mn) Analysis by Color Pallete, 2017-2032
Figure 109: Europe Food Colors Market Volume (MT) Analysis by Color Pallete, 2017-2032
Figure 110: Europe Food Colors Market Value Share (%) and BPS Analysis by Color Pallete, 2022-2032
Figure 111: Europe Food Colors Market Y-o-Y Growth (%) Projections by Color Pallete, 2022-2032
Figure 112: Europe Food Colors Market Value (US$ Mn) Analysis by Form, 2017-2032
Figure 113: Europe Food Colors Market Volume (MT) Analysis by Form, 2017-2032
Figure 114: Europe Food Colors Market Value Share (%) and BPS Analysis by Form, 2022-2032
Figure 115: Europe Food Colors Market Y-o-Y Growth (%) Projections by Form, 2022-2032
Figure 116: Europe Food Colors Market Attractiveness by Solubility, 2022-2032
Figure 117: Europe Food Colors Market Attractiveness by Application, 2022-2032
Figure 118: Europe Food Colors Market Attractiveness by Color Pallete, 2022-2032
Figure 119: Europe Food Colors Market Attractiveness by Form, 2022-2032
Figure 120: Europe Food Colors Market Attractiveness by Country, 2022-2032
Figure 121: East Asia Food Colors Market Value (US$ Mn) by Solubility, 2022-2032
Figure 122: East Asia Food Colors Market Value (US$ Mn) by Application, 2022-2032
Figure 123: East Asia Food Colors Market Value (US$ Mn) by Color Pallete, 2022-2032
Figure 124: East Asia Food Colors Market Value (US$ Mn) by Form, 2022-2032
Figure 125: East Asia Food Colors Market Value (US$ Mn) by Country, 2022-2032
Figure 126: East Asia Food Colors Market Value (US$ Mn) Analysis by Country, 2017-2032
Figure 127: East Asia Food Colors Market Volume (MT) Analysis by Country, 2017-2032
Figure 128: East Asia Food Colors Market Value Share (%) and BPS Analysis by Country, 2022-2032
Figure 129: East Asia Food Colors Market Y-o-Y Growth (%) Projections by Country, 2022-2032
Figure 130: East Asia Food Colors Market Value (US$ Mn) Analysis by Solubility, 2017-2032
Figure 131: East Asia Food Colors Market Volume (MT) Analysis by Solubility, 2017-2032
Figure 132: East Asia Food Colors Market Value Share (%) and BPS Analysis by Solubility, 2022-2032
Figure 133: East Asia Food Colors Market Y-o-Y Growth (%) Projections by Solubility, 2022-2032
Figure 134: East Asia Food Colors Market Value (US$ Mn) Analysis by Application, 2017-2032
Figure 135: East Asia Food Colors Market Volume (MT) Analysis by Application, 2017-2032
Figure 136: East Asia Food Colors Market Value Share (%) and BPS Analysis by Application, 2022-2032
Figure 137: East Asia Food Colors Market Y-o-Y Growth (%) Projections by Application, 2022-2032
Figure 138: East Asia Food Colors Market Value (US$ Mn) Analysis by Color Pallete, 2017-2032
Figure 139: East Asia Food Colors Market Volume (MT) Analysis by Color Pallete, 2017-2032
Figure 140: East Asia Food Colors Market Value Share (%) and BPS Analysis by Color Pallete, 2022-2032
Figure 141: East Asia Food Colors Market Y-o-Y Growth (%) Projections by Color Pallete, 2022-2032
Figure 142: East Asia Food Colors Market Value (US$ Mn) Analysis by Form, 2017-2032
Figure 143: East Asia Food Colors Market Volume (MT) Analysis by Form, 2017-2032
Figure 144: East Asia Food Colors Market Value Share (%) and BPS Analysis by Form, 2022-2032
Figure 145: East Asia Food Colors Market Y-o-Y Growth (%) Projections by Form, 2022-2032
Figure 146: East Asia Food Colors Market Attractiveness by Solubility, 2022-2032
Figure 147: East Asia Food Colors Market Attractiveness by Application, 2022-2032
Figure 148: East Asia Food Colors Market Attractiveness by Color Pallete, 2022-2032
Figure 149: East Asia Food Colors Market Attractiveness by Form, 2022-2032
Figure 150: East Asia Food Colors Market Attractiveness by Country, 2022-2032
Figure 151: South Asia Food Colors Market Value (US$ Mn) by Solubility, 2022-2032
Figure 152: South Asia Food Colors Market Value (US$ Mn) by Application, 2022-2032
Figure 153: South Asia Food Colors Market Value (US$ Mn) by Color Pallete, 2022-2032
Figure 154: South Asia Food Colors Market Value (US$ Mn) by Form, 2022-2032
Figure 155: South Asia Food Colors Market Value (US$ Mn) by Country, 2022-2032
Figure 156: South Asia Food Colors Market Value (US$ Mn) Analysis by Country, 2017-2032
Figure 157: South Asia Food Colors Market Volume (MT) Analysis by Country, 2017-2032
Figure 158: South Asia Food Colors Market Value Share (%) and BPS Analysis by Country, 2022-2032
Figure 159: South Asia Food Colors Market Y-o-Y Growth (%) Projections by Country, 2022-2032
Figure 160: South Asia Food Colors Market Value (US$ Mn) Analysis by Solubility, 2017-2032
Figure 161: South Asia Food Colors Market Volume (MT) Analysis by Solubility, 2017-2032
Figure 162: South Asia Food Colors Market Value Share (%) and BPS Analysis by Solubility, 2022-2032
Figure 163: South Asia Food Colors Market Y-o-Y Growth (%) Projections by Solubility, 2022-2032
Figure 164: South Asia Food Colors Market Value (US$ Mn) Analysis by Application, 2017-2032
Figure 165: South Asia Food Colors Market Volume (MT) Analysis by Application, 2017-2032
Figure 166: South Asia Food Colors Market Value Share (%) and BPS Analysis by Application, 2022-2032
Figure 167: South Asia Food Colors Market Y-o-Y Growth (%) Projections by Application, 2022-2032
Figure 168: South Asia Food Colors Market Value (US$ Mn) Analysis by Color Pallete, 2017-2032
Figure 169: South Asia Food Colors Market Volume (MT) Analysis by Color Pallete, 2017-2032
Figure 170: South Asia Food Colors Market Value Share (%) and BPS Analysis by Color Pallete, 2022-2032
Figure 171: South Asia Food Colors Market Y-o-Y Growth (%) Projections by Color Pallete, 2022-2032
Figure 172: South Asia Food Colors Market Value (US$ Mn) Analysis by Form, 2017-2032
Figure 173: South Asia Food Colors Market Volume (MT) Analysis by Form, 2017-2032
Figure 174: South Asia Food Colors Market Value Share (%) and BPS Analysis by Form, 2022-2032
Figure 175: South Asia Food Colors Market Y-o-Y Growth (%) Projections by Form, 2022-2032
Figure 176: South Asia Food Colors Market Attractiveness by Solubility, 2022-2032
Figure 177: South Asia Food Colors Market Attractiveness by Application, 2022-2032
Figure 178: South Asia Food Colors Market Attractiveness by Color Pallete, 2022-2032
Figure 179: South Asia Food Colors Market Attractiveness by Form, 2022-2032
Figure 180: South Asia Food Colors Market Attractiveness by Country, 2022-2032
Figure 181: Oceania Food Colors Market Value (US$ Mn) by Solubility, 2022-2032
Figure 182: Oceania Food Colors Market Value (US$ Mn) by Application, 2022-2032
Figure 183: Oceania Food Colors Market Value (US$ Mn) by Color Pallete, 2022-2032
Figure 184: Oceania Food Colors Market Value (US$ Mn) by Form, 2022-2032
Figure 185: Oceania Food Colors Market Value (US$ Mn) by Country, 2022-2032
Figure 186: Oceania Food Colors Market Value (US$ Mn) Analysis by Country, 2017-2032
Figure 187: Oceania Food Colors Market Volume (MT) Analysis by Country, 2017-2032
Figure 188: Oceania Food Colors Market Value Share (%) and BPS Analysis by Country, 2022-2032
Figure 189: Oceania Food Colors Market Y-o-Y Growth (%) Projections by Country, 2022-2032
Figure 190: Oceania Food Colors Market Value (US$ Mn) Analysis by Solubility, 2017-2032
Figure 191: Oceania Food Colors Market Volume (MT) Analysis by Solubility, 2017-2032
Figure 192: Oceania Food Colors Market Value Share (%) and BPS Analysis by Solubility, 2022-2032
Figure 193: Oceania Food Colors Market Y-o-Y Growth (%) Projections by Solubility, 2022-2032
Figure 194: Oceania Food Colors Market Value (US$ Mn) Analysis by Application, 2017-2032
Figure 195: Oceania Food Colors Market Volume (MT) Analysis by Application, 2017-2032
Figure 196: Oceania Food Colors Market Value Share (%) and BPS Analysis by Application, 2022-2032
Figure 197: Oceania Food Colors Market Y-o-Y Growth (%) Projections by Application, 2022-2032
Figure 198: Oceania Food Colors Market Value (US$ Mn) Analysis by Color Pallete, 2017-2032
Figure 199: Oceania Food Colors Market Volume (MT) Analysis by Color Pallete, 2017-2032
Figure 200: Oceania Food Colors Market Value Share (%) and BPS Analysis by Color Pallete, 2022-2032
Figure 201: Oceania Food Colors Market Y-o-Y Growth (%) Projections by Color Pallete, 2022-2032
Figure 202: Oceania Food Colors Market Value (US$ Mn) Analysis by Form, 2017-2032
Figure 203: Oceania Food Colors Market Volume (MT) Analysis by Form, 2017-2032
Figure 204: Oceania Food Colors Market Value Share (%) and BPS Analysis by Form, 2022-2032
Figure 205: Oceania Food Colors Market Y-o-Y Growth (%) Projections by Form, 2022-2032
Figure 206: Oceania Food Colors Market Attractiveness by Solubility, 2022-2032
Figure 207: Oceania Food Colors Market Attractiveness by Application, 2022-2032
Figure 208: Oceania Food Colors Market Attractiveness by Color Pallete, 2022-2032
Figure 209: Oceania Food Colors Market Attractiveness by Form, 2022-2032
Figure 210: Oceania Food Colors Market Attractiveness by Country, 2022-2032
Figure 211: MEA Food Colors Market Value (US$ Mn) by Solubility, 2022-2032
Figure 212: MEA Food Colors Market Value (US$ Mn) by Application, 2022-2032
Figure 213: MEA Food Colors Market Value (US$ Mn) by Color Pallete, 2022-2032
Figure 214: MEA Food Colors Market Value (US$ Mn) by Form, 2022-2032
Figure 215: MEA Food Colors Market Value (US$ Mn) by Country, 2022-2032
Figure 216: MEA Food Colors Market Value (US$ Mn) Analysis by Country, 2017-2032
Figure 217: MEA Food Colors Market Volume (MT) Analysis by Country, 2017-2032
Figure 218: MEA Food Colors Market Value Share (%) and BPS Analysis by Country, 2022-2032
Figure 219: MEA Food Colors Market Y-o-Y Growth (%) Projections by Country, 2022-2032
Figure 220: MEA Food Colors Market Value (US$ Mn) Analysis by Solubility, 2017-2032
Figure 221: MEA Food Colors Market Volume (MT) Analysis by Solubility, 2017-2032
Figure 222: MEA Food Colors Market Value Share (%) and BPS Analysis by Solubility, 2022-2032
Figure 223: MEA Food Colors Market Y-o-Y Growth (%) Projections by Solubility, 2022-2032
Figure 224: MEA Food Colors Market Value (US$ Mn) Analysis by Application, 2017-2032
Figure 225: MEA Food Colors Market Volume (MT) Analysis by Application, 2017-2032
Figure 226: MEA Food Colors Market Value Share (%) and BPS Analysis by Application, 2022-2032
Figure 227: MEA Food Colors Market Y-o-Y Growth (%) Projections by Application, 2022-2032
Figure 228: MEA Food Colors Market Value (US$ Mn) Analysis by Color Pallete, 2017-2032
Figure 229: MEA Food Colors Market Volume (MT) Analysis by Color Pallete, 2017-2032
Figure 230: MEA Food Colors Market Value Share (%) and BPS Analysis by Color Pallete, 2022-2032
Figure 231: MEA Food Colors Market Y-o-Y Growth (%) Projections by Color Pallete, 2022-2032
Figure 232: MEA Food Colors Market Value (US$ Mn) Analysis by Form, 2017-2032
Figure 233: MEA Food Colors Market Volume (MT) Analysis by Form, 2017-2032
Figure 234: MEA Food Colors Market Value Share (%) and BPS Analysis by Form, 2022-2032
Figure 235: MEA Food Colors Market Y-o-Y Growth (%) Projections by Form, 2022-2032
Figure 236: MEA Food Colors Market Attractiveness by Solubility, 2022-2032
Figure 237: MEA Food Colors Market Attractiveness by Application, 2022-2032
Figure 238: MEA Food Colors Market Attractiveness by Color Pallete, 2022-2032
Figure 239: MEA Food Colors Market Attractiveness by Form, 2022-2032
Figure 240: MEA Food Colors Market Attractiveness by Country, 2022-2032
Need specific information?
Request CustomizationExplore Food and Beverage Insights
View Reports