Lycopene Food Colors Market Size and Share Forecast Outlook 2025 to 2035

The global Lycopene Food Colors Market is valued at USD 114 million in 2025 and is projected to reach USD 314.9 million by 2035, registering a CAGR of 10.7%. In 2025, lycopene accounted for 2.4% of the USD 4.83 billion global food-colors market. Powder form holds the largest share at 42.3%, dairy food products led applications with 17.3%, and North America was the most lucrative market with a 38.6% revenue share.
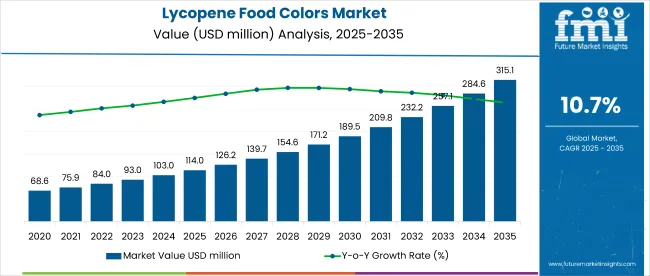
Quick Stats - Lycopene Food Colors Market

  • Industry Value (2025): USD 114 million
  • Projected Value in 2035: USD 314.9 million
  • CAGR (2025 to 2035): 10.7%
  • Powder Form Share (2025): 42.3%
  • Dairy Food Products Application Share (2025): 17.3%
  • North America Revenue Share (2025): 38.6%

Lycopene Food Colors Market

Metric Value
Market Value (2025) USD 114 million
Market Value (2035) USD 314.9 million
CAGR (2025 to 2035) 10.7%

Lycopene’s unit economics are shaped by a few high-impact cost centers. Raw material, typically tomato pomace accounts for just 10-15% of COGS, especially when secured through long-term contracts during seasonal gluts. The bulk of expenses lie in solvents and utilities (30-35%), where supercritical CO₂ offers greener extraction but demands high capex, while hybrid ethanol/hexane remains the cost-effective standard.

Purification and formulation contribute another 25-30%, with trade-offs between inline crystallization and column chromatography. QA and compliance (5-8%) add further pressure due to 24-month shelf-life testing. Gross margins vary widely commodity players hover around 25-30%.

The push for cleaner, label-friendly alternatives in food coloring is accelerating, especially as California’s ban on Red-3 and Red-40 takes effect in 2027. This regulatory shift, alongside FDA’s renewed scrutiny of synthetic dyes, has prompted brands to urgently seek replacements that don’t trigger consumer alarm. Lycopene, derived from tomatoes, has emerged as a go-to red colorant.

Unlike carmine, which is insect-derived and often flagged by health-conscious or vegan consumers, lycopene enables brands to label their products with more familiar, plant-based terms like “tomato lycopene,” aligning with the clean-label trend. In a 2025 USA survey done by Future Market Insights as part of its consumer trends report, 60% of shoppers expressed a clear preference for natural colors, and similar consumer expectations are growing across Europe.

Beyond its visual appeal, lycopene offers a marketing edge with its antioxidant halo. Backed by clinical studies supporting cardiovascular and skin health, lycopene fits perfectly into the “color plus function” positioning that many wellness brands are adopting. In the USA, claiming antioxidant benefits can quickly cross into legally risky territory. While structure/function claims are allowed, implying disease prevention (e.g., “reduces cancer risk”) requires robust human data and is tightly regulated by the FDA. Brands walking this line must ensure airtight compliance to avoid regulatory blowback.

Lycopene may ride the clean-label wave today, but its competitive landscape is shifting fast. Beetroot and black-carrot anthocyanins offer cost advantages, though their muted tones and instability in dairy limit broad adoption. Carmine delivers vibrancy and performance, but faces mounting pressure due to its insect origin and rising prices, especially from vegan and natural-product segments. Corn-derived anthocyanins like Amaize® are emerging as a middle ground, offering better stability and avoiding the supply-chain volatility tied to tomato-derived pigments.

The real disruption is brewing elsewhere. Precision-fermented red pigments, like those engineered from Yarrowia yeast are advancing rapidly. These biotech innovations are designed to replicate Red-40’s bold hue with clean-label credentials and far greater efficiency, using half the dosage to achieve the same effect.

Lycopene Food Colors Market by Top Investment Segments

The segmentation has been segmented into Nature; Organic; Conventional; by Application; Confectionery and Bakery Products; Beverages; Packaged Food/Frozen Products; Dairy Food Products; Cosmetics; Dietary Supplements; Others; by Form; Powder; Capsule; Syrup; and by Region; North America; Latin America; Western Europe; Eastern Europe; Balkans & Baltic; Russia & Belarus; Central Asia; East Asia; South Asia & Pacific; Middle East & Africa.

By Nature - Conventional Segment Holds 55% Market Share in 2025

The conventional segment is expected to lead the Lycopene Food Colors Market in 2025, capturing 55% of total revenues, while organic accounts for the remaining 45%. This dominance has been driven by growing consumer preference for clean-label ingredients and tighter regulatory scrutiny of artificial dyes, which has reinforced lycopene’s positioning as a naturally derived pigment.

Market entry barriers have been lowered for Natural formulations through more streamlined approval pathways in key regions, whereas Synthetic variants are increasingly viewed as subject to potential future restrictions. Accordingly, investments have been steered toward scaling up organic extraction and refining techniques, ensuring that natural-color offerings remain both cost-competitive and compliant with evolving food-safety mandates.

By Application - Beverages Segment Holds 40% Market Share in 2025

Beverages are projected to command the largest share of the Lycopene Food Colors Market in 2025, accounting for 40% of total revenues. This leadership has been underpinned by the surge in demand for visually appealing, health-oriented drinks, where lycopene’s antioxidant properties dovetail with consumer clean-label expectations.

Natural formulations have secured 38.8% of the beverage subsegment, reflecting regulatory encouragement of plant-derived colorants, while synthetic variants hold 28.0%, constrained by potential future restrictions. Investments have therefore been focused on optimizing extraction and stabilization methods tailored to beverage applications, ensuring color consistency and shelf-life stability in high-volume production environments.
Preference for Lycopene Food Colors in Powder Form Continues

Lycopene Food Colors Market Analysis By Form

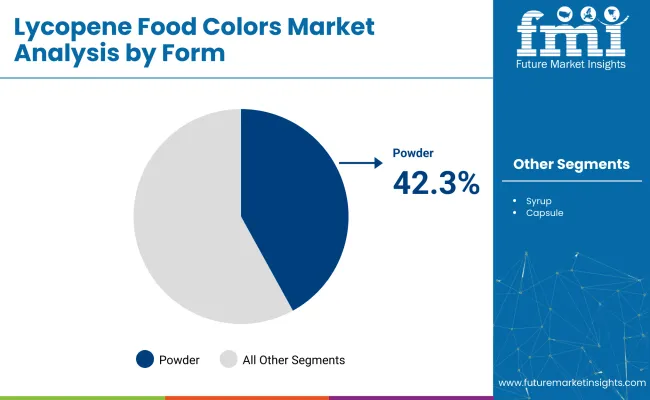
Powder format is set to dominate the Lycopene Food Colors Market in 2025, securing a 42.3% share of total revenues, while other forms such as capsule and syrup remain secondary. This preference has been driven by powder’s superior stability, ease of handling and dosage precision, which align with large-scale production and clean-label requirements.

Investments have been prioritized toward improving powder microencapsulation and flow properties to enhance solubility and color consistency across diverse applications, whereas liquid and capsule formats continue to face challenges related to shelf-life and formulation complexity.
Lycopene Food Colors Demand Analysis by Country

Country Wise Analysis Of Lycopene Food Colors Market

United States Lycopene Food Colors Market Analysis

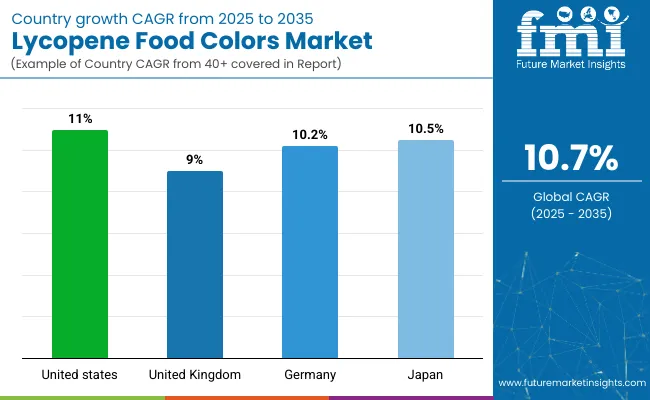
The USA lycopene food-colors category is the growth pacesetter: from USD 44 million in 2025 it is expected to touch roughly USD 125 million by 2035, compounding at about 11 percent a year. Production economics remain tight, extraction and processing soak up 24 percent of costs and stability-related waste adds another eight, but regulatory momentum is on the brand side.

Five FDA GRAS notifications cleared in 2024 have opened the door for a wave of functional-food launches, while natural pigments already command 12 percent of food-color shelf space. A decisive 68% of USA shoppers now screen for clean-label claims, so brands that marry “raw, with the mother” storytelling to tight cost control are poised to take share.

United Kingdom Lycopene Food Colors Sales Analysis

The UK market sits at a much smaller base-USD 7.5 million in 2025-and is forecast to reach only about USD 17.8 million by 2035, a steadier 9%CAGR. Two Novel Foods approvals for pomace-derived lycopene in 2024 prove the science is acceptable, and online channels already capture 14 percent of national sales. Yet retailers continue to push private-label naturals and cost-of-living pressures are keeping price-elastic shoppers cautious. Clean-label sentiment is solid (64 percent), but velocity will hinge on brands positioning lycopene as a functional upgrade rather than a premium décor ingredient.

Lycopene Food Colors Industry Analysis in Germany

Germany’s demand-USD 9.2 million in 2025-should climb to roughly USD 24.3 million by 2035, translating into a 10.2 percent compound rate. EFSA’s rigorous oversight keeps safety barriers high, but it also grants credibility that helps lycopene migrate into nutraceutical powders and cosmetics. Producers are experimenting with micro-encapsulation and pomace-extraction pilots to cut waste and boost heat stability, yet most remain at pilot scale. With 69 percent of German consumers favouring natural colours, the real unlock will be proving lycopene’s functional benefits beyond hue-think antioxidant positioning in gummies or beauty-from-within shots.

Japan Food Colors Market

Japan starts at USD 6.8 million in 2025 and is projected to reach about USD 18.5 million by 2035, a 10.5% CAGR that balances demographic headwinds against innovation tail-winds. Two PMDA approvals for novel lycopene formulations in 2024 have energised R&D, and e-commerce already accounts for 11 percent of national lycopene-colour turnover.

Extraction and processing still absorb 24 percent of production spend while stability losses bite another 7 percent, so suppliers are exploring beadlet formats and electrolyte-fortified “beauty vinegar” drinks to justify a margin premium. Roughly 66%of Japanese consumers report a clean-label bias-enough to sustain double-digit growth if brands keep pushing functional cross-overs into RTD tonics and on-the-go gummies.

Competitive Landscape: Lycopene Food Colors Market (2025 to 2035)

The lycopene food colors market is moderately consolidated, with a handful of key players dominating global production and formulation. These players operate across the entire value chain from raw material sourcing (primarily tomato pomace) to extraction, formulation, and blending into food-grade solutions.

  • DSM-Firmenich - Strong patent portfolio, backward integration into carotenoid fermentation.
  • BASF SE - Active in synthetic and nature-identical lycopene; strong stability performance in emulsions.
  • DDW (a Kerry Company) - Focused on clean-label solutions; innovating with beadlet technologies.
  • LycoRed (IFF) - Pioneer in natural lycopene from tomato extract; broad application in dairy and beverage.
  • EID Parry - Specializing in tomato-derived lycopene, targeting Asia-Pacific and Middle East markets.

Competitive Moats

  • Formulation stability: Lycopene degrades under high heat and light. Players offering microencapsulation and beadlet tech (e.g., DSM, IFF) gain defensibility in bakery and dairy applications.
  • Raw material sourcing: Firms with long-term contracts for tomato pomace during seasonal gluts (e.g., EID Parry, LycoRed) can offset input volatility and reduce COGS.
  • Regulatory approvals: FDA GRAS notifications and EFSA clearance give multinational firms a stronghold in North America and Europe.

Emerging Entrants

Fermentation startups (e.g., using engineered Yarrowia lipolytica or E. coli) are entering the scene with synthetic biology-based lycopene. These players aim to offer purer, cheaper, and scalable alternatives-especially appealing to formulators chasing clean-label + precision control.

Substitution Threats

  • Carmine: Still more vibrant in red tone but faces backlash due to animal origin.
  • Beet and Black Carrot Anthocyanins: Cheaper but less stable in dairy (pH-sensitive, fade under heat).
  • Corn-based Anthocyanins (Amaize®): Gaining ground; avoids tomato price volatility.
  • Fermentation-derived “next-gen” reds: Could disrupt lycopene in 5-7 years with lower cost structures and consistent pigment intensity.

Market Dynamics

  • Pricing pressure is intensifying as lycopene transitions from a niche natural pigment to a broader clean-label alternative.
  • Innovation is shifting toward application-specific formats such as water-dispersible lycopene for beverages or stabilized beadlets for dairy and processed meats.
  • The Asia-Pacific market, while cost-sensitive, is emerging as a volume play, whereas North America and Europe demand high-stability, non-GMO, and allergen-free labels.

Key Companies

  • Chr. Hansen Holding A/S
  • Sensient Technologies Corporation
  • Archer Daniels Midland Company (ADM)
  • DDW The Color House
  • Naturex (Givaudan)
  • Kalsec Inc.
  • BASF SE
  • Royal DSM
  • LycoRed Ltd.
  • San-Ei Gen F.F.I., Inc.

Report Scope: Lycopene Food Colors Market (2025 to 2035)

Attribute Details
Market Size (2025) USD 114 million
Market Size (2035) USD 314.9 million
CAGR (2025 to 2035) 10.7%
Base Year 2024
Historical Data 2020 to 2024
Forecast Period 2025 to 2035
Report Coverage Market size, growth rate, segmentation, competitive landscape, regulatory trends, and innovation pipeline
Units USD Million
Segments Covered Nature, Application, Form, Region
By Nature Conventional, Organic
By Application Confectionery and Bakery Products, Beverages, Packaged/Frozen Food, Dairy Food Products, Cosmetics, Dietary Supplements, Others
By Form Powder, Capsule, Syrup
By Region North America, Latin America, Western Europe, Eastern Europe, Balkans & Baltic, Russia & Belarus, Central Asia, East Asia, South Asia & Pacific, Middle East & Africa
Top Countries Covered United States, United Kingdom, Germany, Japan
Key Companies Profiled DSM-Firmenich, BASF SE, DDW (Kerry Group), LycoRed (IFF), EID Parry
Data Sources FMI primary surveys, secondary research, FDA/EFSA filings, industry reports
Output Format PDF, Excel Sheet, Dashboard (on request)

Key Segments

By Nature:

As per nature, the industry has been categorized into Organic and Conventional.

By Application:

As per Application, the industry has been categorized into Confectionery and Bakery Products, Beverages, Packaged Food/Frozen Products, Dairy Food Products, Cosmetics, Dietary supplements and Others.

By Form:

This segment is further categorized into Powder, Capsule and Syrup.

By Region:

Industry analysis has been carried out in key countries of North America, Latin America, Europe, East Asia, South Asia, Oceania, and the Middle East & Africa.

Table of Content

  1. Executive Summary
    • Global Market Outlook
    • Demand-side Trends
    • Supply-side Trends
    • Technology Roadmap Analysis
    • Analysis and Recommendations
  2. Market Overview
    • Market Coverage / Taxonomy
    • Market Definition / Scope / Limitations
  3. Market Background
    • Market Dynamics
      • Drivers
      • Restraints
      • Opportunity
      • Trends
    • Scenario Forecast
      • Demand in Optimistic Scenario
      • Demand in Likely Scenario
      • Demand in Conservative Scenario
    • Opportunity Map Analysis
    • Product Life Cycle Analysis
    • Supply Chain Analysis
      • Supply Side Participants and their Roles
        • Producers
        • Mid-Level Participants (Traders/ Agents/ Brokers)
        • Wholesalers and Distributors
      • Value Added and Value Created at Node in the Supply Chain
      • List of Raw Material Suppliers
      • List of Existing and Potential Buyer’s
    • Investment Feasibility Matrix
    • Value Chain Analysis
      • Profit Margin Analysis
      • Wholesalers and Distributors
      • Retailers
    • PESTLE and Porter’s Analysis
    • Regulatory Landscape
      • By Key Regions
      • By Key Countries
    • Regional Parent Market Outlook
    • Production and Consumption Statistics
    • Import and Export Statistics
  4. Global Market Analysis 2020 to 2024 and Forecast, 2025 to 2035
    • Historical Market Size Value (USD Million) & Volume (Metric Tons) Analysis, 2020 to 2024
    • Current and Future Market Size Value (USD Million) & Volume (Metric Tons) Projections, 2025 to 2035
      • Y-o-Y Growth Trend Analysis
      • Absolute $ Opportunity Analysis
  5. Global Market Pricing Analysis 2020 to 2024 and Forecast 2025 to 2035
  6. Global Market Analysis 2020 to 2024 and Forecast 2025 to 2035, By Nature
    • Introduction / Key Findings
    • Historical Market Size Value (USD Million) & Volume (Metric Tons) Analysis By Nature, 2020 to 2024
    • Current and Future Market Size Value (USD Million) & Volume (Metric Tons) Analysis and Forecast By Nature, 2025 to 2035
      • Organic
      • Conventional
    • Y-o-Y Growth Trend Analysis By Nature, 2020 to 2024
    • Absolute $ Opportunity Analysis By Nature, 2025 to 2035
  7. Global Market Analysis 2020 to 2024 and Forecast 2025 to 2035, By Application
    • Introduction / Key Findings
    • Historical Market Size Value (USD Million) & Volume (Metric Tons) Analysis By Application, 2020 to 2024
    • Current and Future Market Size Value (USD Million) & Volume (Metric Tons) Analysis and Forecast By Application, 2025 to 2035
      • Confectionery and Bakery Products
      • Beverages
      • Packaged Food/Frozen Products
      • Dairy Food Products
      • Cosmetics
      • Dietary Supplements
      • Others
    • Y-o-Y Growth Trend Analysis By Application, 2020 to 2024
    • Absolute $ Opportunity Analysis By Application, 2025 to 2035
  8. Global Market Analysis 2020 to 2024 and Forecast 2025 to 2035, By Form
    • Introduction / Key Findings
    • Historical Market Size Value (USD Million) & Volume (Metric Tons) Analysis By Form, 2020 to 2024
    • Current and Future Market Size Value (USD Million) & Volume (Metric Tons) Analysis and Forecast By Form, 2025 to 2035
      • Powder
      • Capsule
      • Syrup
    • Y-o-Y Growth Trend Analysis By Form, 2020 to 2024
    • Absolute $ Opportunity Analysis By Form, 2025 to 2035
  9. Global Market Analysis 2020 to 2024 and Forecast 2025 to 2035, By Region
    • Introduction
    • Historical Market Size Value (USD Million) & Volume (Metric Tons) Analysis By Region, 2020 to 2024
    • Current Market Size Value (USD Million) & Volume (Metric Tons) Analysis and Forecast By Region, 2025 to 2035
      • North America
      • Latin America
      • Western Europe
      • Eastern Europe
      • East Asia
      • South Asia & Pacific
      • Middle East and Africa
    • Market Attractiveness Analysis By Region
  10. North America Market Analysis 2020 to 2024 and Forecast 2025 to 2035, By Country
    • Historical Market Size Value (USD Million) & Volume (Metric Tons) Trend Analysis By Market Taxonomy, 2020 to 2024
    • Market Size Value (USD Million) & Volume (Metric Tons) Forecast By Market Taxonomy, 2025 to 2035
      • By Country
        • USA
        • Canada
        • Mexico
      • By Nature
      • By Application
      • By Form
    • Market Attractiveness Analysis
      • By Country
      • By Nature
      • By Application
      • By Form
    • Key Takeaways
  11. Latin America Market Analysis 2020 to 2024 and Forecast 2025 to 2035, By Country
    • Historical Market Size Value (USD Million) & Volume (Metric Tons) Trend Analysis By Market Taxonomy, 2020 to 2024
    • Market Size Value (USD Million) & Volume (Metric Tons) Forecast By Market Taxonomy, 2025 to 2035
      • By Country
        • Brazil
        • Argentina
        • Rest of LATAM
      • By Nature
      • By Application
      • By Form
    • Market Attractiveness Analysis
      • By Country
      • By Nature
      • By Application
      • By Form
    • Key Takeaways
  12. Western Europe Market Analysis 2020 to 2024 and Forecast 2025 to 2035, By Country
    • Historical Market Size Value (USD Million) & Volume (Metric Tons) Trend Analysis By Market Taxonomy, 2020 to 2024
    • Market Size Value (USD Million) & Volume (Metric Tons) Forecast By Market Taxonomy, 2025 to 2035
      • By Country
        • Germany
        • Italy
        • France
        • UK
        • Spain
        • BENELUX
        • Nordic
        • Rest of W.Europe
      • By Nature
      • By Application
      • By Form
    • Market Attractiveness Analysis
      • By Country
      • By Nature
      • By Application
      • By Form
    • Key Takeaways
  13. Eastern Europe Market Analysis 2020 to 2024 and Forecast 2025 to 2035, By Country
    • Historical Market Size Value (USD Million) & Volume (Metric Tons) Trend Analysis By Market Taxonomy, 2020 to 2024
    • Market Size Value (USD Million) & Volume (Metric Tons) Forecast By Market Taxonomy, 2025 to 2035
      • By Country
        • Russia
        • Hungary
        • Poland
        • Balkan & Baltics
        • Rest of E. Europe
      • By Nature
      • By Application
      • By Form
    • Market Attractiveness Analysis
      • By Country
      • By Nature
      • By Application
      • By Form
    • Key Takeaways
  14. East Asia Market Analysis 2020 to 2024 and Forecast 2025 to 2035, By Country
    • Historical Market Size Value (USD Million) & Volume (Metric Tons) Trend Analysis By Market Taxonomy, 2020 to 2024
    • Market Size Value (USD Million) & Volume (Metric Tons) Forecast By Market Taxonomy, 2025 to 2035
      • By Country
        • China
        • Japan
        • South Korea
      • By Nature
      • By Application
      • By Form
    • Market Attractiveness Analysis
      • By Country
      • By Nature
      • By Application
      • By Form
    • Key Takeaways
  15. South Asia & Pacific Market Analysis 2020 to 2024 and Forecast 2025 to 2035, By Country
    • Historical Market Size Value (USD Million) & Volume (Metric Tons) Trend Analysis By Market Taxonomy, 2020 to 2024
    • Market Size Value (USD Million) & Volume (Metric Tons) Forecast By Market Taxonomy, 2025 to 2035
      • By Country
        • India
        • Australia & New Zealand
        • ASEAN
        • Rest of SAP
      • By Nature
      • By Application
      • By Form
    • Market Attractiveness Analysis
      • By Country
      • By Nature
      • By Application
      • By Form
    • Key Takeaways
  16. Middle East and Africa Market Analysis 2020 to 2024 and Forecast 2025 to 2035, By Country
    • Historical Market Size Value (USD Million) & Volume (Metric Tons) Trend Analysis By Market Taxonomy, 2020 to 2024
    • Market Size Value (USD Million) & Volume (Metric Tons) Forecast By Market Taxonomy, 2025 to 2035
      • By Country
        • GCC Countries
        • Northern Africa
        • South Africa
        • Turkiye
        • Rest of MEA
      • By Nature
      • By Application
      • By Form
    • Market Attractiveness Analysis
      • By Country
      • By Nature
      • By Application
      • By Form
    • Key Takeaways
  17. Key Countries Market Analysis
    • USA
      • Pricing Analysis
      • Market Share Analysis, 2024
        • By Nature
        • By Application
        • By Form
    • Canada
      • Pricing Analysis
      • Market Share Analysis, 2024
        • By Nature
        • By Application
        • By Form
    • Brazil
      • Pricing Analysis
      • Market Share Analysis, 2024
        • By Nature
        • By Application
        • By Form
    • Mexico
      • Pricing Analysis
      • Market Share Analysis, 2024
        • By Nature
        • By Application
        • By Form
    • Argentina
      • Pricing Analysis
      • Market Share Analysis, 2024
        • By Nature
        • By Application
        • By Form
  18. Market Structure Analysis
    • Competition Dashboard
    • Competition Benchmarking
    • Market Share Analysis of Top Players
      • By Regional
      • By Nature
      • By Application
      • By Form
  19. Competition Analysis
    • Competition Deep Dive
      • San-Ei Gen
        • Overview
        • Product Portfolio
        • Profitability by Market Segments (Product/Age /Sales Channel/Region)
        • Sales Footprint
        • Strategy Overview
          • Marketing Strategy
          • Product Strategy
          • Channel Strategy
      • Licofarma S.r.l.
        • Overview
        • Product Portfolio
        • Profitability by Market Segments (Product/Age /Sales Channel/Region)
        • Sales Footprint
        • Strategy Overview
          • Marketing Strategy
          • Product Strategy
          • Channel Strategy
      • Dangshan Sinojuice Food
        • Overview
        • Product Portfolio
        • Profitability by Market Segments (Product/Age /Sales Channel/Region)
        • Sales Footprint
        • Strategy Overview
          • Marketing Strategy
          • Product Strategy
          • Channel Strategy
      • DSM
        • Overview
        • Product Portfolio
        • Profitability by Market Segments (Product/Age /Sales Channel/Region)
        • Sales Footprint
        • Strategy Overview
          • Marketing Strategy
          • Product Strategy
          • Channel Strategy
      • BASF
        • Overview
        • Product Portfolio
        • Profitability by Market Segments (Product/Age /Sales Channel/Region)
        • Sales Footprint
        • Strategy Overview
          • Marketing Strategy
          • Product Strategy
          • Channel Strategy
      • Kagome
        • Overview
        • Product Portfolio
        • Profitability by Market Segments (Product/Age /Sales Channel/Region)
        • Sales Footprint
        • Strategy Overview
          • Marketing Strategy
          • Product Strategy
          • Channel Strategy
      • Xi'an Lyphar Biotech Corp.
        • Overview
        • Product Portfolio
        • Profitability by Market Segments (Product/Age /Sales Channel/Region)
        • Sales Footprint
        • Strategy Overview
          • Marketing Strategy
          • Product Strategy
          • Channel Strategy
      • Chr. Hansen
        • Overview
        • Product Portfolio
        • Profitability by Market Segments (Product/Age /Sales Channel/Region)
        • Sales Footprint
        • Strategy Overview
          • Marketing Strategy
          • Product Strategy
          • Channel Strategy
      • Koninklijke DSM N.V.
        • Overview
        • Product Portfolio
        • Profitability by Market Segments (Product/Age /Sales Channel/Region)
        • Sales Footprint
        • Strategy Overview
          • Marketing Strategy
          • Product Strategy
          • Channel Strategy
      • Hoffmann-La Roche Ltd.
        • Overview
        • Product Portfolio
        • Profitability by Market Segments (Product/Age /Sales Channel/Region)
        • Sales Footprint
        • Strategy Overview
          • Marketing Strategy
          • Product Strategy
          • Channel Strategy
  20. Assumptions & Acronyms Used
  21. Research Methodology

List of Tables

  • Table 1: Global Market Value (USD Million) Forecast by Region, 2020 to 2035
  • Table 2: Global Market Volume (Metric Tons) Forecast by Region, 2020 to 2035
  • Table 3: Global Market Value (USD Million) Forecast by Nature, 2020 to 2035
  • Table 4: Global Market Volume (Metric Tons) Forecast by Nature, 2020 to 2035
  • Table 5: Global Market Value (USD Million) Forecast by Application, 2020 to 2035
  • Table 6: Global Market Volume (Metric Tons) Forecast by Application, 2020 to 2035
  • Table 7: Global Market Value (USD Million) Forecast by Form, 2020 to 2035
  • Table 8: Global Market Volume (Metric Tons) Forecast by Form, 2020 to 2035
  • Table 9: North America Market Value (USD Million) Forecast by Country, 2020 to 2035
  • Table 10: North America Market Volume (Metric Tons) Forecast by Country, 2020 to 2035
  • Table 11: North America Market Value (USD Million) Forecast by Nature, 2020 to 2035
  • Table 12: North America Market Volume (Metric Tons) Forecast by Nature, 2020 to 2035
  • Table 13: North America Market Value (USD Million) Forecast by Application, 2020 to 2035
  • Table 14: North America Market Volume (Metric Tons) Forecast by Application, 2020 to 2035
  • Table 15: North America Market Value (USD Million) Forecast by Form, 2020 to 2035
  • Table 16: North America Market Volume (Metric Tons) Forecast by Form, 2020 to 2035
  • Table 17: Latin America Market Value (USD Million) Forecast by Country, 2020 to 2035
  • Table 18: Latin America Market Volume (Metric Tons) Forecast by Country, 2020 to 2035
  • Table 19: Latin America Market Value (USD Million) Forecast by Nature, 2020 to 2035
  • Table 20: Latin America Market Volume (Metric Tons) Forecast by Nature, 2020 to 2035
  • Table 21: Latin America Market Value (USD Million) Forecast by Application, 2020 to 2035
  • Table 22: Latin America Market Volume (Metric Tons) Forecast by Application, 2020 to 2035
  • Table 23: Latin America Market Value (USD Million) Forecast by Form, 2020 to 2035
  • Table 24: Latin America Market Volume (Metric Tons) Forecast by Form, 2020 to 2035
  • Table 25: Western Europe Market Value (USD Million) Forecast by Country, 2020 to 2035
  • Table 26: Western Europe Market Volume (Metric Tons) Forecast by Country, 2020 to 2035
  • Table 27: Western Europe Market Value (USD Million) Forecast by Nature, 2020 to 2035
  • Table 28: Western Europe Market Volume (Metric Tons) Forecast by Nature, 2020 to 2035
  • Table 29: Western Europe Market Value (USD Million) Forecast by Application, 2020 to 2035
  • Table 30: Western Europe Market Volume (Metric Tons) Forecast by Application, 2020 to 2035
  • Table 31: Western Europe Market Value (USD Million) Forecast by Form, 2020 to 2035
  • Table 32: Western Europe Market Volume (Metric Tons) Forecast by Form, 2020 to 2035
  • Table 33: Eastern Europe Market Value (USD Million) Forecast by Country, 2020 to 2035
  • Table 34: Eastern Europe Market Volume (Metric Tons) Forecast by Country, 2020 to 2035
  • Table 35: Eastern Europe Market Value (USD Million) Forecast by Nature, 2020 to 2035
  • Table 36: Eastern Europe Market Volume (Metric Tons) Forecast by Nature, 2020 to 2035
  • Table 37: Eastern Europe Market Value (USD Million) Forecast by Application, 2020 to 2035
  • Table 38: Eastern Europe Market Volume (Metric Tons) Forecast by Application, 2020 to 2035
  • Table 39: Eastern Europe Market Value (USD Million) Forecast by Form, 2020 to 2035
  • Table 40: Eastern Europe Market Volume (Metric Tons) Forecast by Form, 2020 to 2035
  • Table 41: East Asia Market Value (USD Million) Forecast by Country, 2020 to 2035
  • Table 42: East Asia Market Volume (Metric Tons) Forecast by Country, 2020 to 2035
  • Table 43: East Asia Market Value (USD Million) Forecast by Nature, 2020 to 2035
  • Table 44: East Asia Market Volume (Metric Tons) Forecast by Nature, 2020 to 2035
  • Table 45: East Asia Market Value (USD Million) Forecast by Application, 2020 to 2035
  • Table 46: East Asia Market Volume (Metric Tons) Forecast by Application, 2020 to 2035
  • Table 47: East Asia Market Value (USD Million) Forecast by Form, 2020 to 2035
  • Table 48: East Asia Market Volume (Metric Tons) Forecast by Form, 2020 to 2035
  • Table 49: South Asia & Pacific Market Value (USD Million) Forecast by Country, 2020 to 2035
  • Table 50: South Asia & Pacific Market Volume (Metric Tons) Forecast by Country, 2020 to 2035
  • Table 51: South Asia & Pacific Market Value (USD Million) Forecast by Nature, 2020 to 2035
  • Table 52: South Asia & Pacific Market Volume (Metric Tons) Forecast by Nature, 2020 to 2035
  • Table 53: South Asia & Pacific Market Value (USD Million) Forecast by Application, 2020 to 2035
  • Table 54: South Asia & Pacific Market Volume (Metric Tons) Forecast by Application, 2020 to 2035
  • Table 55: South Asia & Pacific Market Value (USD Million) Forecast by Form, 2020 to 2035
  • Table 56: South Asia & Pacific Market Volume (Metric Tons) Forecast by Form, 2020 to 2035
  • Table 57: Middle East and Africa Market Value (USD Million) Forecast by Country, 2020 to 2035
  • Table 58: Middle East and Africa Market Volume (Metric Tons) Forecast by Country, 2020 to 2035
  • Table 59: Middle East and Africa Market Value (USD Million) Forecast by Nature, 2020 to 2035
  • Table 60: Middle East and Africa Market Volume (Metric Tons) Forecast by Nature, 2020 to 2035
  • Table 61: Middle East and Africa Market Value (USD Million) Forecast by Application, 2020 to 2035
  • Table 62: Middle East and Africa Market Volume (Metric Tons) Forecast by Application, 2020 to 2035
  • Table 63: Middle East and Africa Market Value (USD Million) Forecast by Form, 2020 to 2035
  • Table 64: Middle East and Africa Market Volume (Metric Tons) Forecast by Form, 2020 to 2035

List of Figures

  • Figure 1: Global Market Volume (Metric Tons) Forecast 2020 to 2035
  • Figure 2: Global Market Pricing Analysis
  • Figure 3: Global Market Value (USD Million) Forecast 2020 to 2035
  • Figure 4: Global Market Value Share and BPS Analysis by Nature, 2025 and 2035
  • Figure 5: Global Market Y-o-Y Growth Comparison by Nature, 2025 to 2035
  • Figure 6: Global Market Attractiveness Analysis by Nature
  • Figure 7: Global Market Value Share and BPS Analysis by Application, 2025 and 2035
  • Figure 8: Global Market Y-o-Y Growth Comparison by Application, 2025 to 2035
  • Figure 9: Global Market Attractiveness Analysis by Application
  • Figure 10: Global Market Value Share and BPS Analysis by Form, 2025 and 2035
  • Figure 11: Global Market Y-o-Y Growth Comparison by Form, 2025 to 2035
  • Figure 12: Global Market Attractiveness Analysis by Form
  • Figure 13: Global Market Value (USD Million) Share and BPS Analysis by Region, 2025 and 2035
  • Figure 14: Global Market Y-o-Y Growth Comparison by Region, 2025 to 2035
  • Figure 15: Global Market Attractiveness Analysis by Region
  • Figure 16: North America Market Incremental $ Opportunity, 2025 to 2035
  • Figure 17: Latin America Market Incremental $ Opportunity, 2025 to 2035
  • Figure 18: Western Europe Market Incremental $ Opportunity, 2025 to 2035
  • Figure 19: Eastern Europe Market Incremental $ Opportunity, 2025 to 2035
  • Figure 20: East Asia Market Incremental $ Opportunity, 2025 to 2035
  • Figure 21: South Asia & Pacific Market Incremental $ Opportunity, 2025 to 2035
  • Figure 22: Middle East and Africa Market Incremental $ Opportunity, 2025 to 2035
  • Figure 23: North America Market Value Share and BPS Analysis by Country, 2025 and 2035
  • Figure 24: North America Market Value Share and BPS Analysis by Nature, 2025 and 2035
  • Figure 25: North America Market Y-o-Y Growth Comparison by Nature, 2025 to 2035
  • Figure 26: North America Market Attractiveness Analysis by Nature
  • Figure 27: North America Market Value Share and BPS Analysis by Application, 2025 and 2035
  • Figure 28: North America Market Y-o-Y Growth Comparison by Application, 2025 to 2035
  • Figure 29: North America Market Attractiveness Analysis by Application
  • Figure 30: North America Market Value Share and BPS Analysis by Form, 2025 and 2035
  • Figure 31: North America Market Y-o-Y Growth Comparison by Form, 2025 to 2035
  • Figure 32: North America Market Attractiveness Analysis by Form
  • Figure 33: Latin America Market Value Share and BPS Analysis by Country, 2025 and 2035
  • Figure 34: Latin America Market Value Share and BPS Analysis by Nature, 2025 and 2035
  • Figure 35: Latin America Market Y-o-Y Growth Comparison by Nature, 2025 to 2035
  • Figure 36: Latin America Market Attractiveness Analysis by Nature
  • Figure 37: Latin America Market Value Share and BPS Analysis by Application, 2025 and 2035
  • Figure 38: Latin America Market Y-o-Y Growth Comparison by Application, 2025 to 2035
  • Figure 39: Latin America Market Attractiveness Analysis by Application
  • Figure 40: Latin America Market Value Share and BPS Analysis by Form, 2025 and 2035
  • Figure 41: Latin America Market Y-o-Y Growth Comparison by Form, 2025 to 2035
  • Figure 42: Latin America Market Attractiveness Analysis by Form
  • Figure 43: Western Europe Market Value Share and BPS Analysis by Country, 2025 and 2035
  • Figure 44: Western Europe Market Value Share and BPS Analysis by Nature, 2025 and 2035
  • Figure 45: Western Europe Market Y-o-Y Growth Comparison by Nature, 2025 to 2035
  • Figure 46: Western Europe Market Attractiveness Analysis by Nature
  • Figure 47: Western Europe Market Value Share and BPS Analysis by Application, 2025 and 2035
  • Figure 48: Western Europe Market Y-o-Y Growth Comparison by Application, 2025 to 2035
  • Figure 49: Western Europe Market Attractiveness Analysis by Application
  • Figure 50: Western Europe Market Value Share and BPS Analysis by Form, 2025 and 2035
  • Figure 51: Western Europe Market Y-o-Y Growth Comparison by Form, 2025 to 2035
  • Figure 52: Western Europe Market Attractiveness Analysis by Form
  • Figure 53: Eastern Europe Market Value Share and BPS Analysis by Country, 2025 and 2035
  • Figure 54: Eastern Europe Market Value Share and BPS Analysis by Nature, 2025 and 2035
  • Figure 55: Eastern Europe Market Y-o-Y Growth Comparison by Nature, 2025 to 2035
  • Figure 56: Eastern Europe Market Attractiveness Analysis by Nature
  • Figure 57: Eastern Europe Market Value Share and BPS Analysis by Application, 2025 and 2035
  • Figure 58: Eastern Europe Market Y-o-Y Growth Comparison by Application, 2025 to 2035
  • Figure 59: Eastern Europe Market Attractiveness Analysis by Application
  • Figure 60: Eastern Europe Market Value Share and BPS Analysis by Form, 2025 and 2035
  • Figure 61: Eastern Europe Market Y-o-Y Growth Comparison by Form, 2025 to 2035
  • Figure 62: Eastern Europe Market Attractiveness Analysis by Form
  • Figure 63: East Asia Market Value Share and BPS Analysis by Country, 2025 and 2035
  • Figure 64: East Asia Market Value Share and BPS Analysis by Nature, 2025 and 2035
  • Figure 65: East Asia Market Y-o-Y Growth Comparison by Nature, 2025 to 2035
  • Figure 66: East Asia Market Attractiveness Analysis by Nature
  • Figure 67: East Asia Market Value Share and BPS Analysis by Application, 2025 and 2035
  • Figure 68: East Asia Market Y-o-Y Growth Comparison by Application, 2025 to 2035
  • Figure 69: East Asia Market Attractiveness Analysis by Application
  • Figure 70: East Asia Market Value Share and BPS Analysis by Form, 2025 and 2035
  • Figure 71: East Asia Market Y-o-Y Growth Comparison by Form, 2025 to 2035
  • Figure 72: East Asia Market Attractiveness Analysis by Form
  • Figure 73: South Asia & Pacific Market Value Share and BPS Analysis by Country, 2025 and 2035
  • Figure 74: South Asia & Pacific Market Value Share and BPS Analysis by Nature, 2025 and 2035
  • Figure 75: South Asia & Pacific Market Y-o-Y Growth Comparison by Nature, 2025 to 2035
  • Figure 76: South Asia & Pacific Market Attractiveness Analysis by Nature
  • Figure 77: South Asia & Pacific Market Value Share and BPS Analysis by Application, 2025 and 2035
  • Figure 78: South Asia & Pacific Market Y-o-Y Growth Comparison by Application, 2025 to 2035
  • Figure 79: South Asia & Pacific Market Attractiveness Analysis by Application
  • Figure 80: South Asia & Pacific Market Value Share and BPS Analysis by Form, 2025 and 2035
  • Figure 81: South Asia & Pacific Market Y-o-Y Growth Comparison by Form, 2025 to 2035
  • Figure 82: South Asia & Pacific Market Attractiveness Analysis by Form
  • Figure 83: Middle East and Africa Market Value Share and BPS Analysis by Country, 2025 and 2035
  • Figure 84: Middle East and Africa Market Value Share and BPS Analysis by Nature, 2025 and 2035
  • Figure 85: Middle East and Africa Market Y-o-Y Growth Comparison by Nature, 2025 to 2035
  • Figure 86: Middle East and Africa Market Attractiveness Analysis by Nature
  • Figure 87: Middle East and Africa Market Value Share and BPS Analysis by Application, 2025 and 2035
  • Figure 88: Middle East and Africa Market Y-o-Y Growth Comparison by Application, 2025 to 2035
  • Figure 89: Middle East and Africa Market Attractiveness Analysis by Application
  • Figure 90: Middle East and Africa Market Value Share and BPS Analysis by Form, 2025 and 2035
  • Figure 91: Middle East and Africa Market Y-o-Y Growth Comparison by Form, 2025 to 2035
  • Figure 92: Middle East and Africa Market Attractiveness Analysis by Form
  • Figure 93: Global Market - Tier Structure Analysis
  • Figure 94: Global Market - Company Share Analysis

Frequently Asked Questions

What is the projected growth of the lycopene food colors market by 2035?

The lycopene food colors market is expected to reach USD 314.9 million by 2035, growing at a CAGR of 10.7%.

Which form dominates the lycopene food colors market in 2025?

Powder form leads the lycopene food colors market with a 42.3% share in 2025 due to its stability and ease of use.

Why is demand rising in the lycopene food colors market?

The lycopene food colors market is growing due to clean-label trends, regulatory bans on synthetic dyes, and consumer preference for natural ingredients.

Which application segment holds the largest share in the lycopene food colors market?

Beverages account for the largest application segment in the lycopene food colors market with a 40% revenue share in 2025.

Which region is the most lucrative in the lycopene food colors market?

North America dominates the lycopene food colors market, holding a 38.6% share in 2025, driven by strong clean-label demand.

Explore Similar Insights

Future Market Insights

Lycopene Food Colors Market