
- Market Size (2026)
- USD 177.8 Mn
- Forecast (2036)
- USD 306.6 Mn
- CAGR (2026 to 2036)
- 5.6%
How big is Lycopene Market in 2026?
The lycopene market demonstrated steady progress from USD 168.4 million in 2025 to USD 177.8 million in 2026, building toward a targeted valuation of USD 306.6 million by 2036 at a CAGR of 5.6%.
Commercial lycopene industry size registered USD 168.4 million during 2025 before stepping up to USD 177.8 million in 2026. FMI sector tracking reflects that long-term forecasts indicate that category valuation will attain USD 306.6 million in 2036, growing at a 5.6% annual pace across the 2026 through 2036 window and yielding USD 128.8 million in new value. Natural Non-GMO Tomato Oleoresin Extraction commands 58.4% of 2026 production source value, since nutraceutical and clean-label beverage buyers specify solvent-extracted Solanum lycopersicum concentrates standardized to 5% to 20% active carotenoid content. Demand for standardized lycopene is propelled by structural buyer-pool expansion as aging male cohorts purchase daily 10 to 15 mg prostate and vascular softgels while beverage makers replace synthetic Red 40 with E160d emulsions. Per a November 2025 prospective cohort study in BMC Medicine following 2,970 Mediterranean men aged 55 to 80 years, dietary lycopene intake above 4.9 mg per day reduced prostate cancer incidence at a hazard ratio of 0.36. That dual clinical-and-colorant base separates lycopene demand from the astaxanthin carotenoids category at a 9.3% CAGR, because microalgal astaxanthin serves premium aquaculture and niche antioxidants whereas lycopene spans mass food coloring and high-volume men's health supplements. Carotenoid manufacturers are expanding emulsion portfolios and standalone production units to serve that demand, as Lycored debuted three nature-based color emulsions at IFT FIRST in July 2025. Additionally, dsm-firmenich announced the separation of its Noviwest vitamins and carotenoids business in October 2026 while BASF reported EUR 16.4 billion in third-quarter 2026 results with rising Nutrition and Care volumes in October 2026. Supplement and beverage buyers renew supply contracts on verified oxygen-barrier microencapsulation that prevents polyene isomerization and color fading across 24-month shelf life through 2036.
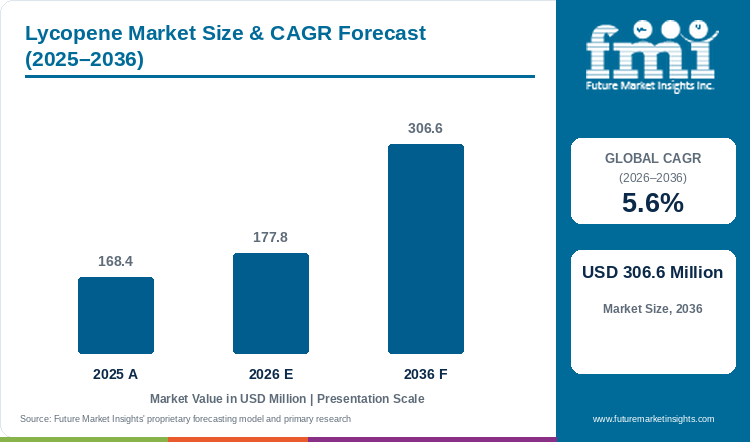
Key Market Trends & Insights
- By production source: Natural Non-GMO Tomato Oleoresin Extraction commands 58.4% of 2026 value because high-lycopene tomato varieties co-deliver complementary tocopherols and phytosterols.
- By formulation type: Cold-Water Dispersible Beadlets and Powders represent 52.5% in 2026 as hydrocolloid-encapsulated microcapsules survive tablet compression and aqueous beverage mixing.
- By application: Prostate and Cardiovascular with Skin Nutraceuticals hold 49.6% in 2026 as daily 10 to 30 mg clinical dosing anchors repeat supplement consumption.
- By food coloring role: Natural Red-Orange Food and Beverage Coloring E160d expands steadily as beverage and plant-based meat processors phase out synthetic Red 3 and Red 40 dyes.
- By nutricosmetic adoption: Oral and Topical Photoprotective Nutricosmetics gain share through beauty-from-within gummies and UV-protective serums.
Regional Highlights
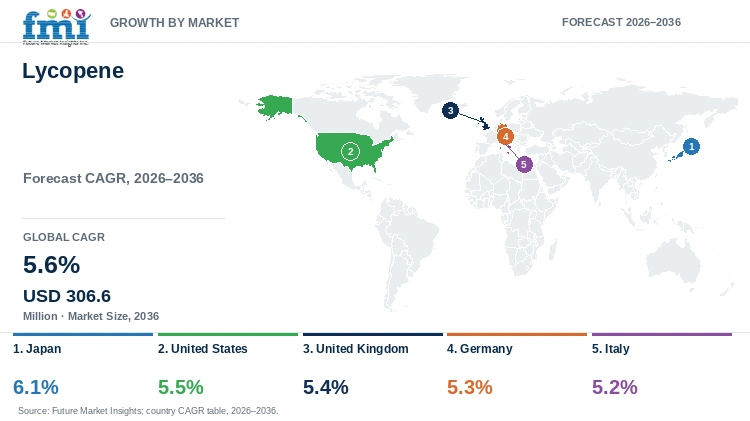
- Top national expansion: Japan tops national growth rankings with a 6.1% annual rate through 2036 under Foods with Function Claims vascular and skin carotenoid beverages.
- Broader country progression: United States demand expands by 5.5% per year ahead of the UK at 5.4% and Germany at 5.3%, while Italy progresses by 5.2% annually.
Market Size & Forecast
Table 1: Market Size and Forecast for the Lycopene Market (USD million and CAGR percentage), 2025 to 2036
| Metric | Value |
|---|---|
| 2025 Market Size | USD 168.4 million |
| Estimated Market Size in 2026 | USD 177.8 million |
| Projected Market Size by 2036 | USD 306.6 million |
| CAGR, 2026 to 2036 | 5.6% |
| Added Market Value, 2026 to 2036 | USD 128.8 million |
Unsaturated C40 lycopene molecules containing 11 conjugated double bonds undergo rapid auto-oxidation and cis-trans isomerization when exposed to light or heat in acidic beverage matrices without protective encapsulation. When supplement tableters or UHT beverage packers dose unstabilized tomato oleoresin, oxidative cleavage bleaches red chromophores and strips singlet-oxygen quenching potency. In February 2025, nutritional epidemiologists reporting in Frontiers in Nutrition analyzed 121 prospective cohort studies covering 108,574 cancer cases and confirmed that each 10 ug/dL increase in blood lycopene levels lowered overall cancer risk by 5% with an 11% reduction at high serum tiers. Accordingly, nutraceutical brands pair microencapsulated lycopene with carotenoid pigments to guarantee label-claim potency.
Standardized Oleoresin & Formulated Beadlet Volume Sizing
Table 2: Standardized Commercial Volume and Active-Equivalent Sizing for the Lycopene Market (USD million and operational ranges), 2025 to 2036
| Metric | 2025 | 2026 | 2036 |
|---|---|---|---|
| Market size (USD million) | 168.4 | 177.8 | 306.6 |
| Commercial formulated beadlet, powder & oil volume (metric tons) | 1,420 to 1,580 | 1,495 to 1,665 | 2,520 to 2,810 |
| 100% pure active lycopene equivalent tonnage (metric tons) | 135.0 to 152.0 | 142.5 to 160.0 | 242.0 to 272.0 |
| Average realized price per kg of formulated 5% to 20% product (USD/kg) | 106.5 to 118.6 | 106.8 to 118.9 | 109.1 to 121.7 |
Operational note: Commercial volume ranges reflect 5% to 20% standardized cold-water dispersible beadlets and spray-dried powders plus 6% to 15% tomato oleoresin oil suspensions.
Dietary supplement contract manufacturers and functional beverage bottlers require free-flowing carotenoid beadlets that compress into multi-vitamin tablets without oil squeezing or spot-staining. Global carotenoid formulators co-encapsulate lycopene with ascorbyl palmitate and dl-alpha-tocopherol plus beta-carotene formulations inside modified food starch or plant-gelatin shells.
Per Capita & Nutraceutical Line Valuation Sizing
Table 3: Per Capita and Production Line Valuation Indicators for the Lycopene Market (USD), 2025 to 2036
| Metric | 2025 | 2026 | 2036 |
|---|---|---|---|
| World population (billion) | 8.2 | 8.3 | 9.0 |
| Market value per 1,000 people (USD) | 20.5 | 21.4 | 34.1 |
| Annual valuation per qualified supplement & food plant (USD thousand) | 24.8 to 28.1 | 26.0 to 29.5 | 42.5 to 48.2 |
| Natural Non-GMO tomato & fungal fermentation share (%) | 78.5% to 80.2% | 80.8% | 84.5% to 87.0% |
Table 4: Industrial Formulation & Application Valuation Indicators for the Lycopene Market (USD and percentages), 2026
| Metric | Value | Institutional Reference Basis |
|---|---|---|
| Market size, 2026 | USD 177.8 million | 2026 global market value baseline |
| Qualified nutraceutical, food & cosmetic plants global | 6,450 plants | Softgel, tablet, beverage, dairy & skincare plants |
| Market value per qualified plant | USD 27,565.9 | Annualized lycopene ingredient procurement |
| Prostate, Cardiovascular & Skin Nutraceuticals value, 2026 | USD 88.2 million | 49.6% application allocation |
Intestinal micellization of crystalline all-trans lycopene requires dispersing sub-micron carotenoid droplets in dietary lipids or hydrocolloid delivery matrices. Formulators combine cold-water dispersible lycopene beadlets with lutein esters in daily men's multivitamins and cardiovascular support capsules.
Analyst Perspective
"Nutraceutical and clean-label beverage buyers do not evaluate lycopene on raw carotenoid assay alone. Instead, technical directors buy verified stability against oxidation during tablet compression and pasteurization plus clinical bioavailability in plasma. Suppliers that pair vertically integrated non-GMO tomato breeding or fungal fermentation with starch-matrix beadlet engineering capture recurring global supply contracts."
- Nandini Roy Choudhury, Principal Consultant, Future Market Insights.
How is the lycopene market segmented?
Industry segmentation for the lycopene market covers production source and formulation type with application and geographic region. For 2026, Natural Non-GMO Tomato Oleoresin Extraction commands 58.4% and Cold-Water Dispersible Beadlets and Powders capture 52.5%, while Prostate and Cardiovascular with Skin Nutraceuticals hold 49.6%.
By production source: Natural Non-GMO Tomato Oleoresin Extraction plus Blakeslea trispora Fungal Fermentation and Chemical Synthesis.
By formulation type: Cold-Water Dispersible Beadlets and Powders plus Oil Suspensions and Emulsions.
By application: Prostate and Cardiovascular with Skin Nutraceuticals plus Natural Red-Orange Food and Beverage Coloring E160d and Photoprotective Nutricosmetics.
By grade & concentration: 5% to 20% CWD Beadlets and Spray-Dried Powders plus 6% to 15% Oleoresin Oil Suspensions and Crystalline USP/FCC Grades.
By region: North America and Latin America with Western Europe and Eastern Europe plus East Asia and South Asia and Pacific with Middle East and Africa.
Why does Natural Non-GMO Tomato Oleoresin Extraction lead production sources?
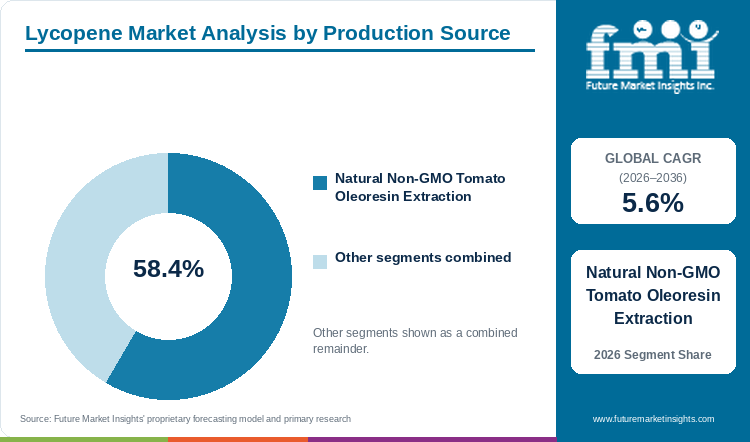
Natural Non-GMO Tomato Oleoresin Extraction commands 58.4% of 2026 production source value, anchored by clean-label consumer preference and full-spectrum tomato phytonutrients.
Table 5: Production Source Share for the Lycopene Market (percentage share), 2026
| Production Source | Share (2026) |
|---|---|
| Natural Non-GMO Tomato Oleoresin Extraction | 58.4% |
| Blakeslea trispora Fungal Fermentation and Chemical Synthesis | 41.6%* |
| Total | 100.0% |
*Note: Blakeslea trispora fungal fermentation and chemical synthesis represent the other 41.6% of 2026 global lycopene source valuation.
Table 6: Production Source Leadership and Market Growth for the Lycopene Market (segment and CAGR percentage), 2026 to 2036
| Metric | Value |
|---|---|
| Global CAGR (2026 to 2036) | 5.6% |
| Leading Segment | Natural Non-GMO Tomato Oleoresin Extraction |
Ethyl acetate extraction of non-GMO high-lycopene tomato pulp yields a standardized red-to-dark-brown oleoresin rich in all-trans lycopene with naturally occurring phytoene and phytofluene plus beta-carotene and tocopherols. Supplement and food manufacturers sourcing lycopene food colors favor botanical tomato extracts because US FDA 21 CFR 73.585 and European E160d regulations authorize solvent-extracted tomato lycopene without synthetic chemical carrier warnings.
- Natural Non-GMO Tomato Oleoresin Extraction commands 58.4% of 2026 source valuation because botanical tomato extracts carry premium positioning in dietary supplements and natural food colors.
- Under US FDA regulation 21 CFR 73.585 updated through October 2026, tomato lycopene extract must contain not less than 5.5% lycopene of oleoresin while tomato lycopene concentrate must contain not less than 60% lycopene.
What sustains Cold-Water Dispersible Beadlets and Powders in formulation type?
Cold-Water Dispersible Beadlets and Powders represent 52.5% of the formulation type category in 2026, supported by compression durability and aqueous beverage clarity.
Hydrocolloid microencapsulation of hydrophobic lycopene inside modified food starch or acacia gum and plant-protein matrices converts water-insoluble carotenoid crystals into free-flowing CWD beadlets that disperse uniformly in cold beverages and survive high-speed rotary tablet presses. Formulators developing fortified gummies and effervescent powders with natural food colors rely on CWD beadlets to prevent neck-ringing in bottled drinks and oxidative degradation during storage.
- Cold-Water Dispersible Beadlets and Powders represent 52.5% of formulation type valuation in 2026 as beverage and tablet manufacturers standardize dry, oxygen-shielded delivery formats.
- An April 2026 study in Food Chemistry demonstrated that encapsulating lycopene with quercetin in a calcium-chelated gellan gum oil-in-water emulsion elevated intestinal lycopene bioaccessibility to 59.59% compared with 43.39% in unencapsulated oil.
How do Prostate and Cardiovascular with Skin Nutraceuticals lead applications?
Prostate and Cardiovascular with Skin Nutraceuticals command 49.6% of 2026 application valuation, supported by clinical evidence on endothelial function and benign prostatic hyperplasia.
Lycopene exhibits the highest singlet-oxygen quenching rate among dietary carotenoids and accumulates selectively in human prostate tissue and adrenal glands with vascular endothelium. Preventive healthcare brands formulating dietary supplements and men's 50-plus multivitamins include 6 to 30 mg of standardized lycopene per daily serving to support healthy blood pressure and LDL oxidation resistance with prostate cellular integrity.
- Prostate and Cardiovascular with Skin Nutraceuticals command 49.6% of 2026 application value because daily softgel and tablet regimens generate recurring high-margin active ingredient demand.
- A January 2026 umbrella review in Food and Function evaluating nine systematic reviews and meta-analyses confirmed with high GRADE certainty that daily intake of 5 to 30 mg of tomato-derived lycopene significantly lowers systolic blood pressure and improves cardiovascular risk profiles.
How does Natural Red-Orange Food and Beverage Coloring E160d expand food use?
Natural Red-Orange Food and Beverage Coloring E160d accounts for 31.8% of 2026 application demand, propelled by retail bans on synthetic Red 3 and Red 40 dyes.
Unlike anthocyanins that shift hue across pH changes or betanin that degrades under UHT thermal processing, stabilized lycopene emulsions maintain bright yellow-orange to deep ruby-red shades across pH 2.5 to 8.0 and pasteurization temperatures. Beverage and surimi processors with UHT dairy and vegan meat brands partner with food encapsulation matrices specialists to replace synthetic azo dyes without off-flavors.
- Natural Red-Orange Food and Beverage Coloring E160d commands 31.8% of 2026 application share as multinational food and beverage brands eliminate artificial red colorants.
- In October 2026, Oterra published its Color Trends 2026 study surveying 2,600 consumers across 13 countries and found that 70% of shoppers actively seek functional beverages and snacks where natural color reinforces heart-health and vitality claims.
Why do Blakeslea trispora Fermentation and Nutricosmetics gain secondary share?
Blakeslea trispora Fungal Fermentation and Anti-Photoaging Nutricosmetics capture growing clean-label and beauty-from-within demand through 2036.
Mated fermentation of the fungus Blakeslea trispora and emerging actinomycete strains produces high-purity all-trans lycopene biomass independent of seasonal tomato harvests or agricultural land constraints. Simultaneously, prestige skincare and nutricosmetic formulations brands incorporate bioavailable lycopene complexes into oral collagen gummies and topical sun-care serums to suppress UV-induced erythema and matrix metalloproteinase expression.
- Fungal fermentation and anti-photoaging nutricosmetics expand steadily through 2036 as fermentation yields rise and dermatological studies validate oral photoprotection.
- In January 2026, microbiologists reporting in Frontiers in Microbiology isolated Polymorphospora lycopeni strain A560 lacking the lycopene beta-cyclase crtY gene, achieving 201.44 mg/L fermentative lycopene production without chemical cyclase inhibitors required in Blakeslea trispora.
What are the drivers, restraints, and opportunities in the lycopene market?
In the lycopene market, preventive cardiovascular and prostate nutraceutical adoption with synthetic red dye replacement drives growth whereas EFSA combined dietary exposure ceilings and polyene oxidation sensitivity restrain dosing and nanoemulsion delivery systems enable higher bioavailability.
- Driver: Clinical confirmation of prostate and vascular endothelial protection with regulatory phase-outs of synthetic Red 3 and Red 40 dyes accelerates demand for tomato and fermented lycopene.
- Restraint: Combined background and additive exposure limits under EFSA 0.5 mg/kg bw/day ADI rules and rapid oxidative bleaching of unencapsulated polyene chains constrain unshielded food dosing.
- Opportunity: Commercial scale-up of cold-plasma protein-fibril emulsions and subcritical-water tomato peel valorization with oral photoprotective nutricosmetic gummies enables premium margin tiers.
Growth Analysis and Future Potential: Qualitative Demand Catalysts
Consumer migration toward clinically substantiated preventive supplements for healthy aging and men's urological wellness with UV skin resilience is expanding baseline procurement of standardized lycopene beadlets and softgel suspensions. Whereas early supplement buyers viewed lycopene solely as a single-indication prostate ingredient, multi-center clinical trials now link daily carotenoid intake to systemic endothelial dilation and dermal collagen preservation. Formulators developing prostate health supplements and beauty-from-within beverages combine tomato lycopene with rosemary carnosic acid or phytosterols and zinc to claim multi-pathway cellular defense. In May 2025, dermatology researchers reporting in Antioxidants demonstrated that oral and topical C40 carotenoids including lycopene suppress UV-induced reactive oxygen species by modulating MAPK and Nrf2 with NF-kappaB signaling pathways while stimulating dermal collagen and elastin synthesis.
Risk Assessment of the Lycopene Market: Operational and Formulation Friction
Regulatory scrutiny over combined dietary and supplemental carotenoid exposure in Europe plus label-claim potency deviations caused by oxidative degradation in poorly encapsulated supplements represents the primary operational friction in the lycopene market. In April 2026, the European Food Safety Authority published a comprehensive dietary exposure assessment in the EFSA Journal across five scenarios, finding that 95th-percentile combined exposure reached 2.52 mg/kg body weight per day in toddlers under maximum regulatory levels and that novel food supplements doubled background intake. Furthermore, in May 2026, analytical chemists at Poland's National Institute of Horticultural Research reported in Foods that HPLC testing of commercial lycopene dietary supplements revealed content deviations up to 70% from declared label claims with trace non-approved methomyl pesticide detection in unverified lots. Consequently, tier-one supplement brands enforce strict HPLC overage validation and pesticide-free tomato traceability.
Commercial Opportunity Analysis: Formulation Differentiation and Value-Add Formats
Ingredient producers capture substantial value by upcycling industrial tomato-peel pomace via green subcritical-water and supercritical-CO2 extraction while engineering self-emulsifying nanocarriers that multiply oral bioaccessibility. Conventional ethyl acetate extraction leaves crystalline lycopene with low aqueous solubility, requiring protective hydrocolloid or protein-fibril encapsulation to survive gastric transit. In May 2026, chemical engineers reporting in the Journal of Food Science developed a one-step microemulsion and subcritical-water process extracting tomato peel powder into 11 nm lycopene nanoemulsions with 86.19 mg/kg lycopene content and 77.8% antioxidant activity. Integration of circular-economy tomato peel extraction with high-stability cold-water dispersible beadlets enables suppliers to serve both cost-sensitive E160d beverage colorant tenders and premium USP nutraceutical contracts through 2036.
Lycopene Market by Country (2026 to 2036)
Country-level projections place Japan at the forefront of lycopene expansion with a 6.1% CAGR through 2036, ahead of the US at 5.5% and the UK at 5.4%. National growth rates across East Asian functional claim beverages and US men's health and synthetic-dye-free foods with European tomato-processing and supplement hubs reflect local regulatory claims and encapsulation capacity.
Table 7: Country CAGR and Primary Growth Levers for the Lycopene Market (CAGR percentage and operational drivers), 2026 to 2036
| Country | CAGR (2026 to 2036) | Primary Growth Lever |
|---|---|---|
| Japan | 6.1% | Foods with Function Claims (FFC) vascular, HDL, and UV skin-care tomato beverages and supplements |
| United States | 5.5% | 21 CFR 73.585 synthetic Red 3/Red 40 replacement and prostate/cardiovascular softgel demand |
| United Kingdom | 5.4% | Supermarket clean-label beverage coloring and pharmacy men's health and beauty-from-within gummies |
| Germany | 5.3% | Ludwigshafen carotenoid beadlet engineering and pharmacy-grade cardiovascular nutraceuticals |
| Italy | 5.2% | Mediterranean tomato-pomace oleoresin extraction across >55,000 food processors exceeding USD 85B |
Source: Future Market Insights analysis
Japan Lycopene Market Outlook (2026 to 2036)
Lycopene demand in Japan is set to climb at a category-leading 6.1% annual rate through 2036 because the Consumer Affairs Agency Foods with Function Claims framework permits explicit front-of-pack claims for lycopene on elevating HDL cholesterol and lowering blood pressure while protecting skin from ultraviolet redness. Unlike Western markets where lycopene is sold primarily in softgel capsules, domestic beverage and dairy manufacturers in Japan dose water-dispersible lycopene into daily functional RTD tomato drinks and beauty jellies. In August 2026, researchers at Kagome Diet and Well-Being Research Institute in Tochigi reported a meta-analysis in Nutrients confirming that continuous oral lycopene intake across 182 healthy adults improved vascular flow-mediated dilation by 1.36 percentage points at p equals 0.02.
Key takeaway: In Japan, Foods with Function Claims approvals for vascular and UV-skin benefits in RTD beverages are expected to power a 6.1% annual expansion rate.
United States Lycopene Market Outlook (2026 to 2036)
United States commercial demand for lycopene is forecast to rise by 5.5% annually from 2026 to 2036, propelled by state and federal phase-outs of synthetic Red 3 and Red 40 dyes with strong retail demand for prostate and heart supplements. Domestic beverage and plant-based meat processors in the US rely on 21 CFR 73.585 color-additive exemptions for tomato lycopene extract and concentrate to achieve heat-stable red hues under clean-label retail standards. In December 2025, clinical nutrition investigators at East Carolina University and the USDA ARS Children's Nutrition Research Center reported in BMC Nutrition (trial NCT07120035) that consuming 8,400 ug of daily lycopene for three weeks elevated plasma lycopene by 9.72 ug/dL and reduced seven systemic inflammatory cytokines.
Key takeaway: In the United States, synthetic red dye replacement under 21 CFR 73.585 and clinical anti-inflammatory supplement demand are anticipated to sustain 5.5% CAGR expansion.
United Kingdom Lycopene Market Outlook (2026 to 2036)
United Kingdom lycopene market valuation is projected to advance at a 5.4% annual pace between 2026 and 2036 across pharmacy-chain men's health softgels and oral nutricosmetic beauty gummies with natural E160d beverage and surimi colorants. Major UK grocery retailers enforce strict voluntary bans on the Southampton Six artificial food colors, compelling soft-drink and confectionery with chilled-sauce manufacturers to formulate with non-GMO tomato lycopene emulsions. In June 2026, pharmaceutical researchers reporting in Molecules analyzed commercial lycopene food supplements across European and Western markets, demonstrating how supercritical fluid extraction and nanoencapsulation overcome crystalline lycopene's low oral bioavailability and oxidative sensitivity. Domestic contract softgel and gummy packers specify 10% and 20% CWD starch-encapsulated beadlets for high-street wellness chains.
Key takeaway: In the United Kingdom, retail artificial-color bans and pharmacy nutricosmetic and prostate softgel lines are projected to underpin 5.4% annual growth.
Germany Lycopene Market Outlook (2026 to 2036)
Germany is projected to expand by 5.3% per year during the 2026 to 2036 forecast horizon as Europe's premier chemical and microencapsulation engineering hub manufactures synthetic and fungal-fermented with starch-encapsulated lycopene grades for continental supplement and food accounts. Consumers in Germany exhibit high per-capita demand for preventive cardiovascular and healthy-aging pharmacy supplements plus strict clean-label preferences in fruit preparations and dairy drinks. June 2025 trade data from the USDA Exporter Guide for Germany indicate that the country's 84 million consumers form the largest market in the European Union and imported USD 2.7 billion in agricultural and food-preparation products in 2024. Ludwigshafen-based BASF SE produces microencapsulated LycoVit beadlets and dispersions tailored to high-speed European tableting and beverage bottling lines.
Key takeaway: In Germany, domestic microencapsulation beadlet manufacturing and pharmacy cardiovascular supplement demand are forecast to drive 5.3% annual progression.
Italy Lycopene Market Outlook (2026 to 2036)
Italy registers a projected 5.2% annual growth rate through 2036 as the nation combines Europe's largest industrial tomato-processing basin in Emilia-Romagna and Apulia with a sophisticated domestic nutraceutical and dermo-cosmetic contract-manufacturing sector. Botanical extractors in Italy valorize high-lycopene tomato skins and seeds from paste and pelati canneries into standardized non-GMO tomato oleoresins for domestic softgel encapsulators and European E160d colorant blenders. April 2026 findings from the USDA Food Processing Ingredients Annual assessment on Italy show that the national food processing industry comprises more than 55,000 enterprises generating over USD 85 billion in production value while importing USD 1.4 billion in US food ingredients in 2025. Local nutricosmetic brands actively incorporate tomato oleoresin into oral sun-care supplements.
Key takeaway: In Italy, domestic tomato-byproduct oleoresin extraction and contract nutraceutical and sun-care manufacturing are forecast to anchor 5.2% CAGR growth.
Full report country CAGRs cover: North America; Latin America; Western Europe; Eastern Europe; East Asia; South Asia and Pacific; Middle East and Africa.
Who are the notable companies in the lycopene market?
Primary commercial participants in the lycopene market comprise Lycored Ltd. and DSM-Firmenich AG with BASF SE. Chr. Hansen Oterra A/S and Allied Biotech Corporation with Divi's Laboratories Limited also supply commercial carotenoid formulations.
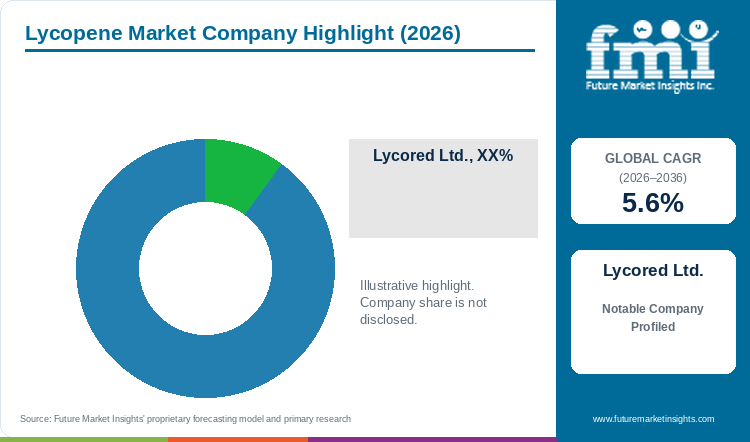
Market structure within the lycopene sector distinguishes vertically integrated non-GMO tomato oleoresin extractors and global microencapsulation leaders from specialty natural-color and API carotenoid manufacturers. Lycored Ltd. leads vertically integrated tomato breeding and oleoresin extraction with clinical Lycomato and Lumenato nutraceuticals. DSM-Firmenich AG and BASF SE with Allied Biotech Corporation and Divi's Laboratories Limited engineer microencapsulated CWD beadlets and fungal-fermented grades, whereas Chr. Hansen Oterra A/S specializes in clean-label food and beverage color emulsions.
- Vertically Integrated Tomato Oleoresin and Clinical Nutraceutical Leaders: Lycored Ltd. manages proprietary high-lycopene tomato breeding and solvent extraction with clinically studied Lycomato and superstable color emulsions.
- Global Microencapsulation and Carotenoid Producers: DSM-Firmenich AG (Noviwest) and BASF SE manufacture Redivivo and LycoVit cold-water dispersible beadlets and emulsions with Blakeslea trispora fermented grades.
- Specialty Carotenoid API and Natural Color Formulators: Chr. Hansen Oterra A/S and Allied Biotech Corporation (Altratene) with Divi's Laboratories Limited supply E160d food colorants and high-purity nutraceutical powders.
Competitive Benchmarking: Lycopene Market
Table 8: Competitive Benchmarking for the Lycopene Market (qualitative capability ratings), 2026
| Company | Natural Tomato & Fermentation Sourcing | CWD Beadlet Microencapsulation | Clinical & E160d Color Support | Geographic Reach |
|---|---|---|---|---|
| Lycored Ltd. | High | High | High | Israel, USA, Europe, and global tomato breeding, Lycomato, and IFT color emulsions |
| DSM-Firmenich AG | High | High | High | Switzerland, Europe, and global Redivivo and VibeLy carotenoid beadlets (Noviwest) |
| BASF SE | Medium | High | High | Germany and global LycoVit CWD powders, dispersions, and tablet beadlets |
| Chr. Hansen Oterra A/S | High | Medium | High | Denmark, Europe, Americas, and Asia-Pacific FruitMax and E160d natural colors |
| Allied Biotech Corporation | Medium | High | Medium | Taiwan, Europe, and global Altratene carotenoid powders, beadlets, and suspensions |
| Divi's Laboratories Limited | Medium | High | Medium | India and global cGMP carotenoid beadlets and nutraceutical active ingredients |
Scoring basis: Natural Tomato & Fermentation Sourcing evaluates vertically integrated Solanum lycopersicum extraction or Blakeslea trispora fermentation, whereas CWD Beadlet Microencapsulation rates oxygen-barrier starch and protein-matrix engineering. Clinical & E160d Color Support measures human bioavailability trials and beverage thermal/light color stability.
Key Developments in the Lycopene Market
- Lycored Ltd. celebrated its 30-year anniversary at IFT FIRST in Chicago on July 14, 2025 by launching three superstable nature-based color emulsions and expanded its VAS delivery technology in October 2025.
- dsm-firmenich reported EUR 4,664 million in H1 2026 continuing-operations net results in July 2026 and announced in October 2026 that its standalone vitamins and carotenoids company will operate as Noviwest.
- BASF SE reported EUR 16.4 billion in Q3 2026 group results with strong Nutrition and Care volume gains in October 2026, while Oterra published its 13-country Color Trends 2026 functional color research in October 2026.
Key Players in the Lycopene Market
Vertically Integrated Tomato Oleoresin and Clinical Nutraceutical Leaders
- Lycored Ltd.
Global Microencapsulation and Carotenoid Producers
- DSM-Firmenich AG
- BASF SE
Specialty Carotenoid API and Natural Color Formulators
- Chr. Hansen Oterra A/S
- Allied Biotech Corporation
- Divi's Laboratories Limited
Lycopene Market - Report Scope
Table 9: Report Scope for the Lycopene Market (coverage fields and definitions), 2026 to 2036
| Coverage field | Report scope |
|---|---|
| Market breakdown | Production Source; Formulation Type; Application; Region |
| Quantitative Units | USD Million |
| Market Definition | Includes commercial B2B supplier valuation from standardized lycopene ingredients (CAS 502-65-8, E160d, INS 160d, 21 CFR 73.585) produced via natural non-GMO tomato oleoresin extraction, Blakeslea trispora or microbial fermentation, and chemical synthesis across cold-water dispersible (CWD) beadlets, spray-dried powders, and oil suspensions/emulsions. Category Scope Note: Excludes commodity culinary tomato paste, ketchup, and unstandardized culinary tomato powders. |
| Regions Covered | North America; Latin America; Western Europe; Eastern Europe; East Asia; South Asia and Pacific; Middle East and Africa |
| Countries Covered | Japan, United States, United Kingdom, Germany, Italy, and additional countries in the full report |
| Key Companies Covered | Lycored Ltd., DSM-Firmenich AG, BASF SE, Chr. Hansen Oterra A/S, Allied Biotech Corporation, Divi's Laboratories Limited |
| Forecast Period | 2026 to 2036 |
| Approach | Primary and secondary research with top-down and bottom-up market triangulation. |
Lycopene Market - Research Methodology
Table 10: Research Methodology for the Lycopene Market (research methods and approach), 2026 edition
| Method | Approach |
|---|---|
| Primary Research | Structured interviews with Mediterranean and Californian tomato oleoresin extractors, carotenoid microencapsulation R&D directors, supplement softgel/tablet formulators, and beverage colorant chemists to validate active assay tiers and CWD beadlet pricing. |
| Secondary Research | Analysis of EFSA Journal (April 2026) dietary lycopene exposure assessments, US FDA 21 CFR 73.585 color additive specifications, USDA FAS Food Processing Ingredients and Exporter Guide reports, PubMed clinical cohorts, and corporate financial releases. |
| Market Sizing and Forecasting | Top-down parent carotenoids and natural food color baselines reconciled against bottom-up formulated CWD beadlet, powder, and oil suspension tonnage (1,495 to 1,665 MT in 2026, equivalent to 142.5 to 160.0 MT pure active lycopene) from 2026 to 2036. |
| Country Forecasting Model | Econometric national projections weight Japan FFC functional beverage registrations, US synthetic red dye replacement, European E160d beverage reformulation, and preventive men's health supplement consumption across five focal countries. |
| Operational Benchmark Traceability | Formulated tonnage, active-equivalent volume, and plant valuation indicators in Tables 2, 3, and 4 trace to 21 CFR 73.585 (>=5.5% and >=60% oleoresin specs), EFSA mg/kg bw/day exposure models, and BMC Medicine clinical dosing thresholds. |
| Data Triangulation and Validation | Valuation estimates isolate standardized 5% to 20% CWD beadlets/powders, 6% to 15% oleoresin suspensions, and crystalline lycopene while strictly excluding bulk culinary tomato paste and other carotenoids. |
Lycopene Market by Segments
Lycopene Market segmented by Production Source:
- Natural Non-GMO Tomato Oleoresin Extraction
- Blakeslea trispora Fungal Fermentation
- Chemical Synthesis
Lycopene Market segmented by Formulation Type:
- Cold-Water Dispersible Beadlets and Powders
- Oil Suspensions and Emulsions
Lycopene Market segmented by Application:
- Prostate, Cardiovascular, and Skin Nutraceuticals
- Natural Red-Orange Food and Beverage Coloring E160d
- Anti-Photoaging Cosmetics and Nutricosmetics
Lycopene Market by Region
- North America
- United States
- Canada
- Latin America
- Brazil
- Mexico
- Argentina
- Chile
- Western Europe
- Germany
- France
- United Kingdom
- Italy
- Spain
- Benelux
- Nordics
- Eastern Europe
- Poland
- Czech Republic
- Romania
- Hungary
- East Asia
- China
- Japan
- South Korea
- South Asia and Pacific
- India
- ASEAN
- Australia and New Zealand
- Middle East and Africa
- GCC Countries
- South Africa
- Türkiye
- Israel
Research Sources and Bibliography
- [1] Lopez-Solis, R., Castro-Barquero, S., Donat-Vargas, C., Corrado, M., Arancibia-Riveros, C., Martinez-Gonzalez, M. A., Salas-Salvado, J., Sorli, J. V., Serra-Majem, L., Fito, M., Pinto, X., Fiol, M., Lapetra, J., Gomez-Gracia, E., Toledo, E., Ramirez-Sabio, J. B., Babio, N., Estruch, R., Ros, E., & Lamuela-Raventos, R. M. (2025, November 10). Lycopene intake and prostate cancer risk in men at high cardiovascular risk: a prospective cohort study. BMC Medicine, 23(1), 627 (PubMed PMID 41214650).
- [2] European Food Safety Authority (EFSA), Dujardin, B., Horvath, Z., & Tard, A. (2026, April 9). Dietary exposure to lycopene from background diet, novel foods and food additive use in the European population. EFSA Journal, 24(4), e9994 (PubMed PMID 41972196).
- [3] Lycored Ltd. (2025, July 14). Lycored Celebrates 30 Years of Beautiful Discoveries, Showcasing Expanded Portfolio of Nature-Based Colors at IFT. Lycored Ltd. Press Releases.
- [4] dsm-firmenich AG. (2026, October 22). dsm-firmenich Animal Nutrition & Health prepares for future as two focused companies: Noviwest and Panavora. dsm-firmenich AG Press Releases.
- [5] BASF SE. (2026, October 28). Strength across all core businesses drives BASF Group's considerable growth in EBITDA before special items in Q3 2026. BASF SE Media News Releases.
- [6] Balali, A., Fathzadeh, K., Askari, G., & Sadeghi, O. (2025, February 12). Dietary intake of tomato and lycopene, blood levels of lycopene, and risk of total and specific cancers in adults: a systematic review and dose-response meta-analysis of prospective cohort studies. Frontiers in Nutrition, 12, 1516048 (PubMed PMID 40013157).
- [7] U.S. Food and Drug Administration. (2026, October 22). 21 CFR 73.585 Tomato lycopene extract; tomato lycopene concentrate. Electronic Code of Federal Regulations.
- [8] Zhou, X., Zhu, M., Cheng, X., Liu, R., Zhang, W., Zhang, F., Guo, N., & Zhu, G. (2026, April 15). Enhancing antioxidant activity and bioaccessibility of lycopene and quercetin via synergistic co-delivery in gellan gum-stabilized oil-in-water emulsion. Food Chemistry, 508(Pt B), 148394 (PubMed PMID 41713337).
- [9] Nam, Y. E., Hwang, I. G., & Jang, H. H. (2026, January 26). Role of lycopene from tomato on cardiovascular risk: an umbrella review of systematic reviews and meta-analyses of intervention studies. Food & Function, 17(2), 622-630 (PubMed PMID 41369612).
- [10] Soo, C. (2026, October 22). Asia Pacific Food Trends Driving the Future of Color Innovation: How authenticity, exports and function are reshaping color innovation. Oterra A/S Articles and Insights.
- [11] Duan, X., Li, S., Li, Y., Yang, Z., & Zhang, X. (2026, January 22). Polymorphospora lycopeni A560, a new strain capable of producing lycopene, and its optimal fermentation and extraction conditions. Frontiers in Microbiology, 16, 1723758 (PubMed PMID 41657988).
- [12] Ma, Y., Li, C., Su, W., Sun, Z., Gao, S., Xie, W., Zhang, B., & Sui, L. (2025, May 11). Carotenoids in Skin Photoaging: Unveiling Protective Effects, Molecular Insights, and Safety and Bioavailability Frontiers. Antioxidants, 14(5), 577 (PubMed PMID 40427459).
- [13] Sikorska-Zimny, K., Miszczak, A., Popinska, W., Lisiecki, P., Szemraj, M., Wojtasik, O., Chmielewska, P., Wrzodak, K., Duda, K., Rutkowski, K. P., & Wojciechowska, M. (2026, May 4). Preliminary Quality and Safety Evaluation of Lycopene-Based Dietary Supplements: Analysis of Active Compound Content, Microbiological Purity, and Chemical Contaminants. Foods, 15(9), 1583 (PubMed PMID 42121526).
- [14] Khanjani, S., & Jafarizadeh-Malmiri, H. (2026, May 1). Lycopene Extraction and Preparation of Its Nanoemulsion From Tomato Peel Using One Step Intensified Process Based on Microemulsion-Subcritical Water Technique. Journal of Food Science, 91(5), e71089 (PubMed PMID 42053369).
- [15] Yoshida, K., Nakazawa, Y., & Takahashi, S. (2026, August 3). Effect of Intake of Lycopene-Containing Products on Vascular Endothelial Function in Healthy Adults: A Systematic Review with Meta-Analysis. Nutrients, 18(15), 2505 (PubMed PMID 42588128).
- [16] Jilcott Pitts, S. B., Wu, Q., Laska, M. N., Gates, E., Seese, M. H., Senkus, K. E., Carrero Longlax, S., Portillo-Varela, A., DiNardo, A. R., & Moran, N. E. (2025, December 19). Daily intake of a lycopene-rich juice is associated with reductions in inflammatory markers but not increases in skin carotenoids in a pilot study among participants with obesity. BMC Nutrition, 11, 1222 (PubMed PMID 41420244).
- [17] Anghel Stefan, A. M., Enachi, E., Cristea Hohota, A. G., Balanescu, F., Cioanca, O., Hancianu, M., & Robu, S. (2026, June 25). Tomato-Derived Lycopene: From Phytochemistry and Extraction Technologies to Bioavailability and Nutraceutical Applications. Molecules, 31(13), 2243 (PubMed PMID 42451612).
- [18] USDA Foreign Agricultural Service. (2025, June 30). Germany: Exporter Guide Annual. U.S. Department of Agriculture GAIN Report GM2025-0013.
- [19] USDA Foreign Agricultural Service. (2026, April 2). Italy: Food Processing Ingredients Annual. U.S. Department of Agriculture GAIN Report IT2026-0001.
- [20] dsm-firmenich AG. (2026, July 30). dsm-firmenich reports H1 2026 results: Good LFL sales growth and sequential margin improvement through first half. dsm-firmenich AG Financial Press Releases.
- [21] Divi's Laboratories Limited. (2025, November 7). Consolidated Financial Results for the Quarter and Half Year Ended 30th September 2025. Divi's Laboratories Limited Investor Relations.
- [22] Song, G., Xiang, T., Hou, H., Wang, D., Yuan, T., Li, L., Jin, J., Wang, Z., Zheng, F., Zhang, M., & Gong, J. (2025, December 25). Cold plasma induced amyloid beta-lactoglobulin fibrils-fucoidan self-assembled complexes for lycopene delivery: Structural characterization, emulsion stability, and in vitro release behaviour. Food Chemistry, 496(Pt 3), 146846 (PubMed PMID 41197318).
- [23] Gao, F., Han, X., Wang, X., Qin, Q., Yu, D., Wang, T., & Du, J. (2026, August 25). The influence of incorporating rice bran oil body on the protein-based emulsion-filled gels and delivery properties: A study from gel behavior to functional applications. International Journal of Biological Macromolecules, 381(Pt 1), 154195 (PubMed PMID 42641729).
- [24] Pawar, S., Garge, S., Shetty, S., & Suvarna, V. (2026, May 12). Recent Advances in Lycopene Delivery Systems: Pharmaceutical, Nutraceutical, and Clinical Perspectives. Recent Advances in Drug Delivery and Formulation, 20, e26673878388760 (PubMed PMID 42152271).
This bibliography is provided for reader reference and is not exhaustive. The full report contains the complete reference list and detailed citations.
This Report Answers
- How large is the lycopene market in 2026 and what is forecast for 2036?
- Which clinical nutraceutical and synthetic-dye replacement pressures support demand for lycopene?
- Why does Natural Non-GMO Tomato Oleoresin Extraction lead production sources?
- Why do Cold-Water Dispersible Beadlets and Powders lead formulation types?
- How do growth rates differ across Japan and the United States versus the United Kingdom and Germany with Italy?
- Which leading companies supply vertically integrated tomato oleoresins versus CWD beadlets?
- What limits polyene oxidation stability or EFSA dietary exposure ceilings in the lycopene market?
- What should supplement and beverage formulators evaluate when selecting CWD beadlets versus oil suspensions?
Table of Content
- Key Takeaways
- Market Size and CAGR
- Top Growth Driver
- Fastest Growing Segment
- Leading Region
- Key Companies
- Emerging Opportunities
- Executive Summary
- Global Market Outlook
- Demand-side Trends
- Supply-side Trends
- Technology Roadmap Analysis
- Analysis and Recommendations
- Analyst Perspective (What is happening? Why now? What should investors know?)
- Key Questions Answered
- How large is the market?
- What is the CAGR?
- What are key trends?
- Which region dominates?
- Who are the leaders?
Read More...
- Market Overview
- Market Coverage / Taxonomy
- Market Definition / Scope / Limitations
- Research Methodology
- Chapter Orientation
- Analytical Lens and Working Hypotheses
- Market Structure, Signals, and Trend Drivers
- Benchmarking and Cross-market Comparability
- Market Sizing, Forecasting, and Opportunity Mapping
- Research Design and Evidence Framework
- Desk Research Programme (Secondary Evidence)
- Expert Input and Fieldwork (Primary Evidence)
- Tooling, Models, and Reference Databases
- Data Engineering and Model Build
- Quality Assurance and Audit Trail
- Market Background
- Market Dynamics (Drivers, Restraints, Opportunity, Trends)
- Scenario Forecast (Optimistic, Likely, Conservative)
- Impact Analysis
- AI Impact
- Sustainability Impact
- Regulatory Impact
- Technology Impact
- Consumer / Buyer Analysis
- Purchase Drivers
- Adoption Barriers
- Buyer Journey
- Opportunity Map Analysis
- Product Life Cycle Analysis
- Supply Chain Analysis
- Investment Feasibility Matrix
- Value Chain Analysis
- PESTLE and Porter's Analysis
- Regulatory Landscape
- Regional Parent Market Outlook
- Production and Consumption Statistics
- Import and Export Statistics
- Global Market Analysis and Forecast, 2021 to 2036
- Historical Market Size Value (USD Million) Analysis, 2021 to 2025
- Current and Future Market Size Value (USD Million) Projections, 2026 to 2036
- Y-o-Y Growth Trend Analysis
- Absolute $ Opportunity Analysis
- Global Market Pricing Analysis, 2021 to 2036
- Global Market Analysis and Forecast, By Production Source, 2021 to 2036
- Introduction / Key Findings
- Historical Market Size Value (USD Million) Analysis By Production Source, 2021 to 2025
- Current and Future Market Size Value (USD Million) Analysis and Forecast By Production Source, 2026 to 2036
- Natural Non-GMO Tomato Oleoresin Extraction
- Blakeslea trispora Fungal Fermentation
- Chemical Synthesis
- Y-o-Y Growth Trend Analysis By Production Source, 2021 to 2025
- Absolute $ Opportunity Analysis By Production Source, 2026 to 2036
- Global Market Analysis and Forecast, By Formulation Type, 2021 to 2036
- Introduction / Key Findings
- Historical Market Size Value (USD Million) Analysis By Formulation Type, 2021 to 2025
- Current and Future Market Size Value (USD Million) Analysis and Forecast By Formulation Type, 2026 to 2036
- Cold-Water Dispersible Beadlets and Powders
- Oil Suspensions and Emulsions
- Y-o-Y Growth Trend Analysis By Formulation Type, 2021 to 2025
- Absolute $ Opportunity Analysis By Formulation Type, 2026 to 2036
- Global Market Analysis and Forecast, By Application, 2021 to 2036
- Introduction / Key Findings
- Historical Market Size Value (USD Million) Analysis By Application, 2021 to 2025
- Current and Future Market Size Value (USD Million) Analysis and Forecast By Application, 2026 to 2036
- Prostate, Cardiovascular, and Skin Nutraceuticals
- Natural Red-Orange Food and Beverage Coloring E160d
- Anti-Photoaging Cosmetics and Nutricosmetics
- Y-o-Y Growth Trend Analysis By Application, 2021 to 2025
- Absolute $ Opportunity Analysis By Application, 2026 to 2036
- Global Market Analysis and Forecast, By Region, 2021 to 2036
- Introduction
- Historical Market Size Value (USD Million) Analysis By Region, 2021 to 2025
- Current Market Size Value (USD Million) Analysis and Forecast By Region, 2026 to 2036
- North America
- Latin America
- Western Europe
- Eastern Europe
- East Asia
- South Asia and Pacific
- Middle East and Africa
- Market Attractiveness Analysis By Region
- North America Market Analysis and Forecast, By Country, 2021 to 2036
- Historical Market Size Value (USD Million) Trend Analysis By Market Taxonomy, 2021 to 2025
- Market Size Value (USD Million) Forecast By Market Taxonomy, 2026 to 2036
- By Country
- United States
- Canada
- By Production Source
- By Formulation Type
- By Application
- By Country
- Market Attractiveness Analysis
- By Country
- By Production Source
- By Formulation Type
- By Application
- Key Takeaways
- Latin America Market Analysis and Forecast, By Country
- Historical Market Size Value (USD Million) Trend Analysis By Market Taxonomy, 2021 to 2025
- Market Size Value (USD Million) Forecast By Market Taxonomy, 2026 to 2036
- By Country
- Brazil
- Mexico
- Argentina
- Chile
- By Production Source
- By Formulation Type
- By Application
- By Country
- Market Attractiveness Analysis
- By Country
- By Production Source
- By Formulation Type
- By Application
- Key Takeaways
- Western Europe Market Analysis and Forecast, By Country
- Historical Market Size Value (USD Million) Trend Analysis By Market Taxonomy, 2021 to 2025
- Market Size Value (USD Million) Forecast By Market Taxonomy, 2026 to 2036
- By Country
- Germany
- France
- United Kingdom
- Italy
- Spain
- Benelux
- Nordics
- By Production Source
- By Formulation Type
- By Application
- By Country
- Market Attractiveness Analysis
- By Country
- By Production Source
- By Formulation Type
- By Application
- Key Takeaways
- Eastern Europe Market Analysis and Forecast, By Country
- Historical Market Size Value (USD Million) Trend Analysis By Market Taxonomy, 2021 to 2025
- Market Size Value (USD Million) Forecast By Market Taxonomy, 2026 to 2036
- By Country
- Poland
- Czech Republic
- Romania
- Hungary
- By Production Source
- By Formulation Type
- By Application
- By Country
- Market Attractiveness Analysis
- By Country
- By Production Source
- By Formulation Type
- By Application
- Key Takeaways
- East Asia Market Analysis and Forecast, By Country
- Historical Market Size Value (USD Million) Trend Analysis By Market Taxonomy, 2021 to 2025
- Market Size Value (USD Million) Forecast By Market Taxonomy, 2026 to 2036
- By Country
- China
- Japan
- South Korea
- By Production Source
- By Formulation Type
- By Application
- By Country
- Market Attractiveness Analysis
- By Country
- By Production Source
- By Formulation Type
- By Application
- Key Takeaways
- South Asia and Pacific Market Analysis and Forecast, By Country
- Historical Market Size Value (USD Million) Trend Analysis By Market Taxonomy, 2021 to 2025
- Market Size Value (USD Million) Forecast By Market Taxonomy, 2026 to 2036
- By Country
- India
- ASEAN
- Australia and New Zealand
- By Production Source
- By Formulation Type
- By Application
- By Country
- Market Attractiveness Analysis
- By Country
- By Production Source
- By Formulation Type
- By Application
- Key Takeaways
- Middle East and Africa Market Analysis and Forecast, By Country
- Historical Market Size Value (USD Million) Trend Analysis By Market Taxonomy, 2021 to 2025
- Market Size Value (USD Million) Forecast By Market Taxonomy, 2026 to 2036
- By Country
- GCC Countries
- South Africa
- Türkiye
- Israel
- By Production Source
- By Formulation Type
- By Application
- By Country
- Market Attractiveness Analysis
- By Country
- By Production Source
- By Formulation Type
- By Application
- Key Takeaways
- Key Countries Market Analysis
- United States
- Pricing Analysis
- Market Share Analysis, 2025
- By Production Source
- By Formulation Type
- By Application
- Canada
- Pricing Analysis
- Market Share Analysis, 2025
- By Production Source
- By Formulation Type
- By Application
- Mexico
- Pricing Analysis
- Market Share Analysis, 2025
- By Production Source
- By Formulation Type
- By Application
- Brazil
- Pricing Analysis
- Market Share Analysis, 2025
- By Production Source
- By Formulation Type
- By Application
- Chile
- Pricing Analysis
- Market Share Analysis, 2025
- By Production Source
- By Formulation Type
- By Application
- Germany
- Pricing Analysis
- Market Share Analysis, 2025
- By Production Source
- By Formulation Type
- By Application
- United Kingdom
- Pricing Analysis
- Market Share Analysis, 2025
- By Production Source
- By Formulation Type
- By Application
- Italy
- Pricing Analysis
- Market Share Analysis, 2025
- By Production Source
- By Formulation Type
- By Application
- Spain
- Pricing Analysis
- Market Share Analysis, 2025
- By Production Source
- By Formulation Type
- By Application
- France
- Pricing Analysis
- Market Share Analysis, 2025
- By Production Source
- By Formulation Type
- By Application
- India
- Pricing Analysis
- Market Share Analysis, 2025
- By Production Source
- By Formulation Type
- By Application
- ASEAN
- Pricing Analysis
- Market Share Analysis, 2025
- By Production Source
- By Formulation Type
- By Application
- Australia and New Zealand
- Pricing Analysis
- Market Share Analysis, 2025
- By Production Source
- By Formulation Type
- By Application
- China
- Pricing Analysis
- Market Share Analysis, 2025
- By Production Source
- By Formulation Type
- By Application
- Japan
- Pricing Analysis
- Market Share Analysis, 2025
- By Production Source
- By Formulation Type
- By Application
- South Korea
- Pricing Analysis
- Market Share Analysis, 2025
- By Production Source
- By Formulation Type
- By Application
- Poland
- Pricing Analysis
- Market Share Analysis, 2025
- By Production Source
- By Formulation Type
- By Application
- Hungary
- Pricing Analysis
- Market Share Analysis, 2025
- By Production Source
- By Formulation Type
- By Application
- Türkiye
- Pricing Analysis
- Market Share Analysis, 2025
- By Production Source
- By Formulation Type
- By Application
- South Africa
- Pricing Analysis
- Market Share Analysis, 2025
- By Production Source
- By Formulation Type
- By Application
- United States
- Market Structure Analysis
- Competition Dashboard
- Competition Benchmarking
- Market Share Analysis of Top Players
- By Regional
- By Production Source
- By Formulation Type
- By Application
- Emerging Startups
- Innovation Benchmarking
- Competition Analysis
- Competition Deep Dive
- Lycored Ltd.
- Overview
- Product Portfolio
- Profitability by Market Segments
- Sales Footprint
- Strategy Overview
- Marketing Strategy
- Product Strategy
- Channel Strategy
- DSM-Firmenich AG
- BASF SE
- Chr. Hansen Oterra A/S
- Allied Biotech Corporation
- Divi's Laboratories Limited
- Lycored Ltd.
- Case Studies
- Success Stories
- Recent Developments
- Competition Deep Dive
- Assumptions & Acronyms Used
List of Tables
- Table 1: Global Market Value (USD Million) Forecast by Region, 2021 to 2036
- Table 2: Global Market Value (USD Million) Forecast by Production Source, 2021 to 2036
- Table 3: Global Market Value (USD Million) Forecast by Formulation Type, 2021 to 2036
- Table 4: Global Market Value (USD Million) Forecast by Application, 2021 to 2036
- Table 5: North America Market Value (USD Million) Forecast by Country, 2021 to 2036
- Table 6: North America Market Value (USD Million) Forecast by Production Source, 2021 to 2036
- Table 7: North America Market Value (USD Million) Forecast by Formulation Type, 2021 to 2036
- Table 8: North America Market Value (USD Million) Forecast by Application, 2021 to 2036
- Table 9: Latin America Market Value (USD Million) Forecast by Country, 2021 to 2036
- Table 10: Latin America Market Value (USD Million) Forecast by Production Source, 2021 to 2036
- Table 11: Latin America Market Value (USD Million) Forecast by Formulation Type, 2021 to 2036
- Table 12: Latin America Market Value (USD Million) Forecast by Application, 2021 to 2036
- Table 13: Western Europe Market Value (USD Million) Forecast by Country, 2021 to 2036
- Table 14: Western Europe Market Value (USD Million) Forecast by Production Source, 2021 to 2036
- Table 15: Western Europe Market Value (USD Million) Forecast by Formulation Type, 2021 to 2036
- Table 16: Western Europe Market Value (USD Million) Forecast by Application, 2021 to 2036
- Table 17: Eastern Europe Market Value (USD Million) Forecast by Country, 2021 to 2036
- Table 18: Eastern Europe Market Value (USD Million) Forecast by Production Source, 2021 to 2036
- Table 19: Eastern Europe Market Value (USD Million) Forecast by Formulation Type, 2021 to 2036
- Table 20: Eastern Europe Market Value (USD Million) Forecast by Application, 2021 to 2036
- Table 21: East Asia Market Value (USD Million) Forecast by Country, 2021 to 2036
- Table 22: East Asia Market Value (USD Million) Forecast by Production Source, 2021 to 2036
- Table 23: East Asia Market Value (USD Million) Forecast by Formulation Type, 2021 to 2036
- Table 24: East Asia Market Value (USD Million) Forecast by Application, 2021 to 2036
- Table 25: South Asia and Pacific Market Value (USD Million) Forecast by Country, 2021 to 2036
- Table 26: South Asia and Pacific Market Value (USD Million) Forecast by Production Source, 2021 to 2036
- Table 27: South Asia and Pacific Market Value (USD Million) Forecast by Formulation Type, 2021 to 2036
- Table 28: South Asia and Pacific Market Value (USD Million) Forecast by Application, 2021 to 2036
- Table 29: Middle East and Africa Market Value (USD Million) Forecast by Country, 2021 to 2036
- Table 30: Middle East and Africa Market Value (USD Million) Forecast by Production Source, 2021 to 2036
- Table 31: Middle East and Africa Market Value (USD Million) Forecast by Formulation Type, 2021 to 2036
- Table 32: Middle East and Africa Market Value (USD Million) Forecast by Application, 2021 to 2036
List of Figures
- Figure 1: Global Market Pricing Analysis
- Figure 2: Global Market Value (USD Million) Forecast 2021-2036
- Figure 3: Global Market Value Share and BPS Analysis by Production Source, 2026 and 2036
- Figure 4: Global Market Y-o-Y Growth Comparison by Production Source, 2026-2036
- Figure 5: Global Market Attractiveness Analysis by Production Source
- Figure 6: Global Market Value Share and BPS Analysis by Formulation Type, 2026 and 2036
- Figure 7: Global Market Y-o-Y Growth Comparison by Formulation Type, 2026-2036
- Figure 8: Global Market Attractiveness Analysis by Formulation Type
- Figure 9: Global Market Value Share and BPS Analysis by Application, 2026 and 2036
- Figure 10: Global Market Y-o-Y Growth Comparison by Application, 2026-2036
- Figure 11: Global Market Attractiveness Analysis by Application
- Figure 12: Global Market Value (USD Million) Share and BPS Analysis by Region, 2026 and 2036
- Figure 13: Global Market Y-o-Y Growth Comparison by Region, 2026-2036
- Figure 14: Global Market Attractiveness Analysis by Region
- Figure 15: North America Market Incremental Dollar Opportunity, 2026-2036
- Figure 16: Latin America Market Incremental Dollar Opportunity, 2026-2036
- Figure 17: Western Europe Market Incremental Dollar Opportunity, 2026-2036
- Figure 18: Eastern Europe Market Incremental Dollar Opportunity, 2026-2036
- Figure 19: East Asia Market Incremental Dollar Opportunity, 2026-2036
- Figure 20: South Asia and Pacific Market Incremental Dollar Opportunity, 2026-2036
- Figure 21: Middle East and Africa Market Incremental Dollar Opportunity, 2026-2036
- Figure 22: North America Market Value Share and BPS Analysis by Country, 2026 and 2036
- Figure 23: North America Market Value Share and BPS Analysis by Production Source, 2026 and 2036
- Figure 24: North America Market Y-o-Y Growth Comparison by Production Source, 2026-2036
- Figure 25: North America Market Attractiveness Analysis by Production Source
- Figure 26: North America Market Value Share and BPS Analysis by Formulation Type, 2026 and 2036
- Figure 27: North America Market Y-o-Y Growth Comparison by Formulation Type, 2026-2036
- Figure 28: North America Market Attractiveness Analysis by Formulation Type
- Figure 29: North America Market Value Share and BPS Analysis by Application, 2026 and 2036
- Figure 30: North America Market Y-o-Y Growth Comparison by Application, 2026-2036
- Figure 31: North America Market Attractiveness Analysis by Application
- Figure 32: Latin America Market Value Share and BPS Analysis by Country, 2026 and 2036
- Figure 33: Latin America Market Value Share and BPS Analysis by Production Source, 2026 and 2036
- Figure 34: Latin America Market Y-o-Y Growth Comparison by Production Source, 2026-2036
- Figure 35: Latin America Market Attractiveness Analysis by Production Source
- Figure 36: Latin America Market Value Share and BPS Analysis by Formulation Type, 2026 and 2036
- Figure 37: Latin America Market Y-o-Y Growth Comparison by Formulation Type, 2026-2036
- Figure 38: Latin America Market Attractiveness Analysis by Formulation Type
- Figure 39: Latin America Market Value Share and BPS Analysis by Application, 2026 and 2036
- Figure 40: Latin America Market Y-o-Y Growth Comparison by Application, 2026-2036
- Figure 41: Latin America Market Attractiveness Analysis by Application
- Figure 42: Western Europe Market Value Share and BPS Analysis by Country, 2026 and 2036
- Figure 43: Western Europe Market Value Share and BPS Analysis by Production Source, 2026 and 2036
- Figure 44: Western Europe Market Y-o-Y Growth Comparison by Production Source, 2026-2036
- Figure 45: Western Europe Market Attractiveness Analysis by Production Source
- Figure 46: Western Europe Market Value Share and BPS Analysis by Formulation Type, 2026 and 2036
- Figure 47: Western Europe Market Y-o-Y Growth Comparison by Formulation Type, 2026-2036
- Figure 48: Western Europe Market Attractiveness Analysis by Formulation Type
- Figure 49: Western Europe Market Value Share and BPS Analysis by Application, 2026 and 2036
- Figure 50: Western Europe Market Y-o-Y Growth Comparison by Application, 2026-2036
- Figure 51: Western Europe Market Attractiveness Analysis by Application
- Figure 52: Eastern Europe Market Value Share and BPS Analysis by Country, 2026 and 2036
- Figure 53: Eastern Europe Market Value Share and BPS Analysis by Production Source, 2026 and 2036
- Figure 54: Eastern Europe Market Y-o-Y Growth Comparison by Production Source, 2026-2036
- Figure 55: Eastern Europe Market Attractiveness Analysis by Production Source
- Figure 56: Eastern Europe Market Value Share and BPS Analysis by Formulation Type, 2026 and 2036
- Figure 57: Eastern Europe Market Y-o-Y Growth Comparison by Formulation Type, 2026-2036
- Figure 58: Eastern Europe Market Attractiveness Analysis by Formulation Type
- Figure 59: Eastern Europe Market Value Share and BPS Analysis by Application, 2026 and 2036
- Figure 60: Eastern Europe Market Y-o-Y Growth Comparison by Application, 2026-2036
- Figure 61: Eastern Europe Market Attractiveness Analysis by Application
- Figure 62: East Asia Market Value Share and BPS Analysis by Country, 2026 and 2036
- Figure 63: East Asia Market Value Share and BPS Analysis by Production Source, 2026 and 2036
- Figure 64: East Asia Market Y-o-Y Growth Comparison by Production Source, 2026-2036
- Figure 65: East Asia Market Attractiveness Analysis by Production Source
- Figure 66: East Asia Market Value Share and BPS Analysis by Formulation Type, 2026 and 2036
- Figure 67: East Asia Market Y-o-Y Growth Comparison by Formulation Type, 2026-2036
- Figure 68: East Asia Market Attractiveness Analysis by Formulation Type
- Figure 69: East Asia Market Value Share and BPS Analysis by Application, 2026 and 2036
- Figure 70: East Asia Market Y-o-Y Growth Comparison by Application, 2026-2036
- Figure 71: East Asia Market Attractiveness Analysis by Application
- Figure 72: South Asia and Pacific Market Value Share and BPS Analysis by Country, 2026 and 2036
- Figure 73: South Asia and Pacific Market Value Share and BPS Analysis by Production Source, 2026 and 2036
- Figure 74: South Asia and Pacific Market Y-o-Y Growth Comparison by Production Source, 2026-2036
- Figure 75: South Asia and Pacific Market Attractiveness Analysis by Production Source
- Figure 76: South Asia and Pacific Market Value Share and BPS Analysis by Formulation Type, 2026 and 2036
- Figure 77: South Asia and Pacific Market Y-o-Y Growth Comparison by Formulation Type, 2026-2036
- Figure 78: South Asia and Pacific Market Attractiveness Analysis by Formulation Type
- Figure 79: South Asia and Pacific Market Value Share and BPS Analysis by Application, 2026 and 2036
- Figure 80: South Asia and Pacific Market Y-o-Y Growth Comparison by Application, 2026-2036
- Figure 81: South Asia and Pacific Market Attractiveness Analysis by Application
- Figure 82: Middle East and Africa Market Value Share and BPS Analysis by Country, 2026 and 2036
- Figure 83: Middle East and Africa Market Value Share and BPS Analysis by Production Source, 2026 and 2036
- Figure 84: Middle East and Africa Market Y-o-Y Growth Comparison by Production Source, 2026-2036
- Figure 85: Middle East and Africa Market Attractiveness Analysis by Production Source
- Figure 86: Middle East and Africa Market Value Share and BPS Analysis by Formulation Type, 2026 and 2036
- Figure 87: Middle East and Africa Market Y-o-Y Growth Comparison by Formulation Type, 2026-2036
- Figure 88: Middle East and Africa Market Attractiveness Analysis by Formulation Type
- Figure 89: Middle East and Africa Market Value Share and BPS Analysis by Application, 2026 and 2036
- Figure 90: Middle East and Africa Market Y-o-Y Growth Comparison by Application, 2026-2036
- Figure 91: Middle East and Africa Market Attractiveness Analysis by Application
- Figure 92: Global Market - Tier Structure Analysis
- Figure 93: Global Market - Company Share Analysis
Frequently Asked Questions
How big is the lycopene market in 2026, and what is forecast for 2036?
Global lycopene valuation registered USD 168.4 million during 2025 before stepping up to USD 177.8 million in 2026. Long-term forecasts project the category to attain USD 306.6 million in 2036 when supplement and beverage brands expand prostate and vascular with E160d natural color formulations.
What is the CAGR for the lycopene market from 2026 to 2036?
Category valuation for lycopene progresses at a 5.6% annual rate from 2026 through 2036, creating USD 128.8 million in new market value across nutraceutical and food coloring with nutricosmetic applications.
Which production source segment leads the lycopene market?
Natural Non-GMO Tomato Oleoresin Extraction commands 58.4% of 2026 source value because plant-extracted tomato complexes carry clean-label supplement and 21 CFR 73.585 food-color approvals.
Which formulation type segment leads the lycopene market?
Cold-Water Dispersible Beadlets and Powders make up 52.5% of 2026 formulation type demand as hydrocolloid microencapsulation shields polyene chains against oxidation during tableting and beverage mixing.
Which country has a notable growth outlook during the assessment period?
Japan tops national growth rankings at 6.1% annually through 2036, propelled by Foods with Function Claims beverages and supplements targeting vascular HDL and blood pressure with UV skin protection.
Who are the key players in the market?
Lycored Ltd. and DSM-Firmenich AG with BASF SE lead tomato extraction and CWD microencapsulation. Chr. Hansen Oterra A/S and Allied Biotech Corporation with Divi's Laboratories Limited supply natural E160d emulsions and cGMP carotenoid grades.
Preview the report firsthand - request a free sample
Get SampleGet the brochure for pricing and purchase details.
Get PDF
