Natural Food Colours Market
Market Insights on Natural Food Colours covering sales outlook, demand forecast & up-to-date key trends
Natural Food Colours Market By Pigment Type (Carotenoid, Curcumin, Anthocyanin, Paprika extract, Spirulina extract, Chlorophyll, Carmine), Application (Dairy Food Products, Beverages, Packaged Food/Frozen Products, Confectionery and Bakery Products) & Region - Forecast to 2018 - 2028
Natural Food Colours Market Outlook
The natural food colours market is anticipated to grow at an impressive CAGR during the forecast period. A significant rise in demand for natural food colours has been coming from industries to enhance the appeal of products. Consumers’ proclivity towards clean-label products has been increasing, owing to the rise in health awareness and food adulteration. As a result, consumers wish to look at the label before purchasing any product, which is a crucial driver for the increasing sales of natural food colours.
In addition, several studies have found out the ill effects of food colours has been inspiring numerous government authorities to introduce legislation for the best interest of consumers’ health. As a result, the market for synthetic food colours is likely to be eventually captured by natural food colours. Numerous food products such as meat and savoury lose their appeal when cooked or grilled. As a result, the restaurant and food hubs use natural food colours in large quantities.
Hectic schedules and dual working households have directed a shift towards takeaways and dine-outs. As a result, restaurateurs are striving to enhance the look of meat products to attract more diners. On the flip side, numerous roadblocks lay for the growth of the natural food colours market. Consumers face numerous challenges regarding the expensiveness of natural food colours, owing to the complex process of extraction. In some processes, it is difficult to yield high-quality natural food colours, while in some cases, some natural ingredients exhaust.
During the COVID-19 crisis, the prices of natural food prices are likely to rise, owing to economic instability. However, this rise in the price is likely to be there for the short term. During this period, the demand for natural food products is expected to decrease.
Let us know your requirement to get
100% FREE customization
Beverages Mainstay for Natural Food Colours, while Packaged Food Closes in
The global food industry is becoming more consumer-centric and changing rapidly. As consumer needs and eating habits are increasingly evolving, food manufacturers are hard pressed to make decisions about which segments of consumers to serve and which new trends to prioritize. This is according to Future Market Insights’ Natural Food Colours Market Report that explores a distinct move towards natural ingredients, especially within food colours.
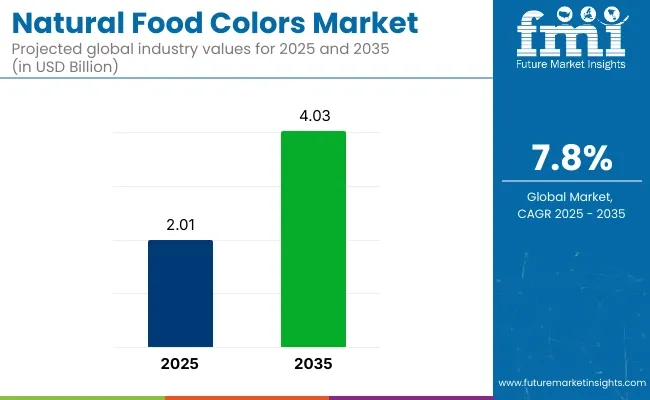
The natural food colours market is estimated to be valued at US$ 7.7 Bn in 2019, and grow at relatively high pace as compared to synthetic colours market. In recent past, aversion of consumers towards synthetic and chemical-based products has been evident, and with it the demand for natural food colours is moving on an upward swing. This growth is attractive for market players primarily focused on natural sources of colours, while synthetic colour manufacturers are struggling to switch and fulfil the newer demands.
Several companies such as McCormick & Company, Inc. are filing colour additive petition (CAP) for the expanded safe use of natural food colours across various countries. Regulatory bodies such as FDA are therefore amending colour additive regulations. Subsequently, faster approval of natural food colours is expected to decelerate sales of artificial food colours.
Demand Bolstered by Notable Changes in Beverages Industry
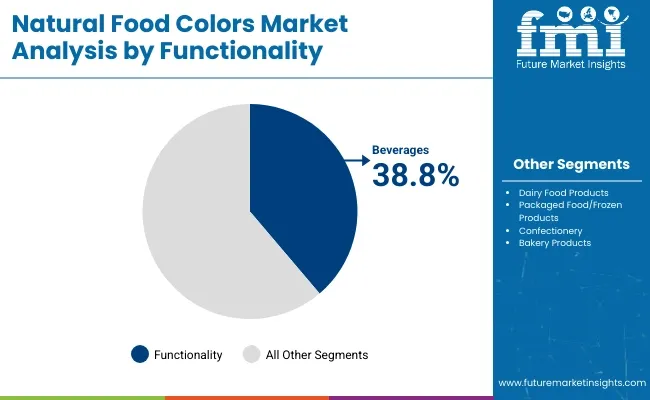
In 2018, natural food colours of around US$ 2.3 billion were sold for application in beverages. Today, as focus shifts towards convenience food and beverages, a step change in innovation is noticeable in the beverage industry to tap into newer consumer trends. In addition to rapid increase in demand for ready-to-drink and on-the-go drinks, consumers’ inquisitiveness about ingredients and their sourcing is increasing. Expected to account for one third share by 2029, recent changes in the beverage industry will continue to influence the growth of natural food colours market.
In the processed food sector, colour is one of the important aspects, and goes a significant way towards determining the success or failure of new product launches. Key players in the natural food colours market are therefore focusing on capitalizing on rapidly growing demand for packaged food and frozen products. Further, flavour innovations are trending in the dairy industry which is expected to weigh on same scale as growing demand for natural food colours.
Asia Pacific Promises Lucrative Growth Opportunities
Growth prospects of the natural food colours market continue to remain high in Asia Pacific, with China emerging as the largest exporter. Rapid uptake of natural food colours in new product development can be attributed to pervasiveness of food safety scandals in the region. In North America, natural food colours appeared on the scene, with implementation of strict rules to prohibit the use of harmful synthetic colours containing lead, arsenic, and mercury. Continuous efforts of confectionery brands in North America to phase out all artificial colours from their product portfolio will continue to work to the advantage of market players.
Find your sweet spots for generating winning opportunities in this market.
Talk to AnalystCarotenoid Takes Centre Stage with 95% Revenue Share
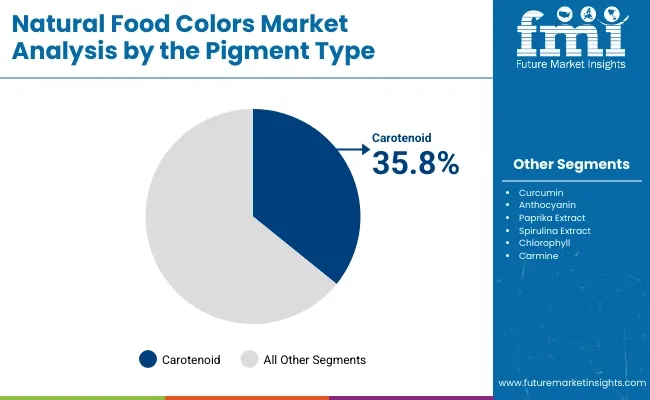
Ease-of-use, superior stability, enhanced appearance and greater consumer appeal have resulted in carotenoid accounting for major share of manufacturers’ bottom lines. As natural food colours worth US$ 7.3 Bn sold in 2018 were based on carotenoid, manufacturers are specifically focused on this category. However, with growing demand for natural blues and green shades in beverages and confectionery, sales of spirulina extracts are expected to grow at a higher rate than carotenoid in the future.
A number of key market players are further tapping superfood spirulina for its antioxidant properties, high nutrient content, and vibrant colour to deliver 100% natural and clean label food colours. As the next big wave of innovation in the natural food colours market is set to focus on providing consumers with health and functional benefits, volume sales of carmine are expected to witness its lowest during the period 2019-2029. Apart from effects of carmine to consumers with bug allergies, the rise of vegan culture is projected to represent a potential challenge to the sales of carmine, despite its ‘natural’ status.
Demand in MEA Ascending Despite High Price Point
High pricing of natural food colours in countries of Middle East & Africa has restricted the market expansion in the region. Significant dependency on imports in Middle East and unfavourable climatic conditions in sub-Saharan Africa to establish manufacturing facilities have resulted in relative high price of natural food colours as compared to other regions. Despite the high price, the ban on quinoline yellow and tartrazine in most drinks and products in the UAE are projected to push transition to natural food colours, and subsequently fuel market growth.
Lower average price in North America can be attributed to increasing focus on identification of new botanical sources to improve shade range and final cost. In addition, greater adoption of new technologies in extraction, processing, and stability enhancement has played an essential role in overcoming cost-in-use challenges, thereby improving the final pricing.
Natural Food Colours Market Report Scope
Attribute |
Details |
Forecast Period |
2013-2017 |
Historical Data Available for |
2018-2028 |
Market Analysis |
US$ Mn for Value |
Key Regions Covered |
North America, Latin America, Eastern Europe, Western Europe, APEJ, Japan, and Middle East & Africa (MEA) |
Key Countries Covered |
U.S, Canada, Mexico, Brazil, Rest of Latin America, Germany, United Kingdom, France, Italy, Spain, Benelux, Nordic Region, Rest of Western Europe, China, India, Australia, Japan, ASEAN, Rest of APAC, New Zealand, GCC, South Africa, and Rest of MEA |
Key Segments Covered |
Product, Channel, Region |
Key Companies Profiled |
|
Report Coverage |
Market Overview, Key Market Trends, Key Success Factors, Demand Analysis, Market Background, COVID-19 Analysis, Segmental Analysis, Regional Profiling, Market Structure & Competition Analysis |
Customization & Pricing |

An unified Market Research Subscription Platform, built for today’s disparate research needs.
Key Segments Covered
Analysis by Pigment Type:
- Carotenoid
- Beta carotene
- Annatto
- Lutein
- Lycopene
- Curcumin
- Anthocyanin
- Paprika extract
- Spirulina extract
- Chlorophyll
- Carmine
Analysis by Application:
- Dairy Food Products
- Beverages
- Packaged Food/Frozen Products
- Confectionery and Bakery Products
- Others
Key Regions/Countries Covered:
- North America
- U.S.
- Canada
- Latin America
- Brazil
- Mexico
- Rest of Latin America
- Western Europe
- Germany
- France
- U.K.
- Spain
- Italy
- Benelux
- Nordic
- Rest of Western Europe
- Eastern Europe
- Russia
- Poland
- Rest of Eastern Europe
- APEJ
- China
- India
- Australia & New Zealand
- ASEAN
- Rest of APAC
- Japan
- MEA
- GCC Countries
- Turkey
- South Africa
- North Africa
- Rest of MEA
Frequently Asked Questions
The global natural food colours market is predicted to grow at 6% CAGR through 2032.
The North American global natural food colours market holds the highest revenue potential.
The global natural food colours market is expected to surpass US$ 3.22 Bn by 2032.
The global natural food colours market size is anticipated to be over US$ 1.8 Bn in 2022.
Table of Content
1. Executive Summary
1.1. Market Overview
1.2. Market Drivers Snapshot
1.3. FMI Analysis and Recommendations
2. Market Introduction
2.1. Market Definition
2.2. Market Taxonomy
3. Natural Food Colours Market Dynamics
3.1. Macro-Economic Factors
3.2. Opportunity Analysis
3.3. Global Economic Outlook
3.3.1. Global GDP by Region and Country, 2006–2021
3.3.2. Global Industry Value Added
3.3.3. Global Food & Beverages Industry Outlook
3.4. Market Dynamics
3.4.1. Drivers
3.4.2. Restraints
3.4.3. Trends
3.4.4. Opportunities
3.5. Value Chain Analysis
3.6. Forecast Factors – Relevance & Impact
3.7. Social Sentiment Analysis
4. Global Natural Food Colours Market Analysis 2013–2017 and Forecast 2018–2028
4.1. Market Volume Projections
4.2. Market Size Projections
4.2.1. Y-o-Y Projections
4.2.2. Absolute $ Opportunity Analysis
5. Global Natural Food Colours Market Pricing Analysis
5.1. Regional Average Pricing Analysis
5.1.1. North America
5.1.2. Latin America
5.1.3. Eastern Europe
5.1.4. Western Europe
5.1.5. APEJ
5.1.6. Japan
5.1.7. Middle East & Africa
5.2. Pricing Analysis, By Nature
5.3. Pricing Analysis, by Key Manufacturers
6. Global Supply/Demand Analysis and Trade Scenario, By Region
6.1. North America
6.2. Latin America
6.3. Eastern Europe
6.4. Western Europe
6.5. Asia Pacific Excluding Japan (APEJ)
6.6. Japan
6.7. Middle East & Africa
7. Global Natural Food Colours Market Analysis 2013–2017 and Forecast 2018–2028, by Application
7.1. Introduction
7.1.1. Market Value Share Analysis By Application
7.1.2. Y-o-Y Growth Analysis By Application
7.2. Historical Market Size (US$ Mn) and Volume By Application, 2013–2017
7.3. Market Size (US$ Mn) and Volume Forecast By Application, 2018-2028
7.3.1. Dairy Food Products
7.3.2. Beverages
7.3.3. Packaged Food/Frozen Products
7.3.4. Confectionary and Bakery Products
7.3.5. Others
7.4. Market Attractiveness Analysis By Application
8. Global Natural Food Colours Market Analysis 2013–2017 and Forecast 2018–2028, by Pigment
8.1. Introduction
8.1.1. Market Value Share Analysis By Pigment
8.1.2. Y-o-Y Growth Analysis By Product Pigment
8.2. Historical Market Size (US$ Mn) and Volume By Pigment, 2013–2017
8.3. Market Size (US$ Mn) and Volume Forecast By Pigment, 2018-2028
8.3.1. Carotenoid
8.3.2. Curcumin
8.3.3. Anthocyanin
8.3.4. Paprika Extract
8.3.5. Spirulina Extract
8.3.6. Chlorophyll
8.3.7. Carmine
8.3.8. Others
8.4. Market Attractiveness Analysis By Pigment
9. Global Natural Food Colours Market Analysis and Forecast, By Region
9.1. Introduction
9.1.1. Market Value Share Analysis By Region
9.1.2. Y-o-Y Growth Analysis By Region
9.2. Historical Market Size (US$ Mn) and Volume By Region, 2013–2017
9.3. Market Size (US$ Mn) and Volume Forecast By Region, 2018-2028
9.3.1. North America
9.3.2. Latin America
9.3.3. Eastern Europe
9.3.4. Western Europe
9.3.5. APEJ
9.3.6. Japan
9.3.7. Middle East & Africa
9.4. Market Attractiveness Analysis By Region
10. North America Natural Food Colours Market Analysis 2013–2017 and Forecast 2018–2028
10.1. Introduction
10.2. Historical Market Size (US$ Mn) and Volume By Market Segments, 2013–2017
10.3. Market Size (US$ Mn) and Volume Forecast By Market Segments, 2018-2028
10.3.1. By Country
10.3.1.1. U.S.
10.3.1.2. Canada
10.3.2. By Application
10.3.3. By Pigment
10.4. Market Attractiveness Analysis
10.4.1. By Country
10.4.2. By Application
10.4.3. By Pigment
10.5. Drivers and Restraints: Impact Analysis
10.6. Key Participants Market Presence Intensity Mapping
11. Latin America Natural Food Colours Market Analysis 2013–2017 and Forecast 2018–2028
11.1. Introduction
11.2. Historical Market Size (US$ Mn) and Volume By Market Segments, 2013–2017
11.3. Market Size (US$ Mn) and Volume Forecast By Market Segments, 2018-2028
11.3.1. By Country
11.3.1.1. Brazil
11.3.1.2. Mexico
11.3.1.3. Rest of Latin America
11.3.2. By Application
11.3.3. By Pigment
11.3.4. By Nature
11.3.5. By Distribution Channel
11.4. Market Attractiveness Analysis
11.4.1. By Country
11.4.2. By Application
11.4.3. By Pigment
11.5. Drivers and Restraints: Impact Analysis
11.6. Key Participants Market Presence Intensity Mapping
12. Western Europe Natural Food Colours Market Analysis 2013–2017 and Forecast 2018–2028
12.1. Introduction
12.2. Historical Market Size (US$ Mn) and Volume By Market Segments, 2013–2017
12.3. Market Size (US$ Mn) and Volume Forecast By Market Segments, 2018-2028
12.3.1. By Country
12.3.1.1. Germany
12.3.1.2. United Kingdom
12.3.1.3. France
12.3.1.4. Italy
12.3.1.5. Spain
12.3.1.6. Benelux
12.3.1.7. Nordic Region
12.3.1.8. Rest of Western Europe
12.3.2. By Application
12.3.3. By Pigment
12.4. Market Attractiveness Analysis
12.4.1. By Country
12.4.2. By Application
12.4.3. By Pigment
12.5. Drivers and Restraints: Impact Analysis
12.6. Key Participants Market Presence Intensity Mapping
13. Eastern Europe Natural Food Colours Market Analysis 2013–2017 and Forecast 2018–2028
13.1. Introduction
13.2. Historical Market Size (US$ Mn) and Volume By Market Segments, 2013–2017
13.3. Market Size (US$ Mn) and Volume Forecast By Market Segments, 2018-2028
13.3.1. By Country
13.3.1.1. Russia
13.3.1.2. Poland
13.3.1.3. Rest of Eastern Europe
13.3.2. By Application
13.3.3. By Pigment
13.4. Market Attractiveness Analysis
13.4.1. By Country
13.4.2. By Application
13.4.3. By Pigment
13.5. Drivers and Restraints: Impact Analysis
13.6. Key Participants Market Presence Intensity Mapping
14. APEJ Natural Food Colours Market Analysis 2013–2017 and Forecast 2018–2028
14.1. Introduction
14.2. Historical Market Size (US$ Mn) and Volume By Market Segments, 2013–2017
14.3. Market Size (US$ Mn) and Volume Forecast By Market Segments, 2018-2028
14.3.1. By Country
14.3.1.1. China
14.3.1.2. India
14.3.1.3. Australia and New Zealand
14.3.1.4. ASEAN
14.3.1.5. Rest of APAC
14.3.2. By Application
14.3.3. By Pigment
14.4. Market Attractiveness Analysis
14.4.1. By Country
14.4.2. By Application
14.4.3. By Pigment
14.5. Drivers and Restraints: Impact Analysis
14.6. Key Participants Market Presence Intensity Mapping
15. Japan Natural Food Colours Market Analysis 2013–2017 and Forecast 2018–2028
15.1. Introduction
15.2. Historical Market Size (US$ Mn) and Volume By Market Segments, 2013–2017
15.3. Market Size (US$ Mn) and Volume Forecast By Market Segments, 2018-2028
15.3.1. By Application
15.3.2. By Pigment
15.4. Market Attractiveness Analysis
15.4.1. By Application
15.4.2. By Pigment
15.5. Drivers and Restraints: Impact Analysis
15.6. Key Participants Market Presence Intensity Mapping
16. Middle East & Africa Natural Food Colours Market Analysis 2013–2017 and Forecast 2018–2028
16.1. Introduction
16.2. Historical Market Size (US$ Mn) and Volume By Market Segments, 2013–2017
16.3. Market Size (US$ Mn) and Volume Forecast By Market Segments, 2018-2028
16.3.1. By Country
16.3.1.1. GCC Countries
16.3.1.2. South Africa
16.3.1.3. Rest of MEA
16.3.2. By Application
16.3.3. By Pigment
16.4. Market Attractiveness Analysis
16.4.1. By Country
16.4.2. By Application
16.4.3. By Pigment
16.5. Drivers and Restraints: Impact Analysis
16.6. Key Participants Market Presence Intensity Mapping
17. Natural Food Colours Market Industry Structure
17.1. Market Share Analysis of Top 10 Players, By Region
17.1.1. North America
17.1.2. Europe
17.1.3. Asia Pacific
17.2. Market Presence Analysis
17.2.1. By Regional Footprint
17.2.2. By Product Footprint
17.2.3. By Channel Footprint
18. Competition Analysis
18.1. Competition Dashboard
18.2. Competitive Benchmarking
18.3. Profitability and Gross Margin Analysis By Competition
18.4. Competition Developments (Mergers, Acquisitions and Expansions)
18.5. Competition Deepdive
18.5.1. Sensient Technologies Corporation
18.5.1.1. Overview
18.5.1.2. Product Portfolio
18.5.1.3. Profitability by Market Segments (Product/Channel/Region)
18.5.1.4. Production Footprint
18.5.1.5. Strategy Overview
18.5.2. Archer Daniels Midland
18.5.3. Naturex S.A.
18.5.4. Döhler GmbH
18.5.5. Symrise AG
18.5.6. Chr. Hansen Holding A/S
18.5.7. McCormick & Company
18.5.8. Kalsec Inc.
18.5.9. DDW The Color House Corporation
18.5.10. ROHA Dyechem Pvt. Ltd. (JJT Group)
18.5.11. Aakash Chemicals and Dyestuffs
18.5.12. AFIS (Australian Food Ingredient Suppliers)
18.5.13. San-Ei Gen F.F.I Inc.
18.5.14. GNT International B.V (EXBERRY)
18.5.15. Adama Agricultural Solutions Ltd. (LycoRed)
Let us know your requirement to get
100% FREE customization
List of Tables
Table 01: Global Natural Food Colours Historical Market Size (US$ Mn) 2013–2017 and Forecast 2018–2028 by Pigment Type
Table 02: Global Natural Food Colours Historical Market Size (MT) 2013–2017 and Forecast 2018–2028 by Pigment Type
Table 03: Global Natural Food Colours Historical Market Size (US$ Mn) 2013–2017 and Forecast 2018–2028 by Application
Table 04: Global Natural Food Colours Historical Market Volume (MT) 2013–2017 and Forecast 2018–2028 by Application
Table 05: Global Natural Food Colours Historical Market Size (US$ Mn) 2013–2017 and Forecast 2018–2028 by Region
Table 06: Global Natural Food Colours Historical Market Size (MT) 2013–2017 and Forecast 2018–2028 by Region
Table 07: North America Natural Food Colours Historical Market Size (US$ Mn) 2013–2017 and Forecast 2018–2028 by Pigment Type
Table 08: North America Natural Food Colours Historical Market Size (MT) 2013–2017 and Forecast 2018–2028 by Pigment Type
Table 09: North America Natural Food Colours Historical Market Size (US$ Mn) 2013–2017 and Forecast 2018–2028 by Application
Table 10: North America Natural Food Colours Historical Market Volume (MT) 2013–2017 and Forecast 2018–2028 by Application
Table 11: North America Natural Food Colours Historical Market Size (US$ Mn) 2013–2017 and Forecast 2018–2028 by Country
Table 12: North America Natural Food Colours Historical Market Size (MT) 2013–2017 and Forecast 2018–2028 by Country
Table 13: Latin America Natural Food Colours Historical Market Size (US$ Mn) 2013–2017 and Forecast 2018–2028 by Pigment Type
Table 14: Latin America Natural Food Colours Historical Market Size (MT) 2013–2017 and Forecast 2018–2028 by Pigment Type
Table 15: Latin America Natural Food Colours Historical Market Size (US$ Mn) 2013–2017 and Forecast 2018–2028 by Application
Table 16: Latin America Natural Food Colours Historical Market Volume (MT) 2013–2017 and Forecast 2018–2028 by Application
Table 17: Latin America Natural Food Colours Historical Market Size (US$ Mn) 2013–2017 and Forecast 2018–2028 by Country
Table 18: Latin America Natural Food Colours Historical Market Size (MT) 2013–2017 and Forecast 2018–2028 by Country
Table 19: Western Europe Natural Food Colours Historical Market Size (US$ Mn) 2013–2017 and Forecast 2018–2028 by Pigment Type
Table 20: Western Europe Natural Food Colours Historical Market Size (MT) 2013–2017 and Forecast 2018–2028 by Pigment Type
Table 21: Western Europe Natural Food Colours Historical Market Size (US$ Mn) 2013–2017 and Forecast 2018–2028 by Application
Table 22: Western Europe Natural Food Colours Historical Market Volume (MT) 2013–2017 and Forecast 2018–2028 by Application
Table 23: Western Europe Natural Food Colours Historical Market Size (US$ Mn) 2013–2017 and Forecast 2018–2028 by Country
Table 24: Western Europe Natural Food Colours Historical Market Size (MT) 2013–2017 and Forecast 2018–2028 by Country
Table 25: Eastern Europe Natural Food Colours Historical Market Size (US$ Mn) 2013–2017 and Forecast 2018–2028 by Pigment Type
Table 26: Eastern Europe Natural Food Colours Historical Market Size (MT) 2013–2017 and Forecast 2018–2028 by Pigment Type
Table 27: Eastern Europe Natural Food Colours Historical Market Size (US$ Mn) 2013–2017 and Forecast 2018–2028 by Application
Table 28: Eastern Europe Natural Food Colours Historical Market Volume (MT) 2013–2017 and Forecast 2018–2028 by Application
Table 29: Eastern Europe Natural Food Colours Historical Market Size (US$ Mn) 2013–2017 and Forecast 2018–2028 by Country
Table 30: Eastern Europe Natural Food Colours Historical Market Size (MT) 2013–2017 and Forecast 2018–2028 by Country
Table 31: APEJ Natural Food Colours Historical Market Size (US$ Mn) 2013–2017 and Forecast 2018–2028 by Pigment Type
Table 32: APEJ Natural Food Colours Historical Market Size (MT) 2013–2017 and Forecast 2018–2028 by Pigment Type
Table 33: APEJ Natural Food Colours Historical Market Size (US$ Mn) 2013–2017 and Forecast 2018–2028 by Application
Table 34: APEJ Natural Food Colours Historical Market Volume (MT) 2013–2017 and Forecast 2018–2028 by Application
Table 35: APEJ Natural Food Colours Historical Market Size (US$ Mn) 2013–2017 and Forecast 2018–2028 by Country
Table 36: APEJ Natural Food Colours Historical Market Size (MT) 2013–2017 and Forecast 2018–2028 by Country
Table 37: Japan Natural Food Colours Historical Market Size (US$ Mn) 2013–2017 and Forecast 2018–2028 by Pigment Type
Table 38: Japan Natural Food Colours Historical Market Size (MT) 2013–2017 and Forecast 2018–2028 by Pigment Type
Table 39: Japan Natural Food Colours Historical Market Size (US$ Mn) 2013–2017 and Forecast 2018–2028 by Application
Table 40: Japan Natural Food Colours Historical Market Volume (MT) 2013–2017 and Forecast 2018–2028 by Application
Table 41: MEA Natural Food Colours Historical Market Size (US$ Mn) 2013–2017 and Forecast 2018–2028 by Pigment Type
Table 42: MEA Natural Food Colours Historical Market Size (MT) 2013–2017 and Forecast 2018–2028 by Pigment Type
Table 43: MEA Natural Food Colours Historical Market Size (US$ Mn) 2013–2017 and Forecast 2018–2028 by Application
Table 44: MEA Natural Food Colours Historical Market Volume (MT) 2013–2017 and Forecast 2018–2028 by Application
Table 45: MEA Natural Food Colours Historical Market Size (US$ Mn) 2013–2017 and Forecast 2018–2028 by Country
Table 46: MEA Natural Food Colours Historical Market Size (US$ Mn) 2013–2017 and Forecast 2018–2028 by Country
Find your sweet spots for generating winning opportunities in this market.
Talk to AnalystList of Charts
Figure 01: Global Natural Food Colours Market Size (US$ Mn) and Volume (Metric Tons) Forecast, 2018–2028
Figure 02: Global Natural Food Colours Market Absolute $ Opportunity, 2018–2028
Figure 03: Global Natural Food Colours Market Share Analysis by Pigment Type, 2018 and 2028
Figure 04: Global Natural Food Colours Market Y-o-Y Growth Analysis by Pigment Type, 2018–2028
Figure 05: Global Natural Food Colours Market Attractiveness Analysis by Pigment Type, 2018–2028
Figure 06: Global Natural Food Colours Market Share Analysis by Application, 2018 and 2028
Figure 07: Global Natural Food Colours Market Y-o-Y Growth Analysis by Application, 2018–2028
Figure 08: Global Natural Food Colours Market Attractiveness Analysis by Application, 2018–2028
Figure 09: Global Natural Food Colours Market Share Analysis by Region, 2018 and 2028
Figure 10: Global Natural Food Colours Market Y-o-Y Growth Analysis by Region, 2018–2028
Figure 11: Global Natural Food Colours Market Attractiveness Analysis by Region, 2018–2028
Figure 12: North America Natural Food Colours Market Share Analysis by Pigment Type, 2018 and 2028
Figure 13: North America Natural Food Colours Market Y-o-Y Growth Analysis by Pigment Type, 2018–2028
Figure 14: North America Natural Food Colours Market Attractiveness Analysis by Pigment Type, 2018–2028
Figure 15: North America Natural Food Colours Market Share Analysis by Application, 2018 and 2028
Figure 16: North America Natural Food Colours Market Y-o-Y Growth Analysis by Application, 2018–2028
Figure 17: North America Natural Food Colours Market Attractiveness Analysis by Application, 2018–2028
Figure 18: North America Natural Food Colours Market Share Analysis by Country, 2018 and 2028
Figure 19: North America Natural Food Colours Market Y-o-Y Growth Analysis by Country, 2018–2028
Figure 20: North America Natural Food Colours Market Attractiveness Analysis by Country, 2018–2028
Figure 21: Latin America Natural Food Colours Market Share Analysis by Pigment Type, 2018 and 2028
Figure 22: Latin America Natural Food Colours Market Y-o-Y Growth Analysis by Pigment Type, 2018–2028
Figure 23: Latin America Natural Food Colours Market Attractiveness Analysis by Pigment Type, 2018–2028
Figure 24: Latin America Natural Food Colours Market Share Analysis by Application, 2018 and 2028
Figure 25: Latin America Natural Food Colours Market Y-o-Y Growth Analysis by Application, 2018–2028
Figure 26: Latin America Natural Food Colours Market Attractiveness Analysis by Application, 2018–2028
Figure 27: Latin America Natural Food Colours Market Share Analysis by Country, 2018 and 2028
Figure 28: Latin America Natural Food Colours Market Y-o-Y Growth Analysis by Country, 2018–2028
Figure 29: Latin America Natural Food Colours Market Attractiveness Analysis by Country, 2018–2028
Figure 30: Western Europe Natural Food Colours Market Share Analysis by Pigment Type, 2018 and 2028
Figure 31: Western Europe Natural Food Colours Market Y-o-Y Growth Analysis by Pigment Type, 2018–2028
Figure 32: Western Europe Natural Food Colours Market Attractiveness Analysis by Pigment Type, 2018–2028
Figure 33: Western Europe Natural Food Colours Market Share Analysis by Application, 2018 and 2028
Figure 34: Western Europe Natural Food Colours Market Y-o-Y Growth Analysis by Application, 2018–2028
Figure 35: Western Europe Natural Food Colours Market Attractiveness Analysis by Application, 2018–2028
Figure 36: Western Europe Natural Food Colours Market Share Analysis by Country, 2018 and 2028
Figure 37: Western Europe Natural Food Colours Market Y-o-Y Growth Analysis by Country, 2018–2028
Figure 38: Western Europe Natural Food Colours Market Attractiveness Analysis by Country, 2018–2028
Figure 39: Eastern Europe Natural Food Colours Market Share Analysis by Pigment Type, 2018 and 2028
Figure 40: Eastern Europe Natural Food Colours Market Y-o-Y Growth Analysis by Pigment Type, 2018–2028
Figure 41: Eastern Europe Natural Food Colours Market Attractiveness Analysis by Pigment Type, 2018–2028
Figure 42: Eastern Europe Natural Food Colours Market Share Analysis by Application, 2018 and 2028
Figure 43: Eastern Europe Natural Food Colours Market Y-o-Y Growth Analysis by Application, 2018–2028
Figure 44: Eastern Europe Natural Food Colours Market Attractiveness Analysis by Application, 2018–2028
Figure 45: Eastern Europe Natural Food Colours Market Share Analysis by Country, 2018 and 2028
Figure 46: Eastern Europe Natural Food Colours Market Y-o-Y Growth Analysis by Country, 2018–2028
Figure 47: Eastern Europe Natural Food Colours Market Attractiveness Analysis by Country, 2018–2028
Figure 48: APEJ Natural Food Colours Market Share Analysis by Pigment Type, 2018 and 2028
Figure 49: APEJ Natural Food Colours Market Y-o-Y Growth Analysis by Pigment Type, 2018–2028
Figure 50: APEJ Natural Food Colours Market Attractiveness Analysis by Pigment Type, 2018–2028
Figure 51: APEJ Natural Food Colours Market Share Analysis by Application, 2018 and 2028
Figure 52: APEJ Natural Food Colours Market Y-o-Y Growth Analysis by Application, 2018–2028
Figure 53: APEJ Natural Food Colours Market Attractiveness Analysis by Application, 2018–2028
Figure 54: APEJ Natural Food Colours Market Share Analysis by Country, 2018 and 2028
Figure 55: APEJ Natural Food Colours Market Y-o-Y Growth Analysis by Country, 2018–2028
Figure 56: APEJ Natural Food Colours Market Attractiveness Analysis by Country, 2018–2028
Figure 57: Japan Natural Food Colours Market Share Analysis by Pigment Type, 2018 and 2028
Figure 58: Japan Natural Food Colours Market Y-o-Y Growth Analysis by Pigment Type, 2018–2028
Figure 59: Japan Natural Food Colours Market Attractiveness Analysis by Pigment Type, 2018–2028
Figure 60: Japan Natural Food Colours Market Share Analysis by Application, 2018 and 2028
Figure 61: Japan Natural Food Colours Market Y-o-Y Growth Analysis by Application, 2018–2028
Figure 62: Japan Natural Food Colours Market Attractiveness Analysis by Application, 2018–2028
Figure 63: MEA Natural Food Colours Market Share Analysis by Pigment Type, 2018 and 2028
Figure 64: MEA Natural Food Colours Market Y-o-Y Growth Analysis by Pigment Type, 2018–2028
Figure 65: MEA Natural Food Colours Market Attractiveness Analysis by Pigment Type, 2018–2028
Figure 66: MEA Natural Food Colours Market Share Analysis by Application, 2018 and 2028
Figure 67: MEA Natural Food Colours Market Y-o-Y Growth Analysis by Application, 2018–2028
Figure 68: MEA Natural Food Colours Market Attractiveness Analysis by Application, 2018–2028
Figure 69: MEA Natural Food Colours Market Share Analysis by Country, 2018 and 2028
Figure 70: MEA Natural Food Colours Market Y-o-Y Growth Analysis by Country, 2018–2028
Figure 71: MEA Natural Food Colours Market Attractiveness Analysis by Country, 2018–2028
Need specific information?
Request CustomizationExplore Food and Beverage Insights
View Reports