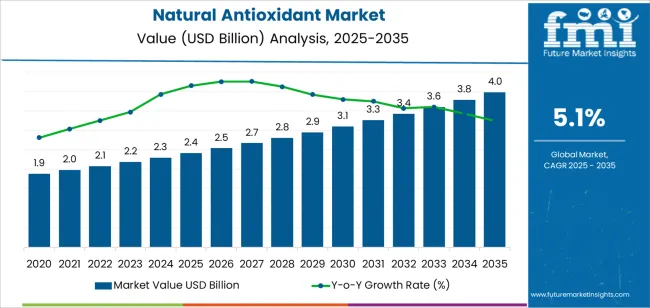
The natural antioxidant market is experiencing robust growth driven by rising consumer preference for clean-label and health-promoting ingredients. Increasing awareness regarding oxidative stress and its link to chronic diseases is encouraging the use of antioxidants derived from natural sources.
Manufacturers are investing in research to improve extraction efficiency and stability of bioactive compounds, enabling broader incorporation into food, beverage, and cosmetic applications. The market is also benefiting from regulatory support for natural additives over synthetic counterparts, along with growing demand for sustainable sourcing and traceable supply chains.
The future outlook indicates consistent expansion supported by innovation in formulation technologies, expanding nutraceutical demand, and widening availability across global markets Growth rationale is built on shifting consumer behavior toward functional wellness products, strategic adoption of natural antioxidants in packaged foods, and technological advancements that enhance product efficacy and shelf life, positioning the sector for long-term profitability and competitive differentiation.
| Metric | Value |
|---|---|
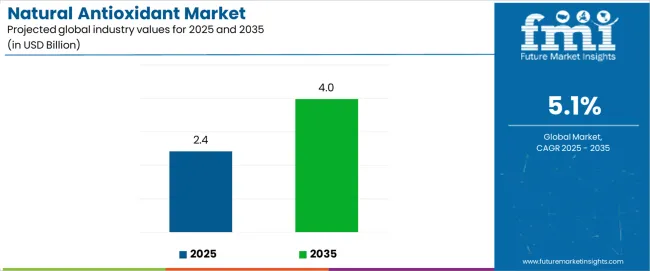
| Natural Antioxidant Market Estimated Value in (2025 E) | USD 2.4 billion |
| Natural Antioxidant Market Forecast Value in (2035 F) | USD 4.0 billion |
| Forecast CAGR (2025 to 2035) | 5.1% |
The market is segmented by Product, Nature, Source, and End Use and region. By Product, the market is divided into Vitamins, Carotenoids, and Polyphenols. In terms of Nature, the market is classified into Organic and Conventional. Based on Source, the market is segmented into Fruits And Vegetables, Herbs And Spices, and Microalgae And Seaweed. By End Use, the market is divided into Food And Beverages, Cosmetics, Nutraceuticals, Pharmaceuticals, and Feed Industry. Regionally, the market is classified into North America, Latin America, Western Europe, Eastern Europe, Balkan & Baltic Countries, Russia & Belarus, Central Asia, East Asia, South Asia & Pacific, and the Middle East & Africa.
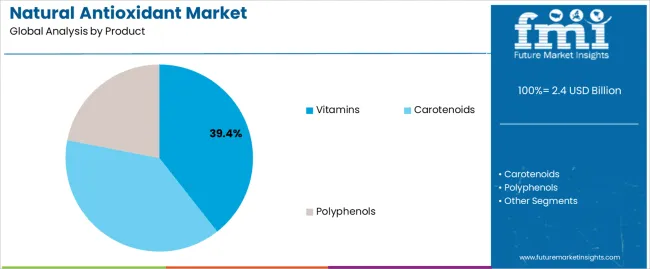
The vitamins segment, accounting for 39.40% of the product category, has maintained a leading position due to its established application in functional foods, dietary supplements, and cosmetics. Its dominance is reinforced by the proven efficacy of vitamin-based antioxidants such as Vitamin C and E in neutralizing free radicals and supporting health maintenance.
The segment has benefited from consistent regulatory approval and strong consumer trust in vitamin formulations. Technological developments in encapsulation and stabilization have improved bioavailability and integration into complex formulations.
Expanding nutraceutical and personal care industries have further elevated product demand Continuous innovation in natural vitamin extraction and formulation techniques is expected to strengthen the segment’s market presence and sustain growth over the forecast horizon.
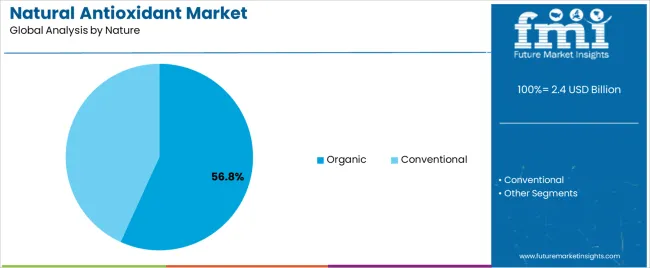
The organic segment, representing 56.80% of the nature category, has been leading due to escalating consumer demand for natural, chemical-free, and sustainably produced ingredients. Market preference is being reinforced by increasing regulatory certification for organic sourcing and heightened consumer awareness regarding purity and environmental impact.
Growth has been supported by supply chain transparency initiatives and premium positioning of organic antioxidants in the functional food and cosmetic sectors. Manufacturers are focusing on certified organic production practices to cater to health-conscious demographics and meet export quality standards.
Continued innovation in organic extraction processes and strong distribution through specialty and online retail channels are expected to maintain the segment’s leadership and reinforce its long-term market advantage.
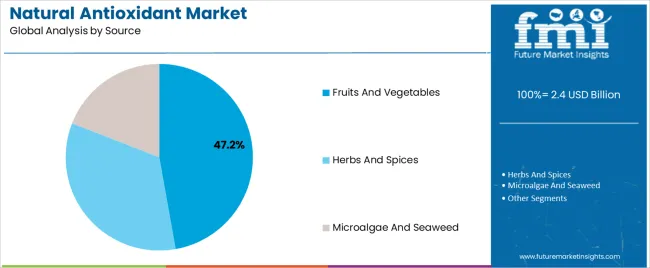
The fruits and vegetables segment, accounting for 47.20% of the source category, has been dominant due to its rich content of polyphenols, flavonoids, and carotenoids, which are widely recognized for their antioxidant potency. The segment’s leadership is driven by increased use of fruit and vegetable extracts in food preservation, dietary supplements, and cosmetic formulations.
Advancements in cold-press and solvent-free extraction technologies have improved yield and bioactivity, supporting broader adoption across industries. Sustainable sourcing and waste valorization from food processing have further contributed to supply stability.
Consumer perception of fruit- and vegetable-derived antioxidants as safe and natural alternatives continues to reinforce demand Expansion in functional beverage and plant-based product lines is expected to sustain growth and consolidate the segment’s position within the global natural antioxidant market.
Global natural antioxidant sales recorded a CAGR of 4.7% from 2020 to 2025. This growth was due to increased health and wellness awareness, significant demand for clean label products, and growing applications across industries. Over the forecast period, the industry is anticipated to expand at a CAGR of 5.1%.
Growing preference for natural ingredients is set to boost sales growth during the projection period. Similarly, expansion of online retail channels and regulatory support for clean label products will likely contribute to industry’s growth.
Industry players are investing in research and development to create new formulations, improve extraction methods, and enhance the efficacy and bioavailability of natural antioxidants. This will likely provide an additional thrust to the industry.
There is a growing demand for natural and functional ingredients due to surging health consciousness, aging populations, and rising prevalence of chronic diseases. This is anticipated to fuel industry expansion. Innovation in product formulations and delivery systems will enable the development of novel antioxidant rich products catering to diverse consumer preferences and emerging market trends.
There is an escalating demand for natural products, including antioxidants. These products are believed to have health benefits such as protecting cells from damage caused by free radicals.
Incidence of chronic diseases such as cancer, diabetes, and cardiovascular diseases is rising globally, thereby creating significant demand for natural antioxidants. These functional ingredients are believed to help reduce the risk of these diseases by neutralizing free radicals in the body.
People are seeking antioxidants extracted from natural sources such as vegetables, fruits, herbs, and spices, as opposed to synthetic alternatives, with a shift towards clean label and natural products. The trend is driving the growth of the natural antioxidant market.
Natural antioxidants are often more expensive to produce than synthetic alternatives. The higher cost of sourcing, extraction, and processing natural antioxidants may limit their adoption, especially in price sensitive markets.
Ensuring the efficacy and stability of natural antioxidants in various formulations and applications presents technical challenges for manufacturers and may impact product quality and consumer acceptance.
Regulatory requirements governing the use of natural antioxidants in food, beverages, cosmetics, and pharmaceuticals can vary by region and country.
Compliance with stringent regulatory standards, labeling requirements, and safety assessments may pose challenges for market entry and expansion, particularly for small and medium sized enterprises lacking resources and expertise in regulatory affairs. This will negatively impact the market.
The following table provides insights into revenues of leading countries. Among these, the United States and Germany are set to witness higher CAGRs through 2035.
| Countries | Forecast CAGRs from 2025 to 2035 |
|---|---|
| The United States | 7.0% |
| Germany | 5.8% |
| China | 3.6% |
| Japan | 4.6% |
| India | 5.3% |
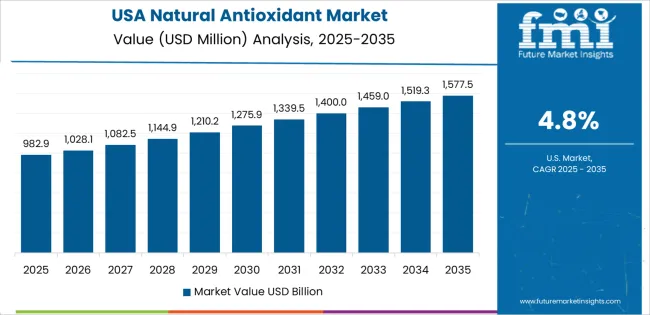
The natural antioxidant market in the United States is likely to expand at a CAGR of 7% through 2035. Thanks to growing health awareness, consumers in the United States are actively seeking out products that offer health benefits beyond basic nutrition. This is providing impetus for industry growth.
Growing prevalence of chronic diseases such as heart disease, cancer, and diabetes are expected to boost sales growth. Natural antioxidants are considered beneficial for overall health and wellness. This is because they can neutralize free radicals and reduce the risk of chronic diseases.
There is also a growing awareness among consumers and healthcare professionals about the role of antioxidants in reducing the risk of chronic diseases and promoting longevity. This will likely drive demand for antioxidant rich products over the next ten years.
Germany’s natural antioxidant market is anticipated to record a CAGR of 5.8% during the assessment period. Consumers in the country have a strong preference for natural and organic products, driven by concerns about health, sustainability, and environmental impact. Natural antioxidants derived from fruits, vegetables, herbs, and spices align with this preference, making them increasingly popular among German consumers.
Germany has stringent regulations governing the use of food additives, including antioxidants. The regulatory framework of the country emphasizes consumer safety and transparency in labeling. Regulatory support for natural antioxidants and clean label products provides a favorable environment for market growth and innovation in Germany.
Natural antioxidant trends in China are taking a turn for the better. A 3.6% CAGR is forecasted from 2025 to 2035. The Chinese government has implemented various initiatives and policies aimed at promoting healthy lifestyles and preventing chronic diseases.
The initiatives include campaigns to encourage consumption of fruits, vegetables, and other antioxidant rich foods, as well as regulations supporting the development and marketing of functional foods and dietary supplements.
The growing middle class population in China is driving demand for premium and health oriented products. Middle class consumers are willing to pay a premium for natural and organic products perceived to be safer, healthier, and of higher quality. This shift is creating opportunities for natural antioxidant products in China.
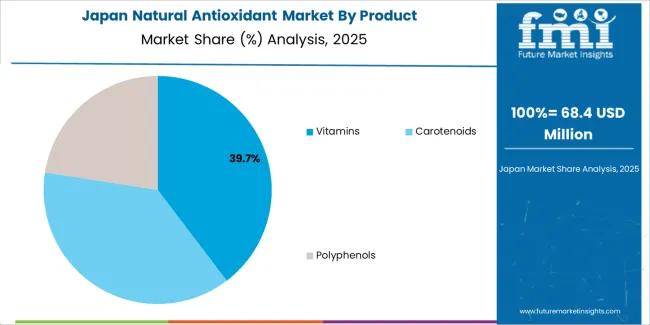
The natural antioxidant market in Japan is poised to expand at a CAGR of 4.6% from 2025 to 2035. Traditional Japanese cuisine, characterized by its emphasis on fresh seafood, vegetables, fruits, and fermented foods, is inherently rich in antioxidants. The popularity of traditional dietary practices such as the consumption of green tea, seaweed, and soy products contributes to demand for natural antioxidants in Japan.
Companies are known for their innovation in the food and beverage industry, particularly in developing new product formulations and technologies. Manufacturers are investing in research and development to create antioxidant rich products that appeal to preferences of Japanese consumers for natural, minimally processed, and convenient foods and beverages.
The natural antioxidant market in India is anticipated to expand at a CAGR of 5.3% through 2035. The nutraceutical industry in India is experiencing significant growth due to rising consumer interest in preventive healthcare and wellness.
Nutraceutical products, including antioxidant rich supplements, functional foods, and dietary ingredients, are gaining traction among health conscious consumers seeking holistic approaches to health management.
Antioxidants are widely used in the beauty and personal care industry for their skin protective and anti-aging properties. The Indian beauty and personal care market is witnessing robust growth, driven by increasing consumer spending on skincare, haircare, and grooming products.
Antioxidant rich formulations derived from natural ingredients are particularly popular among Indian consumers seeking safe and effective beauty solutions.
The below table highlights how vitamins segment is projected to lead the market in terms of product type, and is expected to account for a share of 78.5% in 2025. By source, the fruits and vegetables segment is expected to account for a market share of 41.1% in 2025.
| Category | Market Shares in 2025 |
|---|---|
| Vitamins | 78.5% |
| Fruits and Vegetables | 41.1% |
By product type, vitamins-based natural antioxidants are expected to enjoy higher demand. Increasing consumer awareness of health and wellness, coupled with a growing interest in preventive healthcare, is driving demand for vitamin rich products.
Vitamins, such as vitamin C, vitamin E, and vitamin A, are essential antioxidants that help neutralize free radicals and support overall health and immune function.
The growing popularity of nutritional supplements, including vitamins, minerals, and botanical extracts, is fueling demand for natural antioxidant rich formulations. Consumers are incorporating vitamin supplements into their daily routines to fill nutritional gaps, boost immune health, and combat oxidative stress.
By source, fruits and vegetables are expected to continue dominating the natural antioxidant market, attributed to several key factors. Fruits and vegetables are naturally rich sources of various antioxidants, including vitamins, flavonoids, polyphenols, and carotenoids. The antioxidants help protect plants from oxidative damage and are beneficial for human health when consumed as part of a balanced diet.
The functional food and beverage market is witnessing steady growth as consumers seek products that offer health benefits beyond basic nutrition. Fruits and vegetables are key ingredients in functional foods and beverages fortified with antioxidants, vitamins, and phytochemicals aimed at supporting immune health, promoting longevity, and reducing the risk of chronic diseases.
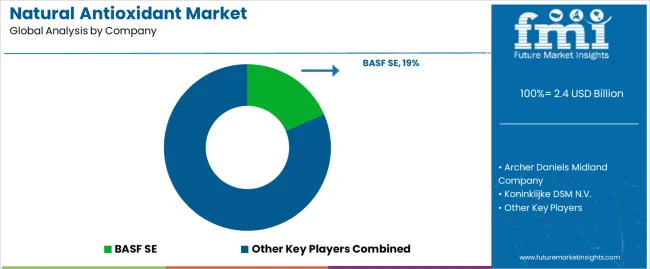
The competitive landscape of the natural antioxidant market is characterized by a diverse array of players, including multinational corporations, regional manufacturers, and niche players specializing in natural ingredients and formulations.
Company Portfolio
| Attribute | Details |
|---|---|
| Estimated Market Size in 2025 | USD 2.4 billion |
| Projected Market Valuation in 2035 | USD 4.0 billion |
| Value-based CAGR 2025 to 2035 | 5.1% |
| Forecast Period | 2025 to 2035 |
| Historical Data Available for | 2020 to 2025 |
| Market Analysis | Value in USD Million |
| Key Regions Covered |
North America; Latin America; Western Europe; Eastern Europe; South Asia and Pacific; East Asia; The Middle East & Africa |
| Key Market Segments Covered |
Product, Nature, Source, End Use, Region |
| Key Countries Profiled |
The United States, Canada, Brazil, Mexico, Germany, France, France, Spain, Italy, Russia, Poland, Czech Republic, Romania, India, Bangladesh, Australia, New Zealand, China, Japan, South Korea, GCC countries, South Africa, Israel |
| Key Companies Profiled |
Ajinomoto Co Inc; Naturex S.A.; Koninklijke DSM N.V.; Adisseo France SAS; BASF SE; du Pont de Nemours and Company; A & B Ingredients Inc., Hansen A/S; The Archer Daniels Midland Company; Cargill Inc.; A and B Ingredients |
The global natural antioxidant market is estimated to be valued at USD 2.4 billion in 2025.
The market size for the natural antioxidant market is projected to reach USD 4.0 billion by 2035.
The natural antioxidant market is expected to grow at a 5.1% CAGR between 2025 and 2035.
The key product types in natural antioxidant market are vitamins, carotenoids and polyphenols.
In terms of nature, organic segment to command 56.8% share in the natural antioxidant market in 2025.


Our Research Products

The "Full Research Suite" delivers actionable market intel, deep dives on markets or technologies, so clients act faster, cut risk, and unlock growth.

The Leaderboard benchmarks and ranks top vendors, classifying them as Established Leaders, Leading Challengers, or Disruptors & Challengers.

Locates where complements amplify value and substitutes erode it, forecasting net impact by horizon

We deliver granular, decision-grade intel: market sizing, 5-year forecasts, pricing, adoption, usage, revenue, and operational KPIs—plus competitor tracking, regulation, and value chains—across 60 countries broadly.

Spot the shifts before they hit your P&L. We track inflection points, adoption curves, pricing moves, and ecosystem plays to show where demand is heading, why it is changing, and what to do next across high-growth markets and disruptive tech

Real-time reads of user behavior. We track shifting priorities, perceptions of today’s and next-gen services, and provider experience, then pace how fast tech moves from trial to adoption, blending buyer, consumer, and channel inputs with social signals (#WhySwitch, #UX).

Partner with our analyst team to build a custom report designed around your business priorities. From analysing market trends to assessing competitors or crafting bespoke datasets, we tailor insights to your needs.
Supplier Intelligence
Discovery & Profiling
Capacity & Footprint
Performance & Risk
Compliance & Governance
Commercial Readiness
Who Supplies Whom
Scorecards & Shortlists
Playbooks & Docs
Category Intelligence
Definition & Scope
Demand & Use Cases
Cost Drivers
Market Structure
Supply Chain Map
Trade & Policy
Operating Norms
Deliverables
Buyer Intelligence
Account Basics
Spend & Scope
Procurement Model
Vendor Requirements
Terms & Policies
Entry Strategy
Pain Points & Triggers
Outputs
Pricing Analysis
Benchmarks
Trends
Should-Cost
Indexation
Landed Cost
Commercial Terms
Deliverables
Brand Analysis
Positioning & Value Prop
Share & Presence
Customer Evidence
Go-to-Market
Digital & Reputation
Compliance & Trust
KPIs & Gaps
Outputs
Full Research Suite comprises of:
Market outlook & trends analysis
Interviews & case studies
Strategic recommendations
Vendor profiles & capabilities analysis
5-year forecasts
8 regions and 60+ country-level data splits
Market segment data splits
12 months of continuous data updates
DELIVERED AS:
PDF EXCEL ONLINE
Natural Refrigerant Chiller Market Size and Share Forecast Outlook 2025 to 2035
Antioxidant Skincare Market Forecast Outlook 2025 to 2035
Natural Disaster Detection IoT Market Forecast Outlook 2025 to 2035
Natural Cosmetic Color Market Size and Share Forecast Outlook 2025 to 2035
Natural Food Preservatives Market Size and Share Forecast Outlook 2025 to 2035
Natural Polymer Market Size and Share Forecast Outlook 2025 to 2035
Antioxidant and Stabilizer Agents Market Size and Share Forecast Outlook 2025 to 2035
Antioxidant-Rich Skincare Market Analysis - Size and Share Forecast Outlook 2025 to 2035
Natural Gas Analyzers Market Size and Share Forecast Outlook 2025 to 2035
Natural Mineral Oil Coolant Market Size and Share Forecast Outlook 2025 to 2035
Natural Synthetic Cytokinin (Anti-zeatin Riboside) Market Size and Share Forecast Outlook 2025 to 2035
Antioxidants Cosmetic Market (Personal Care Actives) Analysis - Size and Share Forecast Outlook 2025 to 2035
Natural Food Flavors Market Size and Share Forecast Outlook 2025 to 2035
Natural Silicone Alternative Market Analysis - Size and Share Forecast Outlook 2025 to 2035
Natural Skincare Preservatives Market Analysis - Size and Share Forecast Outlook 2025 to 2035
Natural Surfactant Market Size and Share Forecast Outlook 2025 to 2035
Antioxidant-Rich Fruit Oils Market Analysis - Size and Share Forecast Outlook 2025 to 2035
Natural Bitterness Blockers Market Analysis - Size And Share Forecast Outlook 2025 To 2035
Antioxidant Premix Market Size and Share Forecast Outlook 2025 to 2035
Antioxidant Drinks Market Size and Share Forecast Outlook 2025 to 2035

Thank you!
You will receive an email from our Business Development Manager. Please be sure to check your SPAM/JUNK folder too.
Chat With
MaRIA