Natural Feed Additives Market Size and Share Forecast Outlook 2025 to 2035

The global natural feed additives market is valued at USD 9.0 billion in 2025 and is expected to reach USD 19.3 billion by 2035, reflecting a CAGR of 7.9%. Factors driving this growth include the increasing demand for protein-rich animal products, rising consumer preference for chemical-free livestock nutrition, and the adoption of sustainable farming practices.
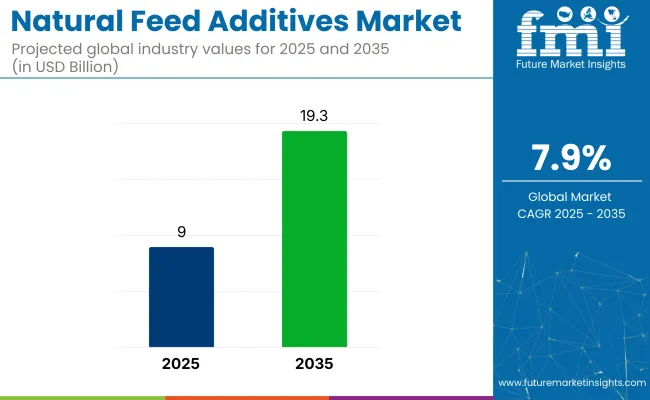
Quick Stats for Natural Feed Additives Market

  • Market Value (2025): USD 9.0 billion
  • Forecast Value (2035): USD 19.3 billion
  • Forecast CAGR: 7.9%
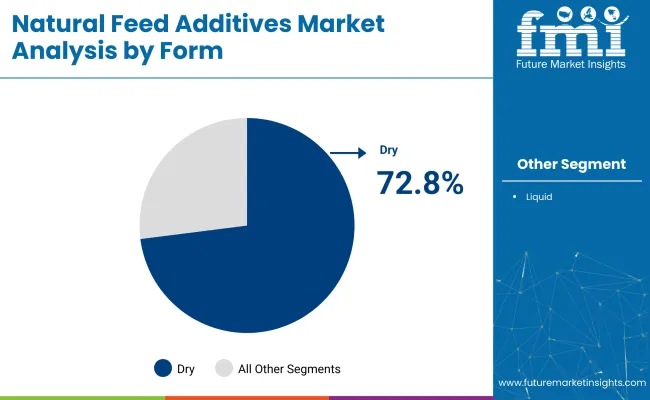
  • Form Leader in 2025: Dry Form Additives (72.8% Market Share)
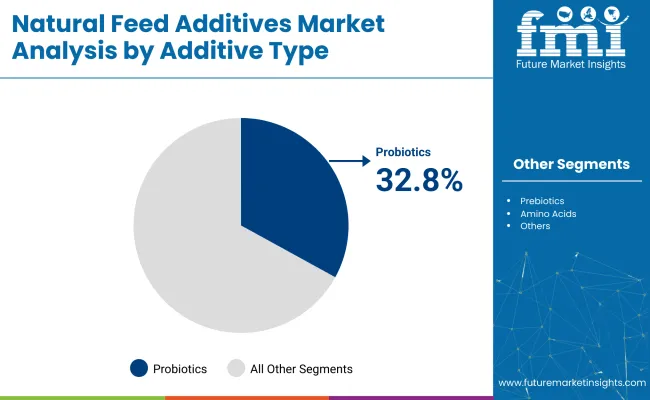
  • Top Additive Type: Probiotics (32.8% market share)
  • Key Growth Region: North America (fastest-growing market in the USA with 6.2% CAGR)

Natural Feed Additives Market

Metric Value
Estimated Size (2025) USD 9.0 billion
Projected Value (2035) USD 19.3 billion
CAGR (2025-2035) 7.9%

Furthermore, the emphasis on precision animal nutrition and functional feed additives is expected to support the market’s expansion across developing and developed economies alike.

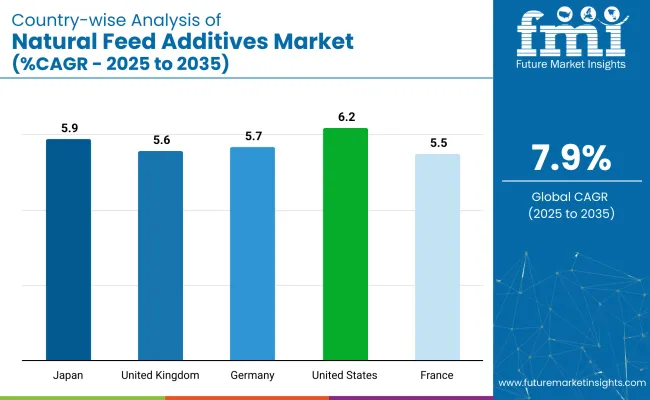
The USA is expected to remain the largest consumer in the natural feed additives market through 2035, flourishing at a CAGR of 6.2%, driven by its large-scale livestock production and high demand for premium meat and dairy. Meanwhile, Japan and Germany closely follow this rapid growth with prominent CAGRs of 5.9% and 5.7% respectively.

Dry form additives will retain their dominance with a 72.8% market share in 2025, while probiotics are expected to lead the additive type category due to their proven role in enhancing digestion and immunity in livestock.

The natural feed additives market holds approximately 20-25% of the broader feed additives market, reflecting the ongoing shift toward sustainable and chemical-free livestock nutrition. Within the animal feed market, it accounts for roughly 8-10%, as conventional additives still dominate in volume.

In the livestock nutrition market, natural feed additives contribute around 15%, driven by demand for species-specific, health-boosting formulations. Its share in the sustainable agriculture market is modest, estimated at 5-7%, as it represents just one input category. Overall, the market’s influence is growing steadily as regulatory pressures and consumer preferences increasingly favor natural and eco-friendly feed solutions.

The path forward is marked by increased emphasis on plant-based ingredients, functional additives, and eco-friendly solutions, including algae-based and seaweed-based formulations. Innovations in extraction technologies, precision nutrition systems, and regulatory encouragement for clean-label feed inputs are driving the market. Supportive policies aimed at reducing antibiotic use and enhancing animal welfare are expected to accelerate further product innovation and global adoption of natural feed additives across all livestock categories.

Analyzing Natural Feed Additives Market by Top Investment Segments

The market is segmented based on livestock, form, additive type, and region. In terms of livestock, the market is categorized into ruminant, poultry, swine, aquaculture, and pets. By form, the segmentation includes dry and liquid formulations.

The additive type segment comprises prebiotics, probiotics, vitamins & minerals, amino acids, enzymes, and others, where "others" includes organic acids, essential oils, and herbal extracts. Regionally, the market is analyzed across North America, Latin America, Western Europe, Eastern Europe, the Balkans & Baltic, Russia & Belarus, Central Asia, East Asia, South Asia & Pacific, and the Middle East & Africa.

By Livestock, Poultry Segment is expected to Account for 41.2% of the Market Share in 2025

Poultry is projected to remain the dominant livestock category due to its high demand in global meat and egg production. Rising health concerns and affordability of poultry protein are prompting producers to invest in advanced natural feed solutions to boost immune function, gut health, and feed efficiency in broilers and layers.

  • Strong demand for organic eggs and antibiotic-free meat boosts adoption
  • Broilers see greater feed conversion gains from additive integration
  • Emerging Asian economies investing heavily in poultry nutrition innovation

By Form, Dry Segment to Remain Most Lucrative with 72.8% Share in 2025

The dry form is expected to dominate the form type with 72.8% of the market share due to advantages in handling, stability, and ease of dosage. Dry additives are favored in large-scale livestock operations because they reduce the risk of spoilage and simplify storage and transportation. The longer shelf-life and consistent nutrient delivery make dry formulations ideal for commercial use across all livestock categories, particularly poultry and swine.
  • Longer shelf-life and ease of storage drive preference
  • Reduced contamination risk during transportation
  • Compatible with automated feeding systems in large farms

Natural Feed Additives Market Analysis By Form

By Additive Type, the Probiotics Segment Accounts for 32.8% of the Market Share in 2025

Probiotics are likely to be the most adopted additive type due to their multifunctional benefits, such as improved digestion, immune modulation, and reduced disease incidence. Their effectiveness in intensive livestock farming, particularly poultry and swine, has led to widespread adoption. The trend toward replacing antibiotics with natural gut-health enhancers also favors probiotics.
  • Supports gut microbiota balance and nutrient absorption
  • Helps reduce reliance on antibiotic growth promoters
  • Broad regulatory support for probiotic use in animal feed

Natural Feed Additives Market Analysis By Additive Type

Top Natural Feed Additives Market Dynamics

Recent Trends in the Natural Feed Additives Market

  • Rising use of plant-based additives such as herbs, spices, and essential oils for sustainable livestock nutrition
  • Surge in demand for probiotics and functional feed to replace antibiotic growth promoters
  • Increased adoption of precision nutrition and species-specific formulations by manufacturers
  • Growth in algae- and seaweed-derived additives due to their nutritional density and eco-friendly sourcing

Key Challenges in the Natural Feed Additives Market
  • High cost of natural ingredients compared to synthetic alternatives
  • Limited shelf life and storage challenges for certain natural formulations
  • Variability in regulatory standards across regions is impacting global trade
  • Lack of farmer awareness and education in emerging markets regarding long-term benefits

Analyzing Top Countries Producing and Supplying Natural Feed Additives

Country Wise Analysis Of Natural Feed Additives Market

Among the top five countries in the natural feed additives market, the USA leads in overall market size with a CAGR of 6.2% from 2025 to 2035, driven by strong consumer demand for antibiotic-free protein. Japan follows with a CAGR of 5.9%, supported by innovation in marine-based additives and precision feeding.

Germany and the UK exhibit steady growth at 5.7% and 5.6% respectively, reflecting robust regulations and sustainability initiatives. France, with a CAGR of 5.5%, shows slightly slower but stable expansion. While the USA leads in volume, Japan shows the fastest innovation-led growth per capita within this segment.

The report covers an in-depth analysis of 40+ countries, five top-performing OECD countries are highlighted below.

United States Natural Feed Additives Market Analysis

The natural feed additives revenue in the USA is anticipated to grow at a CAGR of 6.2% from 2025 to 2035. The country remains one of the largest consumers of natural feed additives due to its expansive livestock industry and strong consumer demand for antibiotic-free meat, dairy, and eggs.

  • Increasing demand for premium and organic animal proteins.
  • Strong focus on replacing antibiotics with natural alternatives.
  • Established distribution and regulatory infrastructure for feed products.

Natural Feed Additives Demand Analysis in the UK

The sales of natural feed additives in the UK are projected to expand at a CAGR of 5.6% between 2025 and 2035. Demand is largely driven by consumer preferences for ethically sourced meat and dairy products, which has led to increased adoption of herbal and plant-based feed additives.

  • Consumer preference for chemical-free livestock diets is rising.
  • Regulations favoring organic and natural animal feed ingredients.
  • Adoption of precision nutrition solutions in commercial farms.

Germany Natural Feed Additives Sales Analysis

The natural feed additives market in Germany is slated to grow at a CAGR of 5.7% through 2035. The country’s leadership in biotechnology and sustainable agriculture positions it as a hub for innovation in feed solutions.

  • Strong emphasis on biotechnology and animal welfare.
  • Growing investments in functional and eco-friendly additives.
  • Export-oriented livestock industry driving feed innovation.

Natural Feed Additives Demand Analysis in France

The revenue from natural feed additives in France is anticipated to growat a CAGR of 5.5% between 2025 and 2035. With a well-established livestock sector and heightened consumer focus on sustainable farming, France is investing in advanced feed technologies.

  • Supportive regulations for antibiotic-free animal production.
  • High demand for traceable and premium livestock products.
  • Development of regional supply chains for herbal feed inputs.

Japan Natural Feed Additives Sales Analysis

The natural feed additives market in Japan is forecast to expand at a CAGR of 5.9% from 2025 to 2035. With limited arable land, the country relies heavily on efficient livestock nutrition to optimize productivity.

  • Focus on quality and nutrient-dense livestock outputs.
  • Increasing integration of seaweed and algae-based additives.
  • Adoption of automated and precision livestock feeding systems.

Leading Natural Feed Additive Suppliers

The market is moderately consolidated, with multinational players such as Cargill, DSM-Firmenich, Evonik, BASF, and ADM commanding a significant portion of global revenue. These top-tier companies lead the industry through expansive global footprints, technological innovation, and strategic collaborations. Mid-sized players like Nutreco, Kemin Industries, and Novozymes also maintain strong regional positions by focusing on specialized additives and species-specific formulations.

Company strategies have increasingly emphasized sustainable sourcing, plant-based solutions, and post-antibiotic alternatives to meet growing consumer and regulatory demands. Leading suppliers are investing in proprietary probiotic strains, postbiotic innovation, precision nutrition platforms, and digitized feed management systems.

Firms are also restructuring operations to improve cost-efficiency amid commodity price volatility. Collaborations with agri-tech firms and biotechnology providers have accelerated the rollout of high-value feed solutions targeting specific animal health benefits and performance metrics.

Recent Natural Feed Additives Industry News

Cargill launched the NOTOX brand, including Notox AMA, a new anti-mycotoxin agent designed to protect poultry gut health and improve animal performance. This innovation was presented at the World Mycotoxin Forum in April 2025, based on research from over 400,000 global feed analyses.

Natural Feed Additives Market Report Scope

Report Attributes Details
Current Total Market Size (2025) USD 9.0 billion
Projected Market Size (2035) USD 19.3 billion
CAGR (2025 to 2035) 7.9%
Base Year for Estimation 2024
Historical Period 2020 to 2024
Projections Period 2025 to 2035
Market Analysis Parameters Revenue in USD billions/Volume in Kilotons
By Livestock Ruminant, Poultry, Swine, Aquaculture, Pets
By Form Dry, Liquid
By Additive Type Prebiotics, Probiotics, Vitamins & Minerals, Amino Acids, Enzymes, Others (organic acids, essential oils, herbal extracts)
Regions Covered North America, Latin America, Western Europe, Eastern Europe, Balkans & Baltic, Russia & Belarus, Central Asia, East Asia, South Asia & Pacific, Middle East & Africa
Countries Covered United States, Canada, United Kingdom, Germany, France, China, Japan, South Korea, Brazil, Australia
Key Players Cargill, Incorporated, Archer Daniels Midland Co, DuPont de Nemours, Inc, Evonik Industries AG, Koninklijke DSM N.V., For Farmers, Pestell Nutrition, BASF, Novozymes, CHR. Hensen, Tegasa, BRF Ingredients, Nutreco, Kemin Industries, Bentoli
Additional Attributes Dollar sales by value, market share analysis by region, and country-wise analysis

Key Segmentation

By Livestock:

By livestock industry has been categorised into Ruminant, Poultry, Swine, Aquaculture and Pets.

By Form:

Two different forms Dry and Liquid are included in the report.

By Additive Type:

Additive types like Prebiotics, Probiotics, Vitamins & Minerals, Amino Acids, Enzymes and Others are considered after an exhaustive research.

By Region:

Industry analysis has been carried out in key countries of North America, Latin America, Europe, Middle East and Africa, East Asia, South Asia, and Oceania

Table of Content

  1. Executive Summary
    • Global Market Outlook
    • Demand-side Trends
    • Supply-side Trends
    • Technology Roadmap Analysis
    • Analysis and Recommendations
  2. Market Overview
    • Market Coverage/Taxonomy
    • Market Definition/Scope/Limitations
  3. Market Background
    • Market Dynamics
      • Drivers
      • Restraints
      • Opportunity
      • Trends
    • Scenario Forecast
      • Demand in Optimistic Scenario
      • Demand in Likely Scenario
      • Demand in Conservative Scenario
    • Opportunity Map Analysis
    • Product Life Cycle Analysis
    • Supply Chain Analysis
      • Supply Side Participants and their Roles
        • Producers
        • Mid-Level Participants (Traders/ Agents/ Brokers)
        • Wholesalers and Distributors
      • Value Added and Value Created at Node in the Supply Chain
      • List of Raw Material Suppliers
      • List of Existing and Potential Buyer’s
    • Investment Feasibility Matrix
    • Value Chain Analysis
      • Profit Margin Analysis
      • Wholesalers and Distributors
      • Retailers
    • PESTLE and Porter’s Analysis
    • Regulatory Landscape
      • By Key Regions
      • By Key Countries
    • Regional Parent Market Outlook
    • Production and Consumption Statistics
    • Import and Export Statistics
  4. Global Market Analysis 2020 to 2024 and Forecast, 2025 to 2035
    • Historical Market Size Value (USD Billion) & Volume (kilotons) Analysis, 2020 to 2024
    • Current and Future Market Size Value (USD Billion) & Volume (kilotons) Projections, 2025 to 2035
      • Y-o-Y Growth Trend Analysis
      • Absolute $ Opportunity Analysis
  5. Global Market Pricing Analysis 2020 to 2024 and Forecast 2025 to 2035
  6. Global Market Analysis 2020 to 2024 and Forecast 2025 to 2035, By Livestock
    • Introduction/Key Findings
    • Historical Market Size Value (USD Billion) & Volume (kilotons) Analysis By Livestock, 2020 to 2024
    • Current and Future Market Size Value (USD Billion) & Volume (kilotons) Analysis and Forecast By Livestock, 2025 to 2035
      • Ruminant
      • Poultry
      • Swine
      • Aquaculture
      • Pets
    • Y-o-Y Growth Trend Analysis By Livestock, 2020 to 2024
    • Absolute $ Opportunity Analysis By Livestock, 2025 to 2035
  7. Global Market Analysis 2020 to 2024 and Forecast 2025 to 2035, By Form
    • Introduction/Key Findings
    • Historical Market Size Value (USD Billion) & Volume (kilotons) Analysis By Form, 2020 to 2024
    • Current and Future Market Size Value (USD Billion) & Volume (kilotons) Analysis and Forecast By Form, 2025 to 2035
      • Dry
      • Liquid
    • Y-o-Y Growth Trend Analysis By Form, 2020 to 2024
    • Absolute $ Opportunity Analysis By Form, 2025 to 2035
  8. Global Market Analysis 2020 to 2024 and Forecast 2025 to 2035, By Additive Type
    • Introduction/Key Findings
    • Historical Market Size Value (USD Billion) & Volume (kilotons) Analysis By Additive Type, 2020 to 2024
    • Current and Future Market Size Value (USD Billion) & Volume (kilotons) Analysis and Forecast By Additive Type, 2025 to 2035
      • Prebiotics
      • Probiotics
      • Vitamins & Minerals
      • Amino Acids
      • Enzymes
      • Others
    • Y-o-Y Growth Trend Analysis By Additive Type, 2020 to 2024
    • Absolute $ Opportunity Analysis By Additive Type, 2025 to 2035
  9. Global Market Analysis 2020 to 2024 and Forecast 2025 to 2035, By Region
    • Introduction
    • Historical Market Size Value (USD Billion) & Volume (kilotons) Analysis By Region, 2020 to 2024
    • Current Market Size Value (USD Billion) & Volume (kilotons) Analysis and Forecast By Region, 2025 to 2035
      • North America
      • Latin America
      • Western Europe
      • Eastern Europe
      • East Asia
      • South Asia & Pacific
      • Middle East and Africa
    • Market Attractiveness Analysis By Region
  10. North America Market Analysis 2020 to 2024 and Forecast 2025 to 2035, By Country
    • Historical Market Size Value (USD Billion) & Volume (kilotons) Trend Analysis By Market Taxonomy, 2020 to 2024
    • Market Size Value (USD Billion) & Volume (kilotons) Forecast By Market Taxonomy, 2025 to 2035
      • By Country
        • USA
        • Canada
        • Mexico
      • By Livestock
      • By Form
      • By Additive Type
    • Market Attractiveness Analysis
      • By Country
      • By Livestock
      • By Form
      • By Additive Type
    • Key Takeaways
  11. Latin America Market Analysis 2020 to 2024 and Forecast 2025 to 2035, By Country
    • Historical Market Size Value (USD Billion) & Volume (kilotons) Trend Analysis By Market Taxonomy, 2020 to 2024
    • Market Size Value (USD Billion) & Volume (kilotons) Forecast By Market Taxonomy, 2025 to 2035
      • By Country
        • Brazil
        • Argentina
        • Rest of LATAM
      • By Livestock
      • By Form
      • By Additive Type
    • Market Attractiveness Analysis
      • By Country
      • By Livestock
      • By Form
      • By Additive Type
    • Key Takeaways
  12. Western Europe Market Analysis 2020 to 2024 and Forecast 2025 to 2035, By Country
    • Historical Market Size Value (USD Billion) & Volume (kilotons) Trend Analysis By Market Taxonomy, 2020 to 2024
    • Market Size Value (USD Billion) & Volume (kilotons) Forecast By Market Taxonomy, 2025 to 2035
      • By Country
        • Germany
        • Italy
        • France
        • UK
        • Spain
        • BENELUX
        • Nordic
        • Rest of W.Europe
      • By Livestock
      • By Form
      • By Additive Type
    • Market Attractiveness Analysis
      • By Country
      • By Livestock
      • By Form
      • By Additive Type
    • Key Takeaways
  13. Eastern Europe Market Analysis 2020 to 2024 and Forecast 2025 to 2035, By Country
    • Historical Market Size Value (USD Billion) & Volume (kilotons) Trend Analysis By Market Taxonomy, 2020 to 2024
    • Market Size Value (USD Billion) & Volume (kilotons) Forecast By Market Taxonomy, 2025 to 2035
      • By Country
        • Russia
        • Hungary
        • Poland
        • Balkan & Baltics
        • Rest of E. Europe
      • By Livestock
      • By Form
      • By Additive Type
    • Market Attractiveness Analysis
      • By Country
      • By Livestock
      • By Form
      • By Additive Type
    • Key Takeaways
  14. East Asia Market Analysis 2020 to 2024 and Forecast 2025 to 2035, By Country
    • Historical Market Size Value (USD Billion) & Volume (kilotons) Trend Analysis By Market Taxonomy, 2020 to 2024
    • Market Size Value (USD Billion) & Volume (kilotons) Forecast By Market Taxonomy, 2025 to 2035
      • By Country
        • China
        • Japan
        • South Korea
      • By Livestock
      • By Form
      • By Additive Type
    • Market Attractiveness Analysis
      • By Country
      • By Livestock
      • By Form
      • By Additive Type
    • Key Takeaways
  15. South Asia & Pacific Market Analysis 2020 to 2024 and Forecast 2025 to 2035, By Country
    • Historical Market Size Value (USD Billion) & Volume (kilotons) Trend Analysis By Market Taxonomy, 2020 to 2024
    • Market Size Value (USD Billion) & Volume (kilotons) Forecast By Market Taxonomy, 2025 to 2035
      • By Country
        • India
        • Australia & New Zealand
        • ASEAN
        • Rest of SAP
      • By Livestock
      • By Form
      • By Additive Type
    • Market Attractiveness Analysis
      • By Country
      • By Livestock
      • By Form
      • By Additive Type
    • Key Takeaways
  16. Middle East and Africa Market Analysis 2020 to 2024 and Forecast 2025 to 2035, By Country
    • Historical Market Size Value (USD Billion) & Volume (kilotons) Trend Analysis By Market Taxonomy, 2020 to 2024
    • Market Size Value (USD Billion) & Volume (kilotons) Forecast By Market Taxonomy, 2025 to 2035
      • By Country
        • GCC Countries
        • Northern Africa
        • South Africa
        • Turkiye
        • Rest of MEA
      • By Livestock
      • By Form
      • By Additive Type
    • Market Attractiveness Analysis
      • By Country
      • By Livestock
      • By Form
      • By Additive Type
    • Key Takeaways
  17. Key Countries Market Analysis
    • USA
      • Pricing Analysis
      • Market Share Analysis, 2024
        • By Livestock
        • By Form
        • By Additive Type
    • Canada
      • Pricing Analysis
      • Market Share Analysis, 2024
        • By Livestock
        • By Form
        • By Additive Type
    • Brazil
      • Pricing Analysis
      • Market Share Analysis, 2024
        • By Livestock
        • By Form
        • By Additive Type
    • Mexico
      • Pricing Analysis
      • Market Share Analysis, 2024
        • By Livestock
        • By Form
        • By Additive Type
    • Argentina
      • Pricing Analysis
      • Market Share Analysis, 2024
        • By Livestock
        • By Form
        • By Additive Type
  18. Market Structure Analysis
    • Competition Dashboard
    • Competition Benchmarking
    • Market Share Analysis of Top Players
      • By Regional
      • By Livestock
      • By Form
      • By Additive Type
  19. Competition Analysis
    • Competition Deep Dive
      • Cargill, Incorporated
        • Overview
        • Product Portfolio
        • Profitability by Market Segments (Product/Age /Sales Channel/Region)
        • Sales Footprint
        • Strategy Overview
          • Marketing Strategy
          • Product Strategy
          • Channel Strategy
      • Archer Daniels Midland Co
        • Overview
        • Product Portfolio
        • Profitability by Market Segments (Product/Age /Sales Channel/Region)
        • Sales Footprint
        • Strategy Overview
          • Marketing Strategy
          • Product Strategy
          • Channel Strategy
      • DuPont de Nemours, Inc
        • Overview
        • Product Portfolio
        • Profitability by Market Segments (Product/Age /Sales Channel/Region)
        • Sales Footprint
        • Strategy Overview
          • Marketing Strategy
          • Product Strategy
          • Channel Strategy
      • Evonik Industries AG
        • Overview
        • Product Portfolio
        • Profitability by Market Segments (Product/Age /Sales Channel/Region)
        • Sales Footprint
        • Strategy Overview
          • Marketing Strategy
          • Product Strategy
          • Channel Strategy
      • Koninklijke DSM N.V.
        • Overview
        • Product Portfolio
        • Profitability by Market Segments (Product/Age /Sales Channel/Region)
        • Sales Footprint
        • Strategy Overview
          • Marketing Strategy
          • Product Strategy
          • Channel Strategy
      • ForFarmers
        • Overview
        • Product Portfolio
        • Profitability by Market Segments (Product/Age /Sales Channel/Region)
        • Sales Footprint
        • Strategy Overview
          • Marketing Strategy
          • Product Strategy
          • Channel Strategy
      • Pestell Nutrition
        • Overview
        • Product Portfolio
        • Profitability by Market Segments (Product/Age /Sales Channel/Region)
        • Sales Footprint
        • Strategy Overview
          • Marketing Strategy
          • Product Strategy
          • Channel Strategy
      • BASF
        • Overview
        • Product Portfolio
        • Profitability by Market Segments (Product/Age /Sales Channel/Region)
        • Sales Footprint
        • Strategy Overview
          • Marketing Strategy
          • Product Strategy
          • Channel Strategy
      • Novozymes
        • Overview
        • Product Portfolio
        • Profitability by Market Segments (Product/Age /Sales Channel/Region)
        • Sales Footprint
        • Strategy Overview
          • Marketing Strategy
          • Product Strategy
          • Channel Strategy
      • CHR. Hensen
        • Overview
        • Product Portfolio
        • Profitability by Market Segments (Product/Age /Sales Channel/Region)
        • Sales Footprint
        • Strategy Overview
          • Marketing Strategy
          • Product Strategy
          • Channel Strategy
      • Tegasa
        • Overview
        • Product Portfolio
        • Profitability by Market Segments (Product/Age /Sales Channel/Region)
        • Sales Footprint
        • Strategy Overview
          • Marketing Strategy
          • Product Strategy
          • Channel Strategy
      • BRF Ingredients
        • Overview
        • Product Portfolio
        • Profitability by Market Segments (Product/Age /Sales Channel/Region)
        • Sales Footprint
        • Strategy Overview
          • Marketing Strategy
          • Product Strategy
          • Channel Strategy
      • Nutreco
        • Overview
        • Product Portfolio
        • Profitability by Market Segments (Product/Age /Sales Channel/Region)
        • Sales Footprint
        • Strategy Overview
          • Marketing Strategy
          • Product Strategy
          • Channel Strategy
      • Kemin Industries
        • Overview
        • Product Portfolio
        • Profitability by Market Segments (Product/Age /Sales Channel/Region)
        • Sales Footprint
        • Strategy Overview
          • Marketing Strategy
          • Product Strategy
          • Channel Strategy
      • Bentoli
        • Overview
        • Product Portfolio
        • Profitability by Market Segments (Product/Age /Sales Channel/Region)
        • Sales Footprint
        • Strategy Overview
          • Marketing Strategy
          • Product Strategy
          • Channel Strategy
      • Others
        • Overview
        • Product Portfolio
        • Profitability by Market Segments (Product/Age /Sales Channel/Region)
        • Sales Footprint
        • Strategy Overview
          • Marketing Strategy
          • Product Strategy
          • Channel Strategy
  20. Assumptions & Acronyms Used
  21. Research Methodology

List of Tables

  • Table 1: Global Market Value (USD Billion) Forecast by Region, 2020-2035
  • Table 2: Global Market Volume (kilotons) Forecast by Region, 2020-2035
  • Table 3: Global Market Value (USD Billion) Forecast by Livestock, 2020-2035
  • Table 4: Global Market Volume (kilotons) Forecast by Livestock, 2020-2035
  • Table 5: Global Market Value (USD Billion) Forecast by Form, 2020-2035
  • Table 6: Global Market Volume (kilotons) Forecast by Form, 2020-2035
  • Table 7: Global Market Value (USD Billion) Forecast by Additive Type, 2020-2035
  • Table 8: Global Market Volume (kilotons) Forecast by Additive Type, 2020-2035
  • Table 9: North America Market Value (USD Billion) Forecast by Country, 2020-2035
  • Table 10: North America Market Volume (kilotons) Forecast by Country, 2020-2035
  • Table 11: North America Market Value (USD Billion) Forecast by Livestock, 2020-2035
  • Table 12: North America Market Volume (kilotons) Forecast by Livestock, 2020-2035
  • Table 13: North America Market Value (USD Billion) Forecast by Form, 2020-2035
  • Table 14: North America Market Volume (kilotons) Forecast by Form, 2020-2035
  • Table 15: North America Market Value (USD Billion) Forecast by Additive Type, 2020-2035
  • Table 16: North America Market Volume (kilotons) Forecast by Additive Type, 2020-2035
  • Table 17: Latin America Market Value (USD Billion) Forecast by Country, 2020-2035
  • Table 18: Latin America Market Volume (kilotons) Forecast by Country, 2020-2035
  • Table 19: Latin America Market Value (USD Billion) Forecast by Livestock, 2020-2035
  • Table 20: Latin America Market Volume (kilotons) Forecast by Livestock, 2020-2035
  • Table 21: Latin America Market Value (USD Billion) Forecast by Form, 2020-2035
  • Table 22: Latin America Market Volume (kilotons) Forecast by Form, 2020-2035
  • Table 23: Latin America Market Value (USD Billion) Forecast by Additive Type, 2020-2035
  • Table 24: Latin America Market Volume (kilotons) Forecast by Additive Type, 2020-2035
  • Table 25: Western Europe Market Value (USD Billion) Forecast by Country, 2020-2035
  • Table 26: Western Europe Market Volume (kilotons) Forecast by Country, 2020-2035
  • Table 27: Western Europe Market Value (USD Billion) Forecast by Livestock, 2020-2035
  • Table 28: Western Europe Market Volume (kilotons) Forecast by Livestock, 2020-2035
  • Table 29: Western Europe Market Value (USD Billion) Forecast by Form, 2020-2035
  • Table 30: Western Europe Market Volume (kilotons) Forecast by Form, 2020-2035
  • Table 31: Western Europe Market Value (USD Billion) Forecast by Additive Type, 2020-2035
  • Table 32: Western Europe Market Volume (kilotons) Forecast by Additive Type, 2020-2035
  • Table 33: Eastern Europe Market Value (USD Billion) Forecast by Country, 2020-2035
  • Table 34: Eastern Europe Market Volume (kilotons) Forecast by Country, 2020-2035
  • Table 35: Eastern Europe Market Value (USD Billion) Forecast by Livestock, 2020-2035
  • Table 36: Eastern Europe Market Volume (kilotons) Forecast by Livestock, 2020-2035
  • Table 37: Eastern Europe Market Value (USD Billion) Forecast by Form, 2020-2035
  • Table 38: Eastern Europe Market Volume (kilotons) Forecast by Form, 2020-2035
  • Table 39: Eastern Europe Market Value (USD Billion) Forecast by Additive Type, 2020-2035
  • Table 40: Eastern Europe Market Volume (kilotons) Forecast by Additive Type, 2020-2035
  • Table 41: East Asia Market Value (USD Billion) Forecast by Country, 2020-2035
  • Table 42: East Asia Market Volume (kilotons) Forecast by Country, 2020-2035
  • Table 43: East Asia Market Value (USD Billion) Forecast by Livestock, 2020-2035
  • Table 44: East Asia Market Volume (kilotons) Forecast by Livestock, 2020-2035
  • Table 45: East Asia Market Value (USD Billion) Forecast by Form, 2020-2035
  • Table 46: East Asia Market Volume (kilotons) Forecast by Form, 2020-2035
  • Table 47: East Asia Market Value (USD Billion) Forecast by Additive Type, 2020-2035
  • Table 48: East Asia Market Volume (kilotons) Forecast by Additive Type, 2020-2035
  • Table 49: South Asia & Pacific Market Value (USD Billion) Forecast by Country, 2020-2035
  • Table 50: South Asia & Pacific Market Volume (kilotons) Forecast by Country, 2020-2035
  • Table 51: South Asia & Pacific Market Value (USD Billion) Forecast by Livestock, 2020-2035
  • Table 52: South Asia & Pacific Market Volume (kilotons) Forecast by Livestock, 2020-2035
  • Table 53: South Asia & Pacific Market Value (USD Billion) Forecast by Form, 2020-2035
  • Table 54: South Asia & Pacific Market Volume (kilotons) Forecast by Form, 2020-2035
  • Table 55: South Asia & Pacific Market Value (USD Billion) Forecast by Additive Type, 2020-2035
  • Table 56: South Asia & Pacific Market Volume (kilotons) Forecast by Additive Type, 2020-2035
  • Table 57: Middle East and Africa Market Value (USD Billion) Forecast by Country, 2020-2035
  • Table 58: Middle East and Africa Market Volume (kilotons) Forecast by Country, 2020-2035
  • Table 59: Middle East and Africa Market Value (USD Billion) Forecast by Livestock, 2020-2035
  • Table 60: Middle East and Africa Market Volume (kilotons) Forecast by Livestock, 2020-2035
  • Table 61: Middle East and Africa Market Value (USD Billion) Forecast by Form, 2020-2035
  • Table 62: Middle East and Africa Market Volume (kilotons) Forecast by Form, 2020-2035
  • Table 63: Middle East and Africa Market Value (USD Billion) Forecast by Additive Type, 2020-2035
  • Table 64: Middle East and Africa Market Volume (kilotons) Forecast by Additive Type, 2020-2035

List of Figures

  • Figure 1: Global Market Volume (kilotons) Forecast 2020-2035
  • Figure 2: Global Market Pricing Analysis
  • Figure 3: Global Market Value (USD Billion) Forecast 2020-2035
  • Figure 4: Global Market Value Share and BPS Analysis by Livestock, 2025 and 2035
  • Figure 5: Global Market Y-o-Y Growth Comparison by Livestock, 2025-2035
  • Figure 6: Global Market Attractiveness Analysis by Livestock
  • Figure 7: Global Market Value Share and BPS Analysis by Form, 2025 and 2035
  • Figure 8: Global Market Y-o-Y Growth Comparison by Form, 2025-2035
  • Figure 9: Global Market Attractiveness Analysis by Form
  • Figure 10: Global Market Value Share and BPS Analysis by Additive Type, 2025 and 2035
  • Figure 11: Global Market Y-o-Y Growth Comparison by Additive Type, 2025-2035
  • Figure 12: Global Market Attractiveness Analysis by Additive Type
  • Figure 13: Global Market Value (USD Billion) Share and BPS Analysis by Region, 2025 and 2035
  • Figure 14: Global Market Y-o-Y Growth Comparison by Region, 2025-2035
  • Figure 15: Global Market Attractiveness Analysis by Region
  • Figure 16: North America Market Incremental $ Opportunity, 2025-2035
  • Figure 17: Latin America Market Incremental $ Opportunity, 2025-2035
  • Figure 18: Western Europe Market Incremental $ Opportunity, 2025-2035
  • Figure 19: Eastern Europe Market Incremental $ Opportunity, 2025-2035
  • Figure 20: East Asia Market Incremental $ Opportunity, 2025-2035
  • Figure 21: South Asia & Pacific Market Incremental $ Opportunity, 2025-2035
  • Figure 22: Middle East and Africa Market Incremental $ Opportunity, 2025-2035
  • Figure 23: North America Market Value Share and BPS Analysis by Country, 2025 and 2035
  • Figure 24: North America Market Value Share and BPS Analysis by Livestock, 2025 and 2035
  • Figure 25: North America Market Y-o-Y Growth Comparison by Livestock, 2025-2035
  • Figure 26: North America Market Attractiveness Analysis by Livestock
  • Figure 27: North America Market Value Share and BPS Analysis by Form, 2025 and 2035
  • Figure 28: North America Market Y-o-Y Growth Comparison by Form, 2025-2035
  • Figure 29: North America Market Attractiveness Analysis by Form
  • Figure 30: North America Market Value Share and BPS Analysis by Additive Type, 2025 and 2035
  • Figure 31: North America Market Y-o-Y Growth Comparison by Additive Type, 2025-2035
  • Figure 32: North America Market Attractiveness Analysis by Additive Type
  • Figure 33: Latin America Market Value Share and BPS Analysis by Country, 2025 and 2035
  • Figure 34: Latin America Market Value Share and BPS Analysis by Livestock, 2025 and 2035
  • Figure 35: Latin America Market Y-o-Y Growth Comparison by Livestock, 2025-2035
  • Figure 36: Latin America Market Attractiveness Analysis by Livestock
  • Figure 37: Latin America Market Value Share and BPS Analysis by Form, 2025 and 2035
  • Figure 38: Latin America Market Y-o-Y Growth Comparison by Form, 2025-2035
  • Figure 39: Latin America Market Attractiveness Analysis by Form
  • Figure 40: Latin America Market Value Share and BPS Analysis by Additive Type, 2025 and 2035
  • Figure 41: Latin America Market Y-o-Y Growth Comparison by Additive Type, 2025-2035
  • Figure 42: Latin America Market Attractiveness Analysis by Additive Type
  • Figure 43: Western Europe Market Value Share and BPS Analysis by Country, 2025 and 2035
  • Figure 44: Western Europe Market Value Share and BPS Analysis by Livestock, 2025 and 2035
  • Figure 45: Western Europe Market Y-o-Y Growth Comparison by Livestock, 2025-2035
  • Figure 46: Western Europe Market Attractiveness Analysis by Livestock
  • Figure 47: Western Europe Market Value Share and BPS Analysis by Form, 2025 and 2035
  • Figure 48: Western Europe Market Y-o-Y Growth Comparison by Form, 2025-2035
  • Figure 49: Western Europe Market Attractiveness Analysis by Form
  • Figure 50: Western Europe Market Value Share and BPS Analysis by Additive Type, 2025 and 2035
  • Figure 51: Western Europe Market Y-o-Y Growth Comparison by Additive Type, 2025-2035
  • Figure 52: Western Europe Market Attractiveness Analysis by Additive Type
  • Figure 53: Eastern Europe Market Value Share and BPS Analysis by Country, 2025 and 2035
  • Figure 54: Eastern Europe Market Value Share and BPS Analysis by Livestock, 2025 and 2035
  • Figure 55: Eastern Europe Market Y-o-Y Growth Comparison by Livestock, 2025-2035
  • Figure 56: Eastern Europe Market Attractiveness Analysis by Livestock
  • Figure 57: Eastern Europe Market Value Share and BPS Analysis by Form, 2025 and 2035
  • Figure 58: Eastern Europe Market Y-o-Y Growth Comparison by Form, 2025-2035
  • Figure 59: Eastern Europe Market Attractiveness Analysis by Form
  • Figure 60: Eastern Europe Market Value Share and BPS Analysis by Additive Type, 2025 and 2035
  • Figure 61: Eastern Europe Market Y-o-Y Growth Comparison by Additive Type, 2025-2035
  • Figure 62: Eastern Europe Market Attractiveness Analysis by Additive Type
  • Figure 63: East Asia Market Value Share and BPS Analysis by Country, 2025 and 2035
  • Figure 64: East Asia Market Value Share and BPS Analysis by Livestock, 2025 and 2035
  • Figure 65: East Asia Market Y-o-Y Growth Comparison by Livestock, 2025-2035
  • Figure 66: East Asia Market Attractiveness Analysis by Livestock
  • Figure 67: East Asia Market Value Share and BPS Analysis by Form, 2025 and 2035
  • Figure 68: East Asia Market Y-o-Y Growth Comparison by Form, 2025-2035
  • Figure 69: East Asia Market Attractiveness Analysis by Form
  • Figure 70: East Asia Market Value Share and BPS Analysis by Additive Type, 2025 and 2035
  • Figure 71: East Asia Market Y-o-Y Growth Comparison by Additive Type, 2025-2035
  • Figure 72: East Asia Market Attractiveness Analysis by Additive Type
  • Figure 73: South Asia & Pacific Market Value Share and BPS Analysis by Country, 2025 and 2035
  • Figure 74: South Asia & Pacific Market Value Share and BPS Analysis by Livestock, 2025 and 2035
  • Figure 75: South Asia & Pacific Market Y-o-Y Growth Comparison by Livestock, 2025-2035
  • Figure 76: South Asia & Pacific Market Attractiveness Analysis by Livestock
  • Figure 77: South Asia & Pacific Market Value Share and BPS Analysis by Form, 2025 and 2035
  • Figure 78: South Asia & Pacific Market Y-o-Y Growth Comparison by Form, 2025-2035
  • Figure 79: South Asia & Pacific Market Attractiveness Analysis by Form
  • Figure 80: South Asia & Pacific Market Value Share and BPS Analysis by Additive Type, 2025 and 2035
  • Figure 81: South Asia & Pacific Market Y-o-Y Growth Comparison by Additive Type, 2025-2035
  • Figure 82: South Asia & Pacific Market Attractiveness Analysis by Additive Type
  • Figure 83: Middle East and Africa Market Value Share and BPS Analysis by Country, 2025 and 2035
  • Figure 84: Middle East and Africa Market Value Share and BPS Analysis by Livestock, 2025 and 2035
  • Figure 85: Middle East and Africa Market Y-o-Y Growth Comparison by Livestock, 2025-2035
  • Figure 86: Middle East and Africa Market Attractiveness Analysis by Livestock
  • Figure 87: Middle East and Africa Market Value Share and BPS Analysis by Form, 2025 and 2035
  • Figure 88: Middle East and Africa Market Y-o-Y Growth Comparison by Form, 2025-2035
  • Figure 89: Middle East and Africa Market Attractiveness Analysis by Form
  • Figure 90: Middle East and Africa Market Value Share and BPS Analysis by Additive Type, 2025 and 2035
  • Figure 91: Middle East and Africa Market Y-o-Y Growth Comparison by Additive Type, 2025-2035
  • Figure 92: Middle East and Africa Market Attractiveness Analysis by Additive Type
  • Figure 93: Global Market - Tier Structure Analysis
  • Figure 94: Global Market - Company Share Analysis

Frequently Asked Questions

What is the projected size of the natural feed additives market in 2025?

The market is valued at USD 9.0 billion in 2025.

What is the outlook on natural feed additives demand by 2035?

The market is expected to reach USD 19.3 billion by 2035, reflecting a CAGR of 7.9%.

Which form type leads the natural feed additives market in 2025?

Dry form additives are projected to lead with a 72.8% market share in 2025.

What is the leading additive type in the natural feed additives market by 2025?

Probiotics are anticipated to dominate with a 32.8% share in 2025.

Which country is projected to have the fastest-growing natural feed additives market?

The USA is expected to be the fastest-growing market with a CAGR of 6.2% from 2025 to 2035.

Explore Similar Insights

Future Market Insights

Natural Feed Additives Market