The Natural Vitamin E Product Market is estimated to be valued at USD 1031.2 million in 2025 and is projected to reach USD 2875.7 million by 2035, registering a compound annual growth rate (CAGR) of 10.8% over the forecast period.
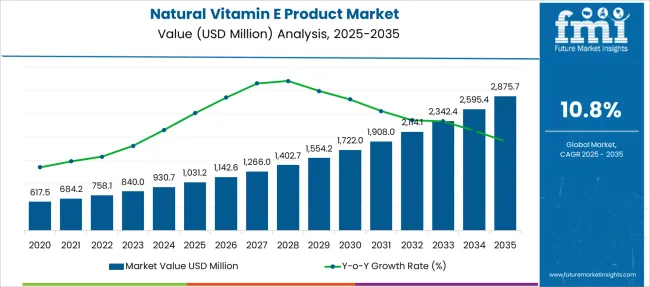
| Metric | Value |
|---|---|
| Natural Vitamin E Product Market Estimated Value in (2025 E) | USD 1031.2 million |
| Natural Vitamin E Product Market Forecast Value in (2035 F) | USD 2875.7 million |
| Forecast CAGR (2025 to 2035) | 10.8% |
The natural vitamin E product market is experiencing steady growth due to rising consumer awareness surrounding natural antioxidants and their benefits in immune support, cardiovascular health, and skin nourishment. Regulatory support for natural ingredients in food, dietary supplements, and personal care formulations has encouraged manufacturers to invest in cleaner alternatives to synthetic counterparts. Technological advancements in molecular distillation, solvent-free extraction, and purification processes have enhanced the stability and bioavailability of naturally derived vitamin E products.
Industry players are increasingly focused on vertical integration and traceable sourcing to meet sustainability mandates and gain competitive differentiation in global markets. Shifts in dietary patterns, particularly in emerging economies, are fostering growth in functional foods and nutraceuticals, further fueling demand for natural tocopherols.
Additionally, the growing emphasis on regulatory compliance with GRAS and non-GMO standards is accelerating the adoption of naturally sourced vitamin E in pharmaceuticals, infant nutrition, and dermatological formulations The future of this market is expected to be shaped by partnerships between food-tech companies, agri-processors, and cosmeceutical innovators.
The market is segmented by Product Type, Application, and Source and region. By Product Type, the market is divided into Tocopherols and Tocotrienols. In terms of Application, the market is classified into Functional Food & Beverages, Pharmaceuticals, Cosmetics, Animal Feed, and Dietary Supplements. Based on Source, the market is segmented into Soybean Oil, Sunflower Oil, Rapeseed Oil, and Other Sources. Regionally, the market is classified into North America, Latin America, Western Europe, Eastern Europe, Balkan & Baltic Countries, Russia & Belarus, Central Asia, East Asia, South Asia & Pacific, and the Middle East & Africa.
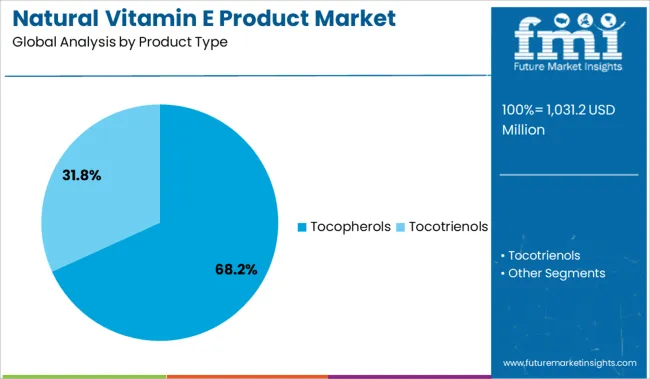
The tocopherols product type segment is expected to account for 68.2% of the revenue share in the natural vitamin E product market in 2025, making it the most dominant segment. The growth of this segment has been supported by its widespread use as a natural preservative, antioxidant, and nutraceutical additive across a variety of end-use industries.
Tocopherols have gained preference due to their recognized efficacy in neutralizing free radicals and their strong presence in GRAS-approved formulations for both food and dietary supplements. The segment's leadership has also been reinforced by advancements in extraction techniques from natural oils, enabling the production of high-purity tocopherols with enhanced stability profiles.
Increased demand for functional ingredients that align with clean-label and plant-based trends has further propelled the use of tocopherols over synthetic alternatives Additionally, evolving consumer preferences toward natural formulations in skin care, pharma, and food preservation have contributed to the sustained demand for tocopherol-based products across regions.
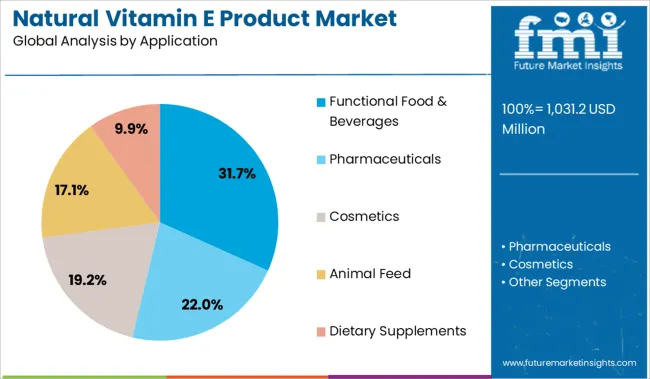
The functional food and beverages application segment is projected to represent 31.7% of the revenue share in the natural vitamin E product market in 2025, driven by rising consumer inclination toward health-boosting dietary intake. The expansion of this segment has been fueled by the inclusion of vitamin E as a bioactive compound in fortified products such as dairy, juices, cereals, and plant-based beverages.
Product developers are increasingly leveraging naturally sourced vitamin E to support oxidative stability, improve shelf life, and promote wellness-oriented branding. The demand has been further accelerated by global trends in preventive healthcare, where consumers seek functional ingredients that support immunity, heart health, and anti-aging benefits.
Innovations in food processing that maintain the integrity of heat-sensitive nutrients like vitamin E have also supported its incorporation in ready-to-eat and minimally processed foods Additionally, the shift toward vegan and allergen-free food products has made natural vitamin E an ideal fit in formulations targeting clean-label conscious consumers.
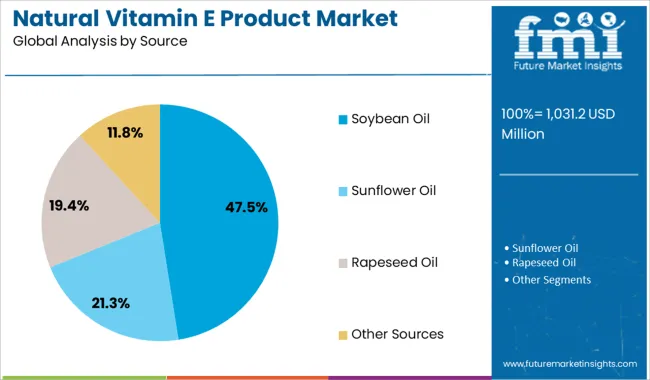
The soybean oil source segment is anticipated to hold 47.5% of the total revenue share in the natural vitamin E product market in 2025, positioning it as the most significant natural source. This dominance is attributed to the high concentration of mixed tocopherols in soybean oil, which facilitates cost-effective extraction and scalability in industrial production.
The segment's growth has been further supported by the abundance and year-round availability of soybean crops across major producing regions, providing manufacturers with consistent raw material supply. Soybean-derived vitamin E has been widely utilized in food, nutraceutical, and personal care applications due to its compatibility with a range of formulations and its favorable regulatory status.
Advances in enzymatic and non-solvent extraction processes have enabled the production of high-purity natural vitamin E from soybean oil, meeting global standards for non-GMO and allergen-free labeling Furthermore, sustainability initiatives and traceable sourcing practices have made soybean oil an attractive option for manufacturers aiming to align with eco-conscious consumer demands.
Governments of developing countries are expected to take numerous initiatives to surge the consumption of fortified food and beverages among people.
The increasing prevalence of various health problems associated with an individual’s age, such as myopia in the adult population, is also projected to drive the global natural vitamin E product market growth during the assessment period.
According to the International Myopia Institute, on average, nearly 30% of the globe is currently myopic. The institute also mentioned that approximately 50% of people will be myopic by the end of 2050. The number of cases is set to grow at a rapid pace in the upcoming years, which would foster growth.
The increasing inclination of consumers towards cosmeceutical, which delivers medical alternatives to conventional treatment options, is expected to augment growth. Consumers nowadays are looking for those products that do not have any chemical ingredients. It is further set to push sales of new products infused with naturally sourced vitamins, including vitamin E.
The consumption of too many health supplements containing fat-soluble vitamins, including vitamin E, can lead to various complications in an individual’s body. Excessive consumption of vitamin E can result in vomiting, abnormal bleeding, diarrhea, and muscle aches.
The bleeding can also surge the risk of early death or a stroke. Too much vitamin E can further disturb blood thinners and chemotherapy medicines. These complications may obstruct sales of natural vitamin E products in future years.
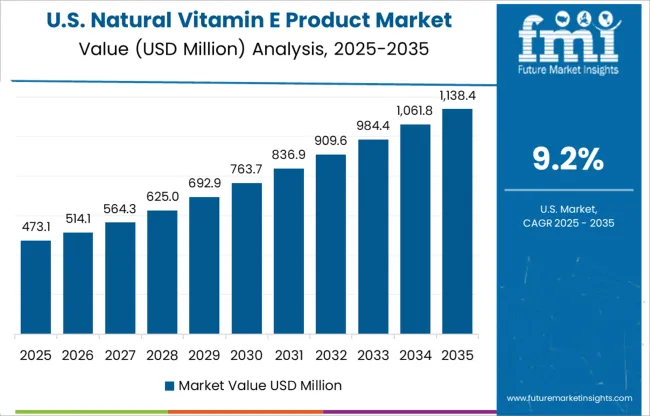
High demand for cosmetics equipped with organic or natural ingredients in the USA and Canada is likely to boost the North American natural vitamin E product market share in the future. Also, the rapid expansion of the retail sector and entry of a large number of e-commerce platforms across the region are anticipated to augur well for the market.
Fashion Nova, a fast fashion retail company based in California, launched its latest beauty segment, NovaBeauty in June 2025. The company introduced a new range of vegan, cruelty-free products under the NovaBeauty Lip Collection.
The collection includes Moisturizing Rich Glow Gloss, 2-In-1 Snatched Lip Liner and Perfect Pout Lipstick. All lip products are infused with vitamin E to prevent signs of aging and help nourish the lips. Thus, the launch of similar innovative products by key players across North America is set to aid growth.
An increasing number of people living with vitamin E deficiency, especially the geriatric population, in developing countries, such as India and China is projected to augment the Asia Pacific market.
Rising awareness about the benefits of consuming vitamin E to prevent arthritis, cancer, cell infection, cardiovascular disease, diabetes, and life problems is another crucial factor that is set to fuel growth.
As per the India Brand Equity Foundation (IBEF), India ranks 3rd in terms of pharmaceutical manufacturing by volume in the world. Also, the Indian pharmaceutical market is anticipated to grow 3x by reaching USD 1031.2 Billion in 2025.
The ongoing development of cutting-edge pharmaceutical products consisting of vitamin E is thus projected to spur the Asia Pacific market.
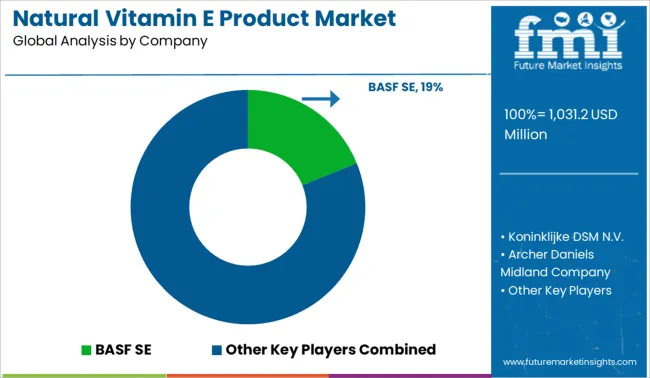
Some of the renowned companies operating in the global natural vitamin E product market include FenchemBiotek, Archer Daniels Midland Company, Merck KGaA, BASF SE, Wilmar Spring Fruit Nutrition Products Co. Ltd., Brenntag AG, Riken Vitamin Co. Ltd., Beijing Gingko Group, Koninklijke Dsm N.V., and Davos Life Science among others.
The global market is consolidated in nature due to the dominance of a handful of companies, including Roquette Frères, Ingredion Incorporated, and Cargill, Inc.
Key players are focusing on expanding their consumer base and launching new products by investing huge sums in Research and Development activities. A few other companies are aiming to improvise their in-house product formulations and striving to enter untapped regions to attract more consumers.
| Report Attribute | Details |
|---|---|
| Growth Rate | CAGR of 10.8% from 2025 to 2035 |
| Base Year for Estimation | 2024 |
| Historical Data | 2020 to 2024 |
| Forecast Period | 2025 to 2035 |
| Quantitative Units | Revenue in USD Million, Volume in Kilotons, and CAGR from 2025 to 2035 |
| Report Coverage | Revenue Forecast, Volume Forecast, Company Ranking, Competitive Landscape, Growth Factors, Trends, and Pricing Analysis |
| Segments Covered |
Product Type, Application, Source, Region |
| Regions Covered |
North America; Latin America; Western Europe; Eastern Europe; Asia Pacific Excluding Japan; Japan; Middle East and Africa |
| Key Countries Profiled | USA, Canada, Brazil, Argentina, Germany, United Kingdom, France, Spain, Italy, Nordics, BENELUX, Australia & New Zealand, China, India, ASIAN, GCC Countries, South Africa |
| Key Companies Profiled |
FenchemBiotek; Archer Daniels Midland Company; Merck KGaA; BASF SE; Wilmar Spring Fruit Nutrition Products Co. Ltd.; Brenntag AG; Riken Vitamin Co. Ltd.; Beijing Gingko Group; Koninklijke Dsm N.V.; Davos Life Science |
| Customization | Available Upon Request |
The global natural vitamin e product market is estimated to be valued at USD 1,031.2 million in 2025.
The market size for the natural vitamin e product market is projected to reach USD 2,875.7 million by 2035.
The natural vitamin e product market is expected to grow at a 10.8% CAGR between 2025 and 2035.
The key product types in natural vitamin e product market are tocopherols and tocotrienols.
In terms of application, functional food & beverages segment to command 31.7% share in the natural vitamin e product market in 2025.


Our Research Products

The "Full Research Suite" delivers actionable market intel, deep dives on markets or technologies, so clients act faster, cut risk, and unlock growth.

The Leaderboard benchmarks and ranks top vendors, classifying them as Established Leaders, Leading Challengers, or Disruptors & Challengers.

Locates where complements amplify value and substitutes erode it, forecasting net impact by horizon

We deliver granular, decision-grade intel: market sizing, 5-year forecasts, pricing, adoption, usage, revenue, and operational KPIs—plus competitor tracking, regulation, and value chains—across 60 countries broadly.

Spot the shifts before they hit your P&L. We track inflection points, adoption curves, pricing moves, and ecosystem plays to show where demand is heading, why it is changing, and what to do next across high-growth markets and disruptive tech

Real-time reads of user behavior. We track shifting priorities, perceptions of today’s and next-gen services, and provider experience, then pace how fast tech moves from trial to adoption, blending buyer, consumer, and channel inputs with social signals (#WhySwitch, #UX).

Partner with our analyst team to build a custom report designed around your business priorities. From analysing market trends to assessing competitors or crafting bespoke datasets, we tailor insights to your needs.
Supplier Intelligence
Discovery & Profiling
Capacity & Footprint
Performance & Risk
Compliance & Governance
Commercial Readiness
Who Supplies Whom
Scorecards & Shortlists
Playbooks & Docs
Category Intelligence
Definition & Scope
Demand & Use Cases
Cost Drivers
Market Structure
Supply Chain Map
Trade & Policy
Operating Norms
Deliverables
Buyer Intelligence
Account Basics
Spend & Scope
Procurement Model
Vendor Requirements
Terms & Policies
Entry Strategy
Pain Points & Triggers
Outputs
Pricing Analysis
Benchmarks
Trends
Should-Cost
Indexation
Landed Cost
Commercial Terms
Deliverables
Brand Analysis
Positioning & Value Prop
Share & Presence
Customer Evidence
Go-to-Market
Digital & Reputation
Compliance & Trust
KPIs & Gaps
Outputs
Full Research Suite comprises of:
Market outlook & trends analysis
Interviews & case studies
Strategic recommendations
Vendor profiles & capabilities analysis
5-year forecasts
8 regions and 60+ country-level data splits
Market segment data splits
12 months of continuous data updates
DELIVERED AS:
PDF EXCEL ONLINE
Natural Refrigerant Chiller Market Size and Share Forecast Outlook 2025 to 2035
Natural Refrigerants Market Size and Share Forecast Outlook 2025 to 2035
Natural Ferulic Acid Market Size and Share Forecast Outlook 2025 to 2035
Natural Feed Additives Market Analysis - Size, Growth, and Forecast 2025 to 2035
Analysis and Growth Projections for Natural Tea Extract Business
Natural Pet Food Market Insights - Nutrition & Consumer Trends 2025 to 2035
Natural Health Product Market Analysis – Size, Share & Forecast 2023 to 2033
Natural Mineral Oil Coolant Market Size and Share Forecast Outlook 2025 to 2035
Naturally Fermented Food Market Size and Share Forecast Outlook 2025 to 2035
Naturally Derived Fatty Alcohol Market Size and Share Forecast Outlook 2025 to 2035
Natural Fiber Composites Market Size and Share Forecast Outlook 2025 to 2035
Naturally Derived Sweeteners Market Size and Share Forecast Outlook 2025 to 2035
Natural Insect Repellent Market Analysis - Trends, Growth & Forecast 2025 to 2035
Natural Rosemarine Extract Market Analysis by Food & Beverage, Pharmaceuticals, Nutraceuticals and Others Through 2035
Natural Cosmetic Color Market Size and Share Forecast Outlook 2025 to 2035
Natural Bitterness Blockers Market Analysis - Size And Share Forecast Outlook 2025 To 2035
Natural Rubber Market Size and Share Forecast Outlook 2025 to 2035
Natural Cosmetics Market - Size, Share, and Forecast 2025-2035
Natural Taste Enhancers and Modifiers Market
Natural Polymer Market Size and Share Forecast Outlook 2025 to 2035

Thank you!
You will receive an email from our Business Development Manager. Please be sure to check your SPAM/JUNK folder too.
Chat With
MaRIA