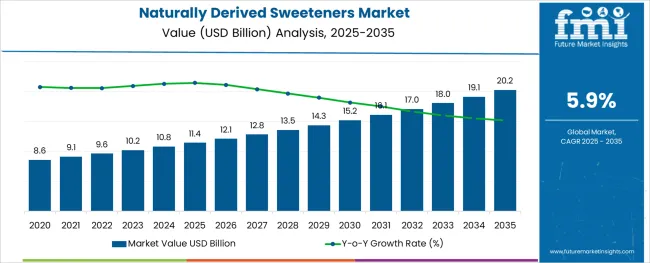
Naturally derived sweeteners market size is estimated to reach a valuation of USD 9.6 Billion by 2022 and exceed USD 17 Billion by 2032, growing at a CAGR of 5.9% during the forecast period 2022 to 2032.
Attribute | Details |
---|---|
Market Size Value in 2022 | USD 9.6 Billion |
Market Forecast Value in 2032 | USD 17 Billion |
Global Growth Rate (2022 to 2032) | 5.9% |
Forecast Period | 2022 to 2032 |
In recent years, the global natural sweeteners market has seen increasing trends. The growth of this industry is primarily driven by an increase in consumer health consciousness, which encourages demand for healthier food options, an increase in demand for natural sweeteners due to a shift in consumer preferences toward organic products, and a growing demand for alternatives of sugar in a variety of food and beverage applications.
Other factors boosting demand for these natural sweeteners include their increasing use in the food and beverage industry, particularly in emerging and impoverished nations, due to their low-calorie and naturally sweetening qualities. However, concerns such as ambiguity about health problems caused by excessive usage of natural sweeteners are impeding the growth of the natural sweeteners industry.
Particulars | Details |
---|---|
H1 2021 | 5.8% |
H1 2022 Projected | 5.9% |
H1 2022 Expected | 6.5% |
BPS Change | - 64.9 ↓ |
FMI presents a half-yearly comparison analysis and review of the market growth rates and further development prospects in the global market. The market is predominantly influenced by certain demographic and innovation factors under the subjective impact of macro and industry factors.
Some new developments that have taken place in these markets include:
The global market for Naturally Derived Sweeteners is witnessing H1 2021 growth at the magnitude of 5.8%. However, this growth is not evenly spread across all regions, with the developing markets recording higher growth rates of 6.5%. Thus, leaving the gap of -64.9 BPS points between expected and projected growth during H1 2022.
Key reasons for this change in growth rate are attributed to slow/rapid uptake of the market during the first half of the forecast period owing to improving end-user demand in key economies and their booming populations.
In particular, China and India are both seeing an increase in their consumption pattern which is resulting in increased demand for Naturally Derived Sweeteners market. Additionally, many other market segments are expected to perform fairly and attain promising growth prospects in the next half of the projection period.
Despite these positive prospects, there are some likely challenges that stay ahead for the industry including the shift in consumer preferences, stringent trade barriers, low degree of security in raw material supply, and other manufacturing inputs.
As people become more aware of healthcare options, they are becoming more cognizant of their dietary needs. As a result, customers are moving their preferences toward healthy and natural goods when it comes to food and beverage consumption, supporting the growth of the Naturally Derived Sweeteners Market.
Because of the rising prevalence of diabetes and obesity among consumers around the world, there is a significant increase in demand for low-calorie and sugar-free products, which is expected to boost the growth of the Naturally Derived Sweeteners Market.
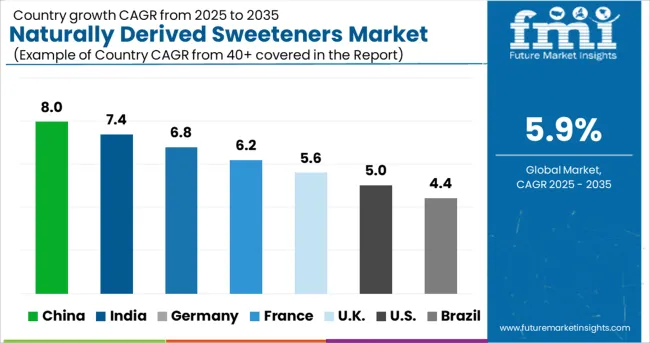
In 2021, East Asia had the largest market share, accounting for 37.8% of the total. Growing demand for stevia products, high availability of raw materials, and increased investment by big corporations are all contributing to this segments’ growth.
The market is being driven by the increased use of low-calorie and sugar-free goods among the diabetic population in the region. Due to reasons such as increased health awareness among consumers and increasing demands for natural sweeteners in beverages and food as well as pharmaceuticals, East Asia is expected to be the fastest
Due to a rising shift in consumer preference toward natural sugar and increased demand for new products from customers, the Food and Beverage industry held the highest share in 2021. The market is developing due to an increase in demand for natural goods in food and beverages as a result of rising health consciousness among consumers.
Because of the growing demand for natural goods in pharmaceuticals and increased research & development efforts, the pharmaceuticals segment is expected to be the fastest expanding category. Natural sweeteners are in high demand in pharmaceuticals due to their non-toxic nature.
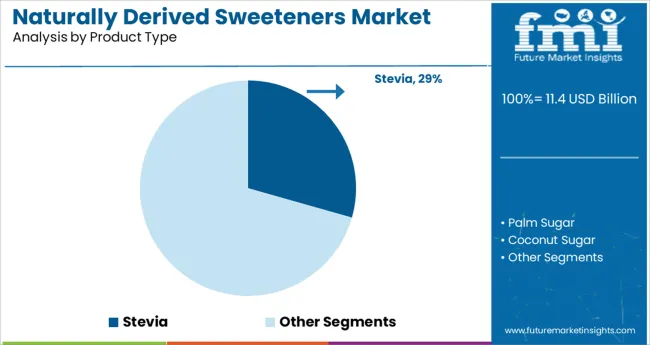
Because of the increased demand for low-calorie foods, the stevia category had the biggest share in 2021. Stevia is made up of eleven main steviol glycosides and does not add carbs or calories to the foods or beverages to which it is added. The diabetic population's rising demand for stevia products is propelling the industry forward.
During the projection period 2022 to 2032, coconut sugar is expected to be the fastest expanding category, with a CAGR of 6.4%. This is due to reasons including rising demand for natural goods and increased knowledge of the health advantages of coconut products.
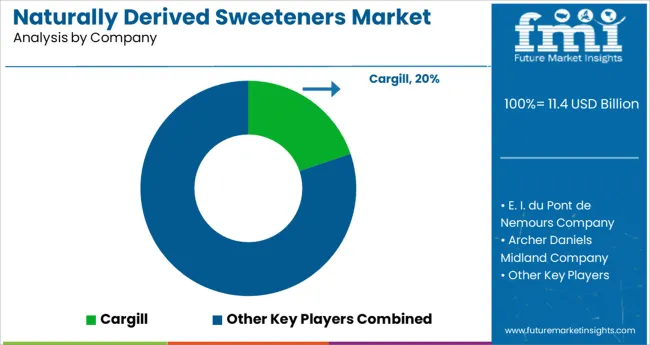
Businesses in the naturally derived sweeteners industry are increasingly more engaged with beginning tactics such as focused marketing, CSR initiatives, and other strategies in order to increase their global significance.
A notable tendency that can be seen across the board is that these businesses are now attempting to handle a certain business-related activity in a nation with favourable legislation so that they are able to save expenses while still employing industry experts at important points in their operations.
Authorities in growing nations such as India, China, Taiwan, and Indonesia, among others, are pursuing policies to entice foreign investors into their manufacturing sectors by cutting trade taxes and levies in order to create more employment.
According to the market research E. I. du Pont de Nemours Company, Archer Daniels Midland Company, Merisant Company, Tate & Lyle PLC, Cargill, Madhava Natural Sweeteners, PureCircle Limited, Herboveda India Pvt. Ltd.
GLG Lifetech Corporation Wisdom Natural Brands (SweetLeaf Stevia), are among the key players in the naturally derived sweeteners market.
Attribute | Details |
---|---|
Market Size Value in 2022 | USD 9.6 Billion |
Market Forecast Value in 2032 | USD 17 Billion |
Global Growth Rate | 5.9% |
Forecast Period | 2022 to 2032 |
Historical Data Available for | 2017 to 2021 |
Market Analysis | MT for Volume and USD Billion for Value |
Key Regions Covered | North America; Latin America; Europe; East Asia; South Asia; Oceania and Middle East and Africa |
Key Countries Covered | United States, Canada, Brazil, Mexico, Germany, UK, France, Italy, Spain, Nordic, Russia, Poland, China, India, Thailand, Indonesia, Australia and New Zealand, Japan, GCC countries, North Africa, South Africa, others. |
Key Market Segments Covered | Nature, From, Product, End Use, and Region |
Key Companies Profiled | E. I. du Pont de Nemours Company; Archer Daniels Midland Company; Merisant Company; Tate & Lyle PLC; Cargill; Madhava Natural Sweeteners; PureCircle Limited; Herboveda India Pvt. Ltd.; GLG Lifetech Corporation; Wisdom Natural Brands (SweetLeaf Stevia) |
Pricing | Available upon Request |
By End Use:
Table 01: Global Naturally Derived Sweeteners Historical Market Size (USD Bn) 2017–2021 and Forecast 2022–2032 by Product Type
Table 02: Global Naturally Derived Sweeteners Historical Market Volume (Metric Tons) 2017–2021 and Forecast 2022–2032 by Product Type
Table 03: Global Naturally Derived Sweeteners Historical Market Size (USD Bn) 2017–2021 and Forecast 2022–2032 by Form
Table 04: Global Naturally Derived Sweeteners Historical Market Volume (Metric Tons) 2017–2021 and Forecast 2022–2032 by Form
Table 05: Global Naturally Derived Sweeteners Historical Market Size (USD Bn) 2017–2021 and Forecast 2022–2032 by Nature
Table 06: Global Naturally Derived Sweeteners Historical Market Volume (Metric Tons) 2017–2021 and Forecast 2022–2032 by Nature
Table 07: Global Naturally Derived Sweeteners Historical Market Size (USD Bn) 2017–2021 and Forecast 2022–2032 by End Use
Table 08: Global Naturally Derived Sweeteners Historical Market Size (MT) 2017–2021 and Forecast 2022–2032 by End Use
Table 09: Global Naturally Derived Sweeteners Historical Market Size (USD Bn) 2017–2021 and Forecast 2022–2032 by Sales Channel
Table 10: Global Naturally Derived Sweeteners Historical Market Size (MT) 2017–2021 and Forecast 2022–2032 by Sales Channel
Table 11: Global Naturally Derived Sweeteners Historical Market Size (USD Bn) 2017–2021 and Forecast 2022–2032 by Region
Table 12: Global Naturally Derived Sweeteners Historical Market Size (MT) 2017–2021 and Forecast 2022–2032 by Region
Table 13: North America Naturally Derived Sweeteners Historical Market Size (USD Bn) 2017–2021 and Forecast 2022–2032 by Product Type
Table 14: North America Naturally Derived Sweeteners Historical Market Volume (Metric Tons) 2017–2021 and Forecast 2022–2032 by Product type
Table 15: North America Naturally Derived Sweeteners Historical Market Size (USD Bn) 2017–2021 and Forecast 2022–2032 by Form
Table 16: North America Naturally Derived Sweeteners Historical Market Volume (Metric Tons) 2017–2021 and Forecast 2022–2032 by Form
Table 17: North America Naturally Derived Sweeteners Historical Market Size (USD Bn) 2017–2021 and Forecast 2022–2032 by Nature
Table 18: North America Naturally Derived Sweeteners Historical Market Volume (Metric Tons) 2017–2021 and Forecast 2022–2032 by Nature
Table 19: North America Naturally Derived Sweeteners Historical Market Size (USD Bn) 2017–2021 and Forecast 2022–2032 by End Use
Table 20: North America Naturally Derived Sweeteners Historical Market Size (MT) 2017–2021 and Forecast 2022–2032 by End Use
Table 21: North America Naturally Derived Sweeteners Historical Market Size (USD Bn) 2017–2021 and Forecast 2022–2032 by Sales Channel
Table 22: North America Naturally Derived Sweeteners Historical Market Size (MT) 2017–2021 and Forecast 2022–2032 by Sales Channel
Table 23: North America Naturally Derived Sweeteners Historical Market Size (USD Bn) 2017–2021 and Forecast 2022–2032 by Country
Table 24: North America Naturally Derived Sweeteners Historical Market Size (MT) 2017–2021 and Forecast 2022–2032 by Country
Table 25: Latin America Naturally Derived Sweeteners Historical Market Size (USD Bn) 2017–2021 and Forecast 2022–2032 by Product Type
Table 26: Latin America Naturally Derived Sweeteners Historical Market Volume (Metric Tons) 2017–2021 and Forecast 2022–2032 by Product type
Table 27: Latin America Naturally Derived Sweeteners Historical Market Size (USD Bn) 2017–2021 and Forecast 2022–2032 by Form
Table 28: Latin America Naturally Derived Sweeteners Historical Market Volume (Metric Tons) 2017–2021 and Forecast 2022–2032 by Form
Table 29: Latin America Naturally Derived Sweeteners Historical Market Size (USD Bn) 2017–2021 and Forecast 2022–2032 by Nature
Table 30: Latin America Naturally Derived Sweeteners Historical Market Volume (Metric Tons) 2017–2021 and Forecast 2022–2032 by Nature
Table 31: Latin America Naturally Derived Sweeteners Historical Market Size (USD Bn) 2017–2021 and Forecast 2022–2032 by End Use
Table 32: Latin America Naturally Derived Sweeteners Historical Market Size (MT) 2017–2021 and Forecast 2022–2032 by End Use
Table 33: Latin America Naturally Derived Sweeteners Historical Market Size (USD Bn) 2017–2021 and Forecast 2022–2032 by Sales Channel
Table 34: Latin America Naturally Derived Sweeteners Historical Market Size (MT) 2017–2021 and Forecast 2022–2032 by Sales Channel
Table 35: Latin America Naturally Derived Sweeteners Historical Market Size (USD Bn) 2017–2021 and Forecast 2022–2032 by Country
Table 36: Latin America Naturally Derived Sweeteners Historical Market Size (MT) 2017–2021 and Forecast 2022–2032 by Country
Table 37: Europe Naturally Derived Sweeteners Historical Market Size (USD Bn) 2017–2021 and Forecast 2022–2032 by Product Type
Table 38: Europe Naturally Derived Sweeteners Historical Market Volume (Metric Tons) 2017–2021 and Forecast 2022–2032 by Product type
Table 39: Europe Naturally Derived Sweeteners Historical Market Size (USD Bn) 2017–2021 and Forecast 2022–2032 by Form
Table 40: Europe Naturally Derived Sweeteners Historical Market Volume (Metric Tons) 2017–2021 and Forecast 2022–2032 by Form
Table 41: Europe Naturally Derived Sweeteners Historical Market Size (USD Bn) 2017–2021 and Forecast 2022–2032 by Nature
Table 42: Europe Naturally Derived Sweeteners Historical Market Volume (Metric Tons) 2017–2021 and Forecast 2022–2032 by Nature
Table 43: Europe Naturally Derived Sweeteners Historical Market Size (USD Bn) 2017–2021 and Forecast 2022–2032 by End Use
Table 44: Europe Naturally Derived Sweeteners Historical Market Size (MT) 2017–2021 and Forecast 2022–2032 by End Use
Table 45: Europe Naturally Derived Sweeteners Historical Market Size (USD Bn) 2017–2021 and Forecast 2022–2032 by Sales Channel
Table 46: Europe Naturally Derived Sweeteners Historical Market Size (MT) 2017–2021 and Forecast 2022–2032 by Sales Channel
Table 47: Europe Naturally Derived Sweeteners Historical Market Size (USD Bn) 2017–2021 and Forecast 2022–2032 by Country
Table 48: Europe Naturally Derived Sweeteners Historical Market Size (MT) 2017–2021 and Forecast 2022–2032 by Country
Table 49: East Asia Naturally Derived Sweeteners Historical Market Size (USD Bn) 2017–2021 and Forecast 2022–2032 by Product Type
Table 50: East Asia Naturally Derived Sweeteners Historical Market Volume (Metric Tons) 2017–2021 and Forecast 2022–2032 by Product type
Table 51: East Asia Naturally Derived Sweeteners Historical Market Size (USD Bn) 2017–2021 and Forecast 2022–2032 by Form
Table 52: East Asia Naturally Derived Sweeteners Historical Market Volume (Metric Tons) 2017–2021 and Forecast 2022–2032 by Form
Table 53: East Asia Naturally Derived Sweeteners Historical Market Size (USD Bn) 2017–2021 and Forecast 2022–2032 by Nature
Table 54: East Asia Naturally Derived Sweeteners Historical Market Volume (Metric Tons) 2017–2021 and Forecast 2022–2032 by Nature
Table 55: East Asia Naturally Derived Sweeteners Historical Market Size (USD Bn) 2017–2021 and Forecast 2022–2032 by End Use
Table 56: East Asia Naturally Derived Sweeteners Historical Market Size (MT) 2017–2021 and Forecast 2022–2032 by End Use
Table 57: East Asia Naturally Derived Sweeteners Historical Market Size (USD Bn) 2017–2021 and Forecast 2022–2032 by Sales Channel
Table 58: East Asia Naturally Derived Sweeteners Historical Market Size (MT) 2017–2021 and Forecast 2022–2032 by Sales Channel
Table 59: East Asia Naturally Derived Sweeteners Historical Market Size (USD Bn) 2017–2021 and Forecast 2022–2032 by Country
Table 60: East Asia Naturally Derived Sweeteners Historical Market Size (MT) 2017–2021 and Forecast 2022–2032 by Country
Table 61: South Asia Naturally Derived Sweeteners Historical Market Size (USD Bn) 2017–2021 and Forecast 2022–2032 by Product Type
Table 62: South Asia Naturally Derived Sweeteners Historical Market Volume (Metric Tons) 2017–2021 and Forecast 2022–2032 by Product type
Table 63: South Asia Naturally Derived Sweeteners Historical Market Size (USD Bn) 2017–2021 and Forecast 2022–2032 by Form
Table 64: South Asia Naturally Derived Sweeteners Historical Market Volume (Metric Tons) 2017–2021 and Forecast 2022–2032 by Form
Table 65: South Asia Naturally Derived Sweeteners Historical Market Size (USD Bn) 2017–2021 and Forecast 2022–2032 by Nature
Table 66: South Asia Naturally Derived Sweeteners Historical Market Volume (Metric Tons) 2017–2021 and Forecast 2022–2032 by Nature
Table 67: South Asia Naturally Derived Sweeteners Historical Market Size (USD Bn) 2017–2021 and Forecast 2022–2032 by End Use
Table 68: South Asia Naturally Derived Sweeteners Historical Market Size (MT) 2017–2021 and Forecast 2022–2032 by End Use
Table 69: South Asia Naturally Derived Sweeteners Historical Market Size (USD Bn) 2017–2021 and Forecast 2022–2032 by Sales Channel
Table 70: South Asia Naturally Derived Sweeteners Historical Market Size (MT) 2017–2021 and Forecast 2022–2032 by Sales Channel
Table 71: South Asia Naturally Derived Sweeteners Historical Market Size (USD Bn) 2017–2021 and Forecast 2022–2032 by Country
Table 72: South Asia Naturally Derived Sweeteners Historical Market Size (MT) 2017–2021 and Forecast 2022–2032 by Country
Table 73: Oceania Naturally Derived Sweeteners Historical Market Size (USD Bn) 2017–2021 and Forecast 2022–2032 by Product Type
Table 74: Oceania Naturally Derived Sweeteners Historical Market Volume (Metric Tons) 2017–2021 and Forecast 2022–2032 by Product type
Table 75: Oceania Naturally Derived Sweeteners Historical Market Size (USD Bn) 2017–2021 and Forecast 2022–2032 by Form
Table 76: Oceania Naturally Derived Sweeteners Historical Market Volume (Metric Tons) 2017–2021 and Forecast 2022–2032 by Form
Table 77: Oceania Naturally Derived Sweeteners Historical Market Size (USD Bn) 2017–2021 and Forecast 2022–2032 by Nature
Table 78: Oceania Naturally Derived Sweeteners Historical Market Volume (Metric Tons) 2017–2021 and Forecast 2022–2032 by Nature
Table 79: Oceania Naturally Derived Sweeteners Historical Market Size (USD Bn) 2017–2021 and Forecast 2022–2032 by End Use
Table 80: Oceania Naturally Derived Sweeteners Historical Market Size (MT) 2017–2021 and Forecast 2022–2032 by End Use
Table 81: Oceania Naturally Derived Sweeteners Historical Market Size (USD Bn) 2017–2021 and Forecast 2022–2032 by Sales Channel
Table 82: Oceania Naturally Derived Sweeteners Historical Market Size (MT) 2017–2021 and Forecast 2022–2032 by Sales Channel
Table 83: Oceania Naturally Derived Sweeteners Historical Market Size (USD Bn) 2017–2021 and Forecast 2022–2032 by Country
Table 84: Oceania Naturally Derived Sweeteners Historical Market Size (MT) 2017–2021 and Forecast 2022–2032 by Country
Table 85: MEA Naturally Derived Sweeteners Historical Market Size (USD Bn) 2017–2021 and Forecast 2022–2032 by Product Type
Table 86: MEA Naturally Derived Sweeteners Historical Market Volume (Metric Tons) 2017–2021 and Forecast 2022–2032 by Product type
Table 87: MEA Naturally Derived Sweeteners Historical Market Size (USD Bn) 2017–2021 and Forecast 2022–2032 by Form
Table 88: MEA Naturally Derived Sweeteners Historical Market Volume (Metric Tons) 2017–2021 and Forecast 2022–2032 by Form
Table 89: MEA Naturally Derived Sweeteners Historical Market Size (USD Bn) 2017–2021 and Forecast 2022–2032 by Nature
Table 90: MEA Naturally Derived Sweeteners Historical Market Volume (Metric Tons) 2017–2021 and Forecast 2022–2032 by Nature
Table 91: MEA Naturally Derived Sweeteners Historical Market Size (USD Bn) 2017–2021 and Forecast 2022–2032 by End Use
Table 92: MEA Naturally Derived Sweeteners Historical Market Size (MT) 2017–2021 and Forecast 2022–2032 by End Use
Table 93: MEA Naturally Derived Sweeteners Historical Market Size (USD Bn) 2017–2021 and Forecast 2022–2032 by Sales Channel
Table 94: MEA Naturally Derived Sweeteners Historical Market Size (MT) 2017–2021 and Forecast 2022–2032 by Sales Channel
Table 95: MEA Naturally Derived Sweeteners Historical Market Size (USD Bn) 2017–2021 and Forecast 2022–2032 by Country
Table 96: MEA Naturally Derived Sweeteners Historical Market Size (MT) 2017–2021 and Forecast 2022–2032 by Country
Figure 01: Global Naturally Derived Sweeteners Market Size (USD Bn) and Volume (Metric Tons) Forecast, 2022–2032
Figure 02: Global Naturally Derived Sweeteners Market Absolute $ Opportunity, 2022–2032
Figure 03: Global Naturally Derived Sweeteners Market Share Analysis by Product Type, 2022 and 2032
Figure 04: Global Naturally Derived Sweeteners Market Y-o-Y Growth Analysis by Product Type, 2022–2032
Figure 05: Global Naturally Derived Sweeteners Market Attractiveness Analysis by Product Type, 2022–2032
Figure 06: Global Naturally Derived Sweeteners Market Share Analysis by Form, 2022 and 2032
Figure 07: Global Naturally Derived Sweeteners Market Y-o-Y Growth Analysis by Form, 2022–2032
Figure 08: Global Naturally Derived Sweeteners Market Attractiveness Analysis by Form, 2022–2032
Figure 09: Global Naturally Derived Sweeteners Market Share Analysis by Nature, 2022 and 2032
Figure 10: Global Naturally Derived Sweeteners Market Y-o-Y Growth Analysis by Nature, 2022–2032
Figure 11: Global Naturally Derived Sweeteners Market Attractiveness Analysis by Nature, 2022–2032
Figure 12: Global Naturally Derived Sweeteners Market Share Analysis by End Use, 2022 and 2032
Figure 13: Global Naturally Derived Sweeteners Market Y-o-Y Growth Analysis by End Use, 2022–2032
Figure 14: Global Naturally Derived Sweeteners Market Attractiveness Analysis by End Use, 2022–2032
Figure 15: Global Naturally Derived Sweeteners Market Share Analysis by Sales Channel, 2022 and 2032
Figure 16: Global Naturally Derived Sweeteners Market Y-o-Y Growth Analysis by Sales Channel, 2022–2032
Figure 17: Global Naturally Derived Sweeteners Market Attractiveness Analysis by Sales Channel, 2022–2032
Figure 18: Global Naturally Derived Sweeteners Market Share Analysis by Region, 2022 and 2032
Figure 19: Global Naturally Derived Sweeteners Market Y-o-Y Growth Analysis by Region, 2022–2032
Figure 20: Global Naturally Derived Sweeteners Market Attractiveness Analysis by Region, 2022–2032
Figure 21: North America Naturally Derived Sweeteners Market Size (USD Bn) and Volume (Metric Tons) Forecast, 2022–2032
Figure 22: North America Naturally Derived Sweeteners Market Absolute $ Opportunity, 2022–2032
Figure 23: North America Naturally Derived Sweeteners Market Value (USD Bn) by Product Type, 2018 & 2028
Figure 24: North America Naturally Derived Sweeteners Market Value (USD Bn) by Form, 2018 & 2028
Figure 25: North America Naturally Derived Sweeteners Market Value (USD Bn) by Nature, 2018 & 2028
Figure 26: North America Naturally Derived Sweeteners Market Value (USD Bn) by End Use, 2018 & 2028
Figure 27: North America Naturally Derived Sweeteners Market Value (USD Bn) by Sales Channel, 2018 & 2028
Figure 28: North America Naturally Derived Sweeteners Market Value (USD Bn) by Country, 2018 & 2028
Figure 29: North America Naturally Derived Sweeteners Market Attractiveness Analysis by Product Type, 2022–2032
Figure 30: North America Naturally Derived Sweeteners Market Attractiveness Analysis by Form, 2022–2032
Figure 31: North America Naturally Derived Sweeteners Market Attractiveness Analysis by Nature, 2022–2032
Figure 32: North America Naturally Derived Sweeteners Market Attractiveness Analysis by End Use, 2022–2032
Figure 33: North America Naturally Derived Sweeteners Market Attractiveness Analysis by Sales Channel, 2022–2032
Figure 34: North America Naturally Derived Sweeteners Market Attractiveness Analysis by Country, 2022–2032
Figure 35: Latin America Naturally Derived Sweeteners Market Size (USD Bn) and Volume (Metric Tons) Forecast, 2022–2032
Figure 36: Latin America Naturally Derived Sweeteners Market Absolute $ Opportunity, 2022–2032
Figure 37: Latin America Naturally Derived Sweeteners Market Value (USD Bn) by Product Type, 2018 & 2028
Figure 38: Latin America Naturally Derived Sweeteners Market Value (USD Bn) by Form, 2018 & 2028
Figure 39: Latin America Naturally Derived Sweeteners Market Value (USD Bn) by Nature, 2018 & 2028
Figure 40: Latin America Naturally Derived Sweeteners Market Value (USD Bn) by End Use, 2018 & 2028
Figure 41: Latin America Naturally Derived Sweeteners Market Value (USD Bn) by Sales Channel, 2018 & 2028
Figure 42: Latin America Naturally Derived Sweeteners Market Value (USD Bn) by Country, 2018 & 2028
Figure 43: Latin America Naturally Derived Sweeteners Market Attractiveness Analysis by Product Type, 2022–2032
Figure 44: Latin America Naturally Derived Sweeteners Market Attractiveness Analysis by Form, 2022–2032
Figure 45: Latin America Naturally Derived Sweeteners Market Attractiveness Analysis by Nature, 2022–2032
Figure 46: Latin America Naturally Derived Sweeteners Market Attractiveness Analysis by End Use, 2022–2032
Figure 47: Latin America Naturally Derived Sweeteners Market Attractiveness Analysis by Sales Channel, 2022–2032
Figure 48: Latin America Naturally Derived Sweeteners Market Attractiveness Analysis by Country, 2022–2032
Figure 49: Europe Naturally Derived Sweeteners Market Size (USD Bn) and Volume (Metric Tons) Forecast, 2022–2032
Figure 50: Europe Naturally Derived Sweeteners Market Absolute $ Opportunity, 2022–2032
Figure 51: Europe Naturally Derived Sweeteners Market Value (USD Bn) by Product Type, 2018 & 2028
Figure 52: Europe Naturally Derived Sweeteners Market Value (USD Bn) by Form, 2018 & 2028
Figure 53: Europe Naturally Derived Sweeteners Market Value (USD Bn) by Nature, 2018 & 2028
Figure 54: Europe Naturally Derived Sweeteners Market Value (USD Bn) by End Use, 2018 & 2028
Figure 55: Europe Naturally Derived Sweeteners Market Value (USD Bn) by Sales Channel, 2018 & 2028
Figure 56: Europe Naturally Derived Sweeteners Market Value (USD Bn) by Country, 2018 & 2028
Figure 57: Europe Naturally Derived Sweeteners Market Attractiveness Analysis by Product Type, 2022–2032
Figure 58: Europe Naturally Derived Sweeteners Market Attractiveness Analysis by Form, 2022–2032
Figure 59: Europe Naturally Derived Sweeteners Market Attractiveness Analysis by Nature, 2022–2032
Figure 60: Europe Naturally Derived Sweeteners Market Attractiveness Analysis by End Use, 2022–2032
Figure 61: Europe Naturally Derived Sweeteners Market Attractiveness Analysis by Sales Channel, 2022–2032
Figure 62: Europe Naturally Derived Sweeteners Market Attractiveness Analysis by Country, 2022–2032
Figure 63: East Asia Naturally Derived Sweeteners Market Size (USD Bn) and Volume (Metric Tons) Forecast, 2022–2032
Figure 64: East Asia Naturally Derived Sweeteners Market Absolute $ Opportunity, 2022–2032
Figure 65: East Asia Naturally Derived Sweeteners Market Value (USD Bn) by Product Type, 2018 & 2028
Figure 66: East Asia Naturally Derived Sweeteners Market Value (USD Bn) by Form, 2018 & 2028
Figure 67: East Asia Naturally Derived Sweeteners Market Value (USD Bn) by Nature, 2018 & 2028
Figure 68: East Asia Naturally Derived Sweeteners Market Value (USD Bn) by End Use, 2018 & 2028
Figure 69: East Asia Naturally Derived Sweeteners Market Value (USD Bn) by Sales Channel, 2018 & 2028
Figure 70: East Asia Naturally Derived Sweeteners Market Value (USD Bn) by Country, 2018 & 2028
Figure 71: East Asia Naturally Derived Sweeteners Market Attractiveness Analysis by Product Type, 2022–2032
Figure 72: East Asia Naturally Derived Sweeteners Market Attractiveness Analysis by Form, 2022–2032
Figure 73: East Asia Naturally Derived Sweeteners Market Attractiveness Analysis by Nature, 2022–2032
Figure 74: East Asia Naturally Derived Sweeteners Market Attractiveness Analysis by End Use, 2022–2032
Figure 75: East Asia Naturally Derived Sweeteners Market Attractiveness Analysis by Sales Channel, 2022–2032
Figure 76: East Asia Naturally Derived Sweeteners Market Attractiveness Analysis by Country, 2022–2032
Figure 77: South Asia Naturally Derived Sweeteners Market Size (USD Bn) and Volume (Metric Tons) Forecast, 2022–2032
Figure 78: South Asia Naturally Derived Sweeteners Market Absolute $ Opportunity, 2022–2032
Figure 79: South Asia Naturally Derived Sweeteners Market Value (USD Bn) by Product Type, 2018 & 2028
Figure 80: South Asia Naturally Derived Sweeteners Market Value (USD Bn) by Form, 2018 & 2028
Figure 81: South Asia Naturally Derived Sweeteners Market Value (USD Bn) by Nature, 2018 & 2028
Figure 82: South Asia Naturally Derived Sweeteners Market Value (USD Bn) by End Use, 2018 & 2028
Figure 83: South Asia Naturally Derived Sweeteners Market Value (USD Bn) by Sales Channel, 2018 & 2028
Figure 84: South Asia Naturally Derived Sweeteners Market Value (USD Bn) by Country, 2018 & 2028
Figure 85: South Asia Naturally Derived Sweeteners Market Attractiveness Analysis by Product Type, 2022–2032
Figure 86: South Asia Naturally Derived Sweeteners Market Attractiveness Analysis by Form, 2022–2032
Figure 87: South Asia Naturally Derived Sweeteners Market Attractiveness Analysis by Nature, 2022–2032
Figure 88: South Asia Naturally Derived Sweeteners Market Attractiveness Analysis by End Use, 2022–2032
Figure 89: South Asia Naturally Derived Sweeteners Market Attractiveness Analysis by Sales Channel, 2022–2032
Figure 90: South Asia Naturally Derived Sweeteners Market Attractiveness Analysis by Country, 2022–2032
Figure 91: Oceania Naturally Derived Sweeteners Market Size (USD Bn) and Volume (Metric Tons) Forecast, 2022–2032
Figure 92: Oceania Naturally Derived Sweeteners Market Absolute $ Opportunity, 2022–2032
Figure 93: Oceania Naturally Derived Sweeteners Market Value (USD Bn) by Product Type, 2018 & 2028
Figure 94: Oceania Naturally Derived Sweeteners Market Value (USD Bn) by Form, 2018 & 2028
Figure 95: Oceania Naturally Derived Sweeteners Market Value (USD Bn) by Nature, 2018 & 2028
Figure 96: Oceania Naturally Derived Sweeteners Market Value (USD Bn) by End Use, 2018 & 2028
Figure 97: Oceania Naturally Derived Sweeteners Market Value (USD Bn) by Sales Channel, 2018 & 2028
Figure 98: Oceania Naturally Derived Sweeteners Market Value (USD Bn) by Country, 2018 & 2028
Figure 99: Oceania Naturally Derived Sweeteners Market Attractiveness Analysis by Product Type, 2022–2032
Figure 100: Oceania Naturally Derived Sweeteners Market Attractiveness Analysis by Form, 2022–2032
Figure 101: Oceania Naturally Derived Sweeteners Market Attractiveness Analysis by Nature, 2022–2032
Figure 102: Oceania Naturally Derived Sweeteners Market Attractiveness Analysis by End Use, 2022–2032
Figure 103: Oceania Naturally Derived Sweeteners Market Attractiveness Analysis by Sales Channel, 2022–2032
Figure 104: Oceania Naturally Derived Sweeteners Market Attractiveness Analysis by Country, 2022–2032
Figure 105: MEA Naturally Derived Sweeteners Market Size (USD Bn) and Volume (Metric Tons) Forecast, 2022–2032
Figure 106: MEA Naturally Derived Sweeteners Market Absolute $ Opportunity, 2022–2032
Figure 107: MEA Naturally Derived Sweeteners Market Value (USD Bn) by Product Type, 2018 & 2028
Figure 108: MEA Naturally Derived Sweeteners Market Value (USD Bn) by Form, 2018 & 2028
Figure 109: MEA Naturally Derived Sweeteners Market Value (USD Bn) by Nature, 2018 & 2028
Figure 110: MEA Naturally Derived Sweeteners Market Value (USD Bn) by End Use, 2018 & 2028
Figure 111: MEA Naturally Derived Sweeteners Market Value (USD Bn) by Sales Channel, 2018 & 2028
Figure 112: MEA Naturally Derived Sweeteners Market Value (USD Bn) by Country, 2018 & 2028
Figure 113: MEA Naturally Derived Sweeteners Market Attractiveness Analysis by Product Type, 2022–2032
Figure 114: MEA Naturally Derived Sweeteners Market Attractiveness Analysis by Form, 2022–2032
Figure 115: MEA Naturally Derived Sweeteners Market Attractiveness Analysis by Nature, 2022–2032
Figure 116: MEA Naturally Derived Sweeteners Market Attractiveness Analysis by End Use, 2022–2032
Figure 117: MEA Naturally Derived Sweeteners Market Attractiveness Analysis by Sales Channel, 2022–2032
Figure 118: MEA Naturally Derived Sweeteners Market Attractiveness Analysis by Country, 2022–2032
Currently naturally derived sweeteners market is worth more than USD 9.1 Billion.
Naturally derived sweeteners consumption is expected to grow at a CAGR of around 5.9% during the period 2022 to 2032.
In terms of revenue, naturally derived sweeteners grew at a CAGR of around 4.7% during 2017 to 2021.
The primary factor driving the growth of the naturally derived sweeteners market is the rising consumer health consciousness.
Market players are opting for technological advancement, new product developments and production capacity expansion.
The top 5 producers of naturally derived sweeteners hold around 21% of the market share.
The USA, India, and China are the major countries driving demand for naturally derived sweeteners.
The major players involved in the naturally derived sweeteners market are E. I. du Pont de Nemours Company, Archer Daniels Midland Company, Merisant Company, Tate & Lyle PLC, Cargill, Madhava Natural Sweeteners, PureCircle Limited, Herboveda India Pvt. Ltd. GLG Lifetech Corporation Wisdom Natural Brands (SweetLeaf Stevia),.
East Asia holds around 37.8% of the total naturally derived sweeteners revenue share.
USA naturally derived sweeteners market is projected to grow at a CAGR of around 4.5% over the next ten years.
Explore Flavors & Sweeteners Insights
Thank you!
You will receive an email from our Business Development Manager. Please be sure to check your SPAM/JUNK folder too.