Starch-derived Fiber Market Size and Share Forecast Outlook 2025 to 2035

The starch-derived fiber market is estimated to be valued at USD 65.0 billion in 2025 and is projected to reach USD 110.0 billion by 2035, registering a CAGR of 5.4% over the forecast period. The starch-derived fiber market is projected to add an absolute dollar opportunity of USD 41.9 billion over the forecast period.
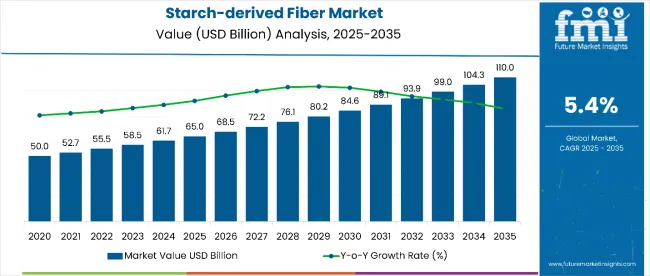
Quick Stats for Starch-derived Fiber Market

  • Starch-derived Fiber Market Value (2025): USD 65.0 billion
  • Starch-derived Fiber Market Forecast Value (2035): USD 110.0 billion
  • Starch-derived Fiber Market Forecast CAGR: 5.4%
  • Leading Segment in Starch-derived Fiber Market in 2025: Edible/food grade (67%)
  • Key Growth Regions in Starch-derived Fiber Market: North America, Asia-Pacific, Europe
  • Top Key Players in Starch-derived Fiber Market: Ixtlera, Cargill Inc., Dadtco Phil Africa B.V., Alliance Grain Traders Inc., Pocantico Resources, Ingredion Incorporated.

Starch Derived Fiber Market

Metric Value
Starch-derived Fiber Market Estimated Value in (2025E) USD 65.0 billion
Starch-derived Fiber Market Forecast Value in (2035F) USD 110.0 billion
Forecast CAGR (2025 to 2035) 5.4%

This reflects a 1.69 times growth at a compound annual growth rate of 5.4%. The market's evolution is expected to be shaped by rising demand for natural dietary fiber ingredients in functional foods, pharmaceutical applications, and industrial biotechnology sectors, particularly where digestive health benefits and clean-label positioning are prioritized.

By 2030, the market is likely to reach approximately USD 85.0 billion, accounting for USD 20.0 billion in incremental value over the first half of the decade. The remaining USD 25.0 billion is expected during the second half, suggesting a moderately back-loaded growth pattern. Product substitution for synthetic fiber ingredients and traditional dietary supplements is gaining traction due to starch-derived fiber's superior functional properties and natural origin positioning.

Companies such as Cargill Incorporated and Ingredion Incorporated are advancing their competitive positions through investment in biotechnology research and scalable fiber extraction technologies. Health-focused procurement models are supporting expansion into nutraceutical manufacturing, pharmaceutical excipient production, and industrial biotechnology applications. Market performance will remain anchored in clean-label certification standards, functional efficacy benchmarks, and sustainable sourcing practices.

The market holds approximately 26% of the functional fiber ingredients market, driven by its superior digestive health benefits and versatility across food and pharmaceutical applications. It accounts for around 18% of the specialty dietary fiber market, supported by its clean-label positioning and compatibility with natural food formulation requirements.

The market contributes nearly 14% to the nutraceutical ingredients market, particularly for products targeting digestive wellness and metabolic health support. It holds close to 22% of the pharmaceutical excipient market for fiber-based applications, where starch-derived fibers are used for drug delivery, binding, and disintegration properties.

The market is undergoing structural change driven by rising demand for natural and sustainable fiber ingredients with proven health benefits. Advanced extraction and processing methods using enzymatic modification and controlled fermentation have enhanced fiber functionality, bioavailability, and application versatility, making starch-derived fibers viable alternatives to synthetic and traditional fiber ingredients.

Manufacturers are introducing organic certifications and functional health claims tailored for nutraceutical brands and pharmaceutical companies, expanding their role beyond basic dietary supplementation. Strategic collaborations between agricultural suppliers and biotechnology companies have accelerated innovation in specialized fiber production.

Starch-derived Fiber Market Analysis by Top Investment Segments

The market is segmented by raw material, form, type, and region. By raw material, the market is divided into corn, wheat, sweet potatoes, others (such as cassava, barley, and rice). Based on form, the market is bifurcated into spun and filaments. In terms of type, the market includes edible/food-grade and industrial-grade. Regionally, the market is classified into North America, Latin America, Europe, East Asia, South Asia, Oceania, and the Middle East & Africa.
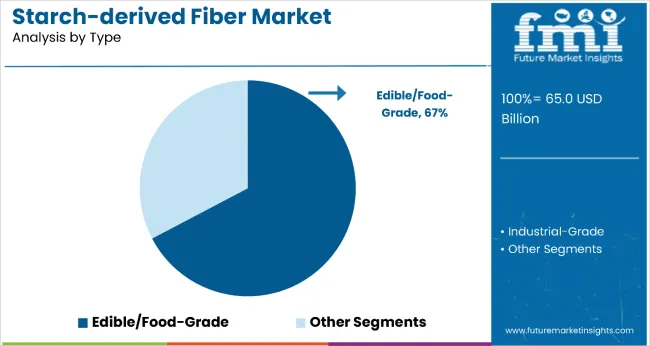
By Type, Edible/Food-Grade Segment Accounts for 67% of the Market Share

Starch Derived Fiber Market By Type

The edible/food-grade segment leads the type category with a dominant 67% market share, driven by growing consumer demand for functional foods and dietary supplements containing safe, natural fiber ingredients. Food-grade starch-derived fiber complies with stringent regulatory and quality standards necessary for human consumption, reinforcing its credibility across health-focused product formulations.

Its alignment with nutraceutical applications enhances market adoption, especially as innovations in purification and bioavailability continue to improve product efficacy without compromising safety.

The segment thrives amid rising interest in digestive health claims and transparent, evidence-based nutrition. As the functional ingredient market evolves, food-grade starch-derived fiber remains a preferred choice for manufacturers seeking to meet consumer expectations for wellness, clean labels, and scientifically backed health benefits.
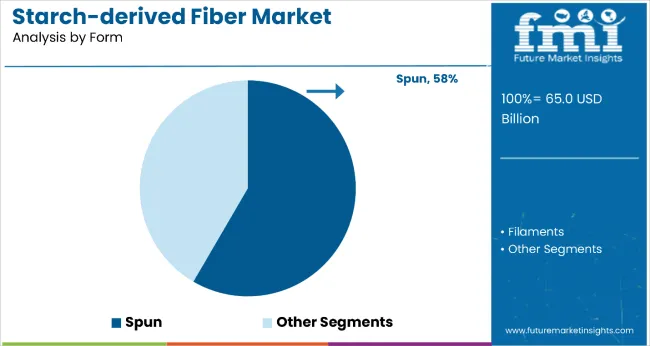
By Form, Spun Segment Accounts for 58% of the Market Share

Starch Derived Fiber Market By Form

The spun form segment commands a 58% share in the starch-derived fiber market, reflecting increased demand for processed fiber formats that offer enhanced functionality and processing efficiency. Spun starch-derived fiber delivers superior dispersibility and integration compared to conventional forms, making it ideal for use in both food and pharmaceutical applications.

Advanced manufacturing processes allow for uniform particle sizes and reliable performance, addressing formulation needs across diverse product categories.

Growth is further supported by technological advancements that lower production costs while maintaining consistent quality. As functional foods and pharmaceutical excipients gain importance, spun starch-derived fiber is expected to play a growing role in delivering high-performance, application-specific solutions within specialty ingredient and industrial processing sectors.

Why is the Starch-derived Fiber Market Growing?

Starch-derived fiber's proven digestive health benefits, superior functional properties, and natural origin make it an attractive ingredient for health-conscious consumers seeking effective dietary fiber solutions.

Growing awareness of gut health importance and the connection between fiber intake and overall wellness is further propelling adoption, especially among nutraceutical manufacturers targeting digestive health applications. Government support for functional food development, along with innovations in biotechnology processing techniques, are also enhancing product quality and application versatility.

As consumer preferences shift toward clean-label ingredients and evidence-based nutrition, and as research continues to validate starch-derived fiber's health benefits in clinical studies, the market outlook remains favorable. With manufacturers and formulators prioritizing ingredient transparency, functional efficacy, and sustainable sourcing practices, starch-derived fiber is well-positioned to expand across various food, pharmaceutical, and industrial applications.

What are the Drivers, Restraints, and Key Trends of the Starch-derived Fiber Market?

From 2025 to 2035, biotechnology advancement systems were introduced in fiber processing facilities, improving extraction efficiency, enhancing product purity, and supporting scalable production capabilities. These developments position technology-enabled fiber producers as key partners for brands seeking consistent quality ingredients and verified functional claims for health-focused product formulations.

Digestive Health Awareness Drives Starch-derived Fiber Adoption

The growing recognition of starch-derived fiber's superior digestive health benefits and prebiotic properties has been identified as the primary catalyst for growth in the starch-derived fiber market. In 2024, increased consumer awareness of gut health importance prompted widespread adoption of starch-derived fiber ingredients in functional foods, dietary supplements, and pharmaceutical formulations targeting digestive wellness applications.

By 2025, nutraceutical manufacturers were incorporating specialized starch-derived fiber formulations into probiotic products, digestive health supplements, and functional beverages to address consumer demand for evidence-based gut health solutions.

Biotechnology Innovation Creates Advanced Processing Opportunities

In 2024, fiber processing companies began implementing advanced biotechnology systems to optimize starch-derived fiber extraction, purification, and modification processes, leading to improved product consistency and enhanced functional properties.

By 2025, specialized processing facilities were adopting enzymatic modification and controlled fermentation technologies for starch-derived fiber production, supporting premium positioning and expanded application possibilities. These implementations demonstrate that when starch-derived fiber adopts advanced biotechnology processing and quality control systems, product performance and market positioning opportunities are significantly enhanced.
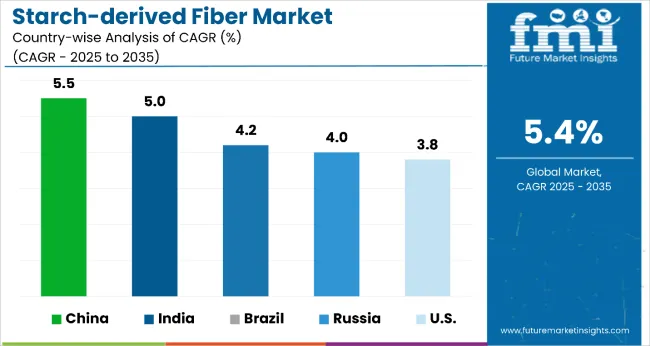
Analysis of Starch-derived Fiber Market by Key Countries

Starch Derived Fiber Market Country Wise Analysis

Country CAGR
China 5.5%
India 5.0%
Brazil 4.2%
Russia 4.0%
USA 3.8%

In the starch-derived fiber market, China leads with the highest projected CAGR of 5.5% (2025 to 2035). India follows closely with a CAGR of 5.0%, supported by regional processing hubs and strong government backing for pharmaceutical applications. Brazil ranks third at 4.2% CAGR, leveraging its dual corn harvest system and low-cost processing advantages.

Russia’s market is growing at 4.0% CAGR, supported by increasing corn acreage and domestic demand, though constrained by geopolitical trade limits. The USA posts a comparatively modest CAGR of 3.8%, slightly below the global average, due to mature markets but strong demand in regulated nutraceutical sectors.

The report covers an in-depth analysis of 40+ countries; five top performing OECD countries are highlighted below.

Production Capacity Trends in Starch-derived Fiber Market in China

Starch-derived fiber market in China is projected to grow at a CAGR of 5.5% from 2025 to 2035, outperforming the global average by 1.8%. The growth is linked to large-scale biotechnology research facilities in Jiangsu, Shandong, and Guangdong provinces. Advanced fiber extraction technologies are widely adopted in pharmaceutical manufacturing and functional food production.

Output has been expanded by government support for biotechnology innovation and health ingredient development programs. Starch-derived fiber products are increasingly replacing synthetic additives in domestic food manufacturing and pharmaceutical applications. More than half the production is linked to certified facilities catering to export demand in Southeast Asia, North America, and Europe.

  • 1.8 million tons of pharmaceutical-grade starch-derived fiber were produced in China in 2024
  • 156 biotechnology processing facilities operated at full capacity for fiber extraction in 2023 to 2024
  • 68% of China's starch-derived fiber production certified under international quality standards in 2024

Market Development in Starch-derived Fiber Market in India

Starch-derived fiber revenue in India is forecast to grow at a CAGR of 5.0% from 2025 to 2035, ahead of the global average by 1.4%. Regional processing clusters in Maharashtra, Gujarat, and Karnataka have expanded production of specialty starch-derived fibers for pharmaceutical and nutraceutical applications.

Government-supported biotechnology initiatives are encouraging fiber ingredient development for domestic healthcare markets. Processing companies have developed integrated supply chains from agricultural sourcing to finished fiber products while maintaining cost competitiveness. Export volumes to Middle Eastern and African markets are rising, particularly for pharmaceutical-grade fiber ingredients used in drug formulation and dietary supplements.
  • 2.4 million tons of starch-derived fiber processed in India during FY 2024
  • 28% YoY growth in pharmaceutical-grade fiber production between 2023 to 2024
  • 1,280 nutraceutical manufacturing projects adopted Indian-produced starch-derived fiber across twelve states in 2024

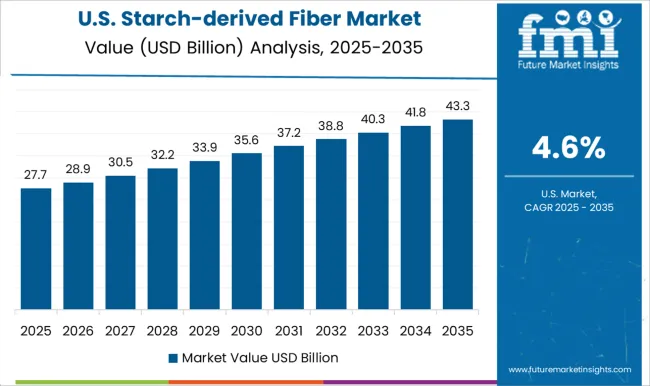
Growth Analysis of Starch-derived Fiber Market in the United States

The USA starch-derived fiber demand is expected to grow at a CAGR of 3.8% from 2025 to 2035, slightly underperforming the global average by 0.1%. Demand is driven by nutraceutical manufacturers and pharmaceutical companies seeking FDA-compliant fiber ingredients for functional food and drug applications.

Regional production in Midwest agricultural states supports domestic supply chains, though specialized applications require premium-grade imports from biotechnology leaders. Advanced processing facilities are developing application-specific fiber formulations for targeted health benefits while maintaining regulatory compliance.

  • 2.1 million tons of food-grade starch-derived fiber consumed through USA health product channels in 2024
  • 56% of pharmaceutical applications met FDA regulatory requirements for fiber excipients locally
  • 1,840 nutraceutical companies specified starch-derived fiber for digestive health product formulations in 2024

Starch-derived Fiber Market Analysis in Brazil

Sales of starch-derived fiber in Brazil are projected to grow at a CAGR of 4.2% during the forecast period. Brazil’s corn starch market is expanding rapidly, supported by the country’s abundant corn production from both its primary and safrinha (second) harvest seasons. Its competitive agricultural cost structure makes Brazil one of the most efficient corn processors globally.

As demand for starch in the food and industrial sectors grows, Brazilian manufacturers are ramping up capacity. Additionally, favorable climatic conditions and government-backed agricultural financing aid long-term production expansion. Though infrastructure remains a challenge in some regions, investments in logistics are improving supply chain efficiency.

  • Expanding two-season corn harvesting increases supply consistency.
  • Low production costs offer a competitive edge in global markets.
  • Demand rising across food, textile, and industrial sectors

Russia Starch-derived Fiber Market Growth Analysis

The starch-derived fiber revenue in Russia is expected to register a CAGR of 4.0% during the forecast period. Russia is gaining traction in the corn starch market through modernization of its agricultural systems and increasing domestic processing capacity. While wheat remains the dominant crop, corn cultivation is expanding steadily, especially in the southern regions.

Russian corn starch is primarily consumed within the country, supporting sectors like food processing, paper, and construction materials. Additionally, Russia’s geopolitical orientation toward self-reliance has driven investment into local starch production. Government incentives and technology upgrades are helping improve yields and quality. Although exports are limited due to trade restrictions, there is growing potential for expansion into Asia and Eastern Europe.
  • Southern Russia increasing corn acreage for processing.
  • Domestic starch use growing in food and paper sectors.
  • Geopolitical shifts fueling self-sufficiency in raw materials.

Competitive Landscape of Starch-derived Fiber Market

Starch Derived Fiber Market By Company

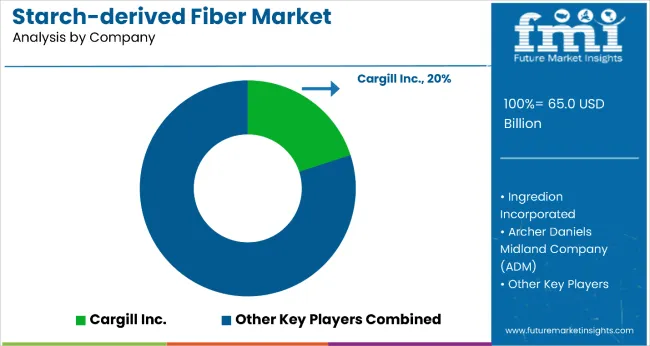
The starch-derived fiber market is moderately consolidated and the company holds a dominant position through its advanced biotechnology processing capabilities, extensive agricultural supply networks, and established relationships with pharmaceutical and nutraceutical manufacturers.

Dominant player status is held exclusively by Cargill Inc. Key players include Ingredion Incorporated, Archer Daniels Midland, Dadtco Phil Africa B.V., Alliance Grain Traders Inc., Pocantico Resources, Ixtlera, HL Agro, Viva Pharmaceutical Inc., and Watson Inc., each providing specialized starch-derived fiber solutions featuring advanced extraction technologies, pharmaceutical-grade purity standards, and application-specific formulations designed for digestive health, pharmaceutical excipients, and industrial biotechnology applications.

Emerging players are limited in this category due to high biotechnology investment requirements and the dominance of established agricultural processing companies with integrated supply chains. Market demand is driven by growing consumer awareness of digestive health benefits, increasing pharmaceutical excipient applications, and rising adoption of clean-label functional ingredients in health-focused product formulations.

Key Developments in Starch-derived Fiber Market

Manufacturers are advancing biotechnology processing techniques and enzymatic modification methods for improved fiber functionality and bioavailability, expanding starch-derived fiber's suitability for pharmaceutical, nutraceutical, and specialized food applications. Agricultural suppliers are investing in sustainable sourcing practices and quality certification systems, while processing companies scale biotechnology operations for global distribution.

  • In July 2024, BENEO, a leading supplier of functional ingredients, introduced a range of resistant starches derived from natural sources like corn and potatoes. (Source: BENEO)

Scope of the Report - Starch-derived Fiber Market

Item Value
Quantitative Units USD 65.0 Billion
Raw Material Corn, Wheat, Sweet Potatoes, and Others
Form Spun and Filaments
Type Edible/Food-Grade and Industrial-Grade
Regions Covered North America, Europe, Asia-Pacific, Latin America, Middle East & Africa
Country Covered United States, Canada, Germany, France, United Kingdom, China, Japan, India, Brazil, South Africa, and 40+ countries
Key Companies Profiled Ixtlera, Cargill Inc., Dadtco Phil Africa B.V., Alliance Grain Traders Inc., Pocantico Resources, Ingredion Incorporated, Archer Daniels Midland, HL Agro, Viva Pharmaceutical Inc., Watson Inc.
Additional Attributes Dollar sales by raw material and type classification, growing usage in pharmaceutical excipient applications and functional food manufacturing for digestive health benefits, stable demand in nutraceutical and biotechnology markets, innovations in extraction processing and biotechnology modification improve product functionality, bioavailability, and application versatility

Key Segments

By Raw Material:

  • Corn
  • Wheat
  • Sweet Potatoes
  • Others (Cassava, Barley, Rice, Sorghum)

By Form:

  • Spun
  • Filaments

By Type:

  • Edible/Food-Grade
  • Industrial-Grade

By Region:

  • North America
  • Latin America
  • Western Europe
  • Eastern Europe
  • East Asia
  • South Asia & Pacific
  • Middle East and Africa

Table of Content

  1. Executive Summary
    • Global Market Outlook
    • Demand-side Trends
    • Supply-side Trends
    • Technology Roadmap Analysis
    • Analysis and Recommendations
  2. Market Overview
    • Market Coverage / Taxonomy
    • Market Definition / Scope / Limitations
  3. Market Background
    • Market Dynamics
      • Drivers
      • Restraints
      • Opportunity
      • Trends
    • Scenario Forecast
      • Demand in Optimistic Scenario
      • Demand in Likely Scenario
      • Demand in Conservative Scenario
    • Opportunity Map Analysis
    • Product Life Cycle Analysis
    • Supply Chain Analysis
      • Supply Side Participants and their Roles
        • Producers
        • Mid-Level Participants (Traders/ Agents/ Brokers)
        • Wholesalers and Distributors
      • Value Added and Value Created at Node in the Supply Chain
      • List of Raw Material Suppliers
      • List of Existing and Potential Buyer’s
    • Investment Feasibility Matrix
    • Value Chain Analysis
      • Profit Margin Analysis
      • Wholesalers and Distributors
      • Retailers
    • PESTLE and Porter’s Analysis
    • Regulatory Landscape
      • By Key Regions
      • By Key Countries
    • Regional Parent Market Outlook
    • Production and Consumption Statistics
    • Import and Export Statistics
  4. Global Market Analysis 2020 to 2024 and Forecast, 2025 to 2035
    • Historical Market Size Value (USD Billion) & Volume (Metric Tons) Analysis, 2020 to 2024
    • Current and Future Market Size Value (USD Billion) & Volume (Metric Tons) Projections, 2025 to 2035
      • Y-o-Y Growth Trend Analysis
      • Absolute $ Opportunity Analysis
  5. Global Market Pricing Analysis 2020 to 2024 and Forecast 2025 to 2035
  6. Global Market Analysis 2020 to 2024 and Forecast 2025 to 2035, By Raw Material
    • Introduction / Key Findings
    • Historical Market Size Value (USD Billion) & Volume (Metric Tons) Analysis By Raw Material, 2020 to 2024
    • Current and Future Market Size Value (USD Billion) & Volume (Metric Tons) Analysis and Forecast By Raw Material, 2025 to 2035
      • Corn
      • Wheat
      • Sweet Potatoes
      • Others (Cassava, Barley, Rice, Sorghum)
    • Y-o-Y Growth Trend Analysis By Raw Material, 2020 to 2024
    • Absolute $ Opportunity Analysis By Raw Material, 2025 to 2035
  7. Global Market Analysis 2020 to 2024 and Forecast 2025 to 2035, By Form
    • Introduction / Key Findings
    • Historical Market Size Value (USD Billion) & Volume (Metric Tons) Analysis By Form, 2020 to 2024
    • Current and Future Market Size Value (USD Billion) & Volume (Metric Tons) Analysis and Forecast By Form, 2025 to 2035
      • Spun
      • Filaments
    • Y-o-Y Growth Trend Analysis By Form, 2020 to 2024
    • Absolute $ Opportunity Analysis By Form, 2025 to 2035
  8. Global Market Analysis 2020 to 2024 and Forecast 2025 to 2035, By Type
    • Introduction / Key Findings
    • Historical Market Size Value (USD Billion) & Volume (Metric Tons) Analysis By Type, 2020 to 2024
    • Current and Future Market Size Value (USD Billion) & Volume (Metric Tons) Analysis and Forecast By Type, 2025 to 2035
      • Edible/Food-Grade
      • Industrial-Grade
    • Y-o-Y Growth Trend Analysis By Type, 2020 to 2024
    • Absolute $ Opportunity Analysis By Type, 2025 to 2035
  9. Global Market Analysis 2020 to 2024 and Forecast 2025 to 2035, By Region
    • Introduction
    • Historical Market Size Value (USD Billion) & Volume (Metric Tons) Analysis By Region, 2020 to 2024
    • Current Market Size Value (USD Billion) & Volume (Metric Tons) Analysis and Forecast By Region, 2025 to 2035
      • North America
      • Latin America
      • Western Europe
      • Eastern Europe
      • East Asia
      • South Asia & Pacific
      • Middle East and Africa
    • Market Attractiveness Analysis By Region
  10. North America Market Analysis 2020 to 2024 and Forecast 2025 to 2035, By Country
    • Historical Market Size Value (USD Billion) & Volume (Metric Tons) Trend Analysis By Market Taxonomy, 2020 to 2024
    • Market Size Value (USD Billion) & Volume (Metric Tons) Forecast By Market Taxonomy, 2025 to 2035
      • By Country
        • USA
        • Canada
        • Mexico
      • By Raw Material
      • By Form
      • By Type
    • Market Attractiveness Analysis
      • By Country
      • By Raw Material
      • By Form
      • By Type
    • Key Takeaways
  11. Latin America Market Analysis 2020 to 2024 and Forecast 2025 to 2035, By Country
    • Historical Market Size Value (USD Billion) & Volume (Metric Tons) Trend Analysis By Market Taxonomy, 2020 to 2024
    • Market Size Value (USD Billion) & Volume (Metric Tons) Forecast By Market Taxonomy, 2025 to 2035
      • By Country
        • Brazil
        • Argentina
        • Rest of LATAM
      • By Raw Material
      • By Form
      • By Type
    • Market Attractiveness Analysis
      • By Country
      • By Raw Material
      • By Form
      • By Type
    • Key Takeaways
  12. Western Europe Market Analysis 2020 to 2024 and Forecast 2025 to 2035, By Country
    • Historical Market Size Value (USD Billion) & Volume (Metric Tons) Trend Analysis By Market Taxonomy, 2020 to 2024
    • Market Size Value (USD Billion) & Volume (Metric Tons) Forecast By Market Taxonomy, 2025 to 2035
      • By Country
        • Germany
        • Italy
        • France
        • UK
        • Spain
        • BENELUX
        • Nordic
        • Rest of W.Europe
      • By Raw Material
      • By Form
      • By Type
    • Market Attractiveness Analysis
      • By Country
      • By Raw Material
      • By Form
      • By Type
    • Key Takeaways
  13. Eastern Europe Market Analysis 2020 to 2024 and Forecast 2025 to 2035, By Country
    • Historical Market Size Value (USD Billion) & Volume (Metric Tons) Trend Analysis By Market Taxonomy, 2020 to 2024
    • Market Size Value (USD Billion) & Volume (Metric Tons) Forecast By Market Taxonomy, 2025 to 2035
      • By Country
        • Russia
        • Hungary
        • Poland
        • Balkan & Baltics
        • Rest of E. Europe
      • By Raw Material
      • By Form
      • By Type
    • Market Attractiveness Analysis
      • By Country
      • By Raw Material
      • By Form
      • By Type
    • Key Takeaways
  14. East Asia Market Analysis 2020 to 2024 and Forecast 2025 to 2035, By Country
    • Historical Market Size Value (USD Billion) & Volume (Metric Tons) Trend Analysis By Market Taxonomy, 2020 to 2024
    • Market Size Value (USD Billion) & Volume (Metric Tons) Forecast By Market Taxonomy, 2025 to 2035
      • By Country
        • China
        • Japan
        • South Korea
      • By Raw Material
      • By Form
      • By Type
    • Market Attractiveness Analysis
      • By Country
      • By Raw Material
      • By Form
      • By Type
    • Key Takeaways
  15. South Asia & Pacific Market Analysis 2020 to 2024 and Forecast 2025 to 2035, By Country
    • Historical Market Size Value (USD Billion) & Volume (Metric Tons) Trend Analysis By Market Taxonomy, 2020 to 2024
    • Market Size Value (USD Billion) & Volume (Metric Tons) Forecast By Market Taxonomy, 2025 to 2035
      • By Country
        • India
        • Australia & New Zealand
        • ASEAN
        • Rest of SAP
      • By Raw Material
      • By Form
      • By Type
    • Market Attractiveness Analysis
      • By Country
      • By Raw Material
      • By Form
      • By Type
    • Key Takeaways
  16. Middle East and Africa Market Analysis 2020 to 2024 and Forecast 2025 to 2035, By Country
    • Historical Market Size Value (USD Billion) & Volume (Metric Tons) Trend Analysis By Market Taxonomy, 2020 to 2024
    • Market Size Value (USD Billion) & Volume (Metric Tons) Forecast By Market Taxonomy, 2025 to 2035
      • By Country
        • GCC Countries
        • Northern Africa
        • South Africa
        • Turkiye
        • Rest of MEA
      • By Raw Material
      • By Form
      • By Type
    • Market Attractiveness Analysis
      • By Country
      • By Raw Material
      • By Form
      • By Type
    • Key Takeaways
  17. Key Countries Market Analysis
    • USA
      • Pricing Analysis
      • Market Share Analysis, 2024
        • By Raw Material
        • By Form
        • By Type
    • Canada
      • Pricing Analysis
      • Market Share Analysis, 2024
        • By Raw Material
        • By Form
        • By Type
    • Brazil
      • Pricing Analysis
      • Market Share Analysis, 2024
        • By Raw Material
        • By Form
        • By Type
    • Mexico
      • Pricing Analysis
      • Market Share Analysis, 2024
        • By Raw Material
        • By Form
        • By Type
    • Argentina
      • Pricing Analysis
      • Market Share Analysis, 2024
        • By Raw Material
        • By Form
        • By Type
  18. Market Structure Analysis
    • Competition Dashboard
    • Competition Benchmarking
    • Market Share Analysis of Top Players
      • By Regional
      • By Raw Material
      • By Form
      • By Type
  19. Competition Analysis
    • Competition Deep Dive
      • Ixtlera; Cargill Inc.
        • Overview
        • Product Portfolio
        • Profitability by Market Segments (Product/Age /Sales Channel/Region)
        • Sales Footprint
        • Strategy Overview
          • Marketing Strategy
          • Product Strategy
          • Channel Strategy
      • Dadtco Phil Africa B.V.
        • Overview
        • Product Portfolio
        • Profitability by Market Segments (Product/Age /Sales Channel/Region)
        • Sales Footprint
        • Strategy Overview
          • Marketing Strategy
          • Product Strategy
          • Channel Strategy
      • Alliance Grain Traders Inc.
        • Overview
        • Product Portfolio
        • Profitability by Market Segments (Product/Age /Sales Channel/Region)
        • Sales Footprint
        • Strategy Overview
          • Marketing Strategy
          • Product Strategy
          • Channel Strategy
      • Pocantico Resources
        • Overview
        • Product Portfolio
        • Profitability by Market Segments (Product/Age /Sales Channel/Region)
        • Sales Footprint
        • Strategy Overview
          • Marketing Strategy
          • Product Strategy
          • Channel Strategy
      • Ingredion Incorporated
        • Overview
        • Product Portfolio
        • Profitability by Market Segments (Product/Age /Sales Channel/Region)
        • Sales Footprint
        • Strategy Overview
          • Marketing Strategy
          • Product Strategy
          • Channel Strategy
      • Archer Daniels Midland
        • Overview
        • Product Portfolio
        • Profitability by Market Segments (Product/Age /Sales Channel/Region)
        • Sales Footprint
        • Strategy Overview
          • Marketing Strategy
          • Product Strategy
          • Channel Strategy
      • HL Agro
        • Overview
        • Product Portfolio
        • Profitability by Market Segments (Product/Age /Sales Channel/Region)
        • Sales Footprint
        • Strategy Overview
          • Marketing Strategy
          • Product Strategy
          • Channel Strategy
      • Viva Pharmaceutical Inc.
        • Overview
        • Product Portfolio
        • Profitability by Market Segments (Product/Age /Sales Channel/Region)
        • Sales Footprint
        • Strategy Overview
          • Marketing Strategy
          • Product Strategy
          • Channel Strategy
      • Watson Inc.
        • Overview
        • Product Portfolio
        • Profitability by Market Segments (Product/Age /Sales Channel/Region)
        • Sales Footprint
        • Strategy Overview
          • Marketing Strategy
          • Product Strategy
          • Channel Strategy
  20. Assumptions & Acronyms Used
  21. Research Methodology

List of Tables

  • Table 1: Global Market Value (USD Billion) Forecast by Region, 2020-2035
  • Table 2: Global Market Volume (Metric Tons) Forecast by Region, 2020-2035
  • Table 3: Global Market Value (USD Billion) Forecast by Raw Material, 2020-2035
  • Table 4: Global Market Volume (Metric Tons) Forecast by Raw Material, 2020-2035
  • Table 5: Global Market Value (USD Billion) Forecast by Form, 2020-2035
  • Table 6: Global Market Volume (Metric Tons) Forecast by Form, 2020-2035
  • Table 7: Global Market Value (USD Billion) Forecast by Type, 2020-2035
  • Table 8: Global Market Volume (Metric Tons) Forecast by Type, 2020-2035
  • Table 9: North America Market Value (USD Billion) Forecast by Country, 2020-2035
  • Table 10: North America Market Volume (Metric Tons) Forecast by Country, 2020-2035
  • Table 11: North America Market Value (USD Billion) Forecast by Raw Material, 2020-2035
  • Table 12: North America Market Volume (Metric Tons) Forecast by Raw Material, 2020-2035
  • Table 13: North America Market Value (USD Billion) Forecast by Form, 2020-2035
  • Table 14: North America Market Volume (Metric Tons) Forecast by Form, 2020-2035
  • Table 15: North America Market Value (USD Billion) Forecast by Type, 2020-2035
  • Table 16: North America Market Volume (Metric Tons) Forecast by Type, 2020-2035
  • Table 17: Latin America Market Value (USD Billion) Forecast by Country, 2020-2035
  • Table 18: Latin America Market Volume (Metric Tons) Forecast by Country, 2020-2035
  • Table 19: Latin America Market Value (USD Billion) Forecast by Raw Material, 2020-2035
  • Table 20: Latin America Market Volume (Metric Tons) Forecast by Raw Material, 2020-2035
  • Table 21: Latin America Market Value (USD Billion) Forecast by Form, 2020-2035
  • Table 22: Latin America Market Volume (Metric Tons) Forecast by Form, 2020-2035
  • Table 23: Latin America Market Value (USD Billion) Forecast by Type, 2020-2035
  • Table 24: Latin America Market Volume (Metric Tons) Forecast by Type, 2020-2035
  • Table 25: Western Europe Market Value (USD Billion) Forecast by Country, 2020-2035
  • Table 26: Western Europe Market Volume (Metric Tons) Forecast by Country, 2020-2035
  • Table 27: Western Europe Market Value (USD Billion) Forecast by Raw Material, 2020-2035
  • Table 28: Western Europe Market Volume (Metric Tons) Forecast by Raw Material, 2020-2035
  • Table 29: Western Europe Market Value (USD Billion) Forecast by Form, 2020-2035
  • Table 30: Western Europe Market Volume (Metric Tons) Forecast by Form, 2020-2035
  • Table 31: Western Europe Market Value (USD Billion) Forecast by Type, 2020-2035
  • Table 32: Western Europe Market Volume (Metric Tons) Forecast by Type, 2020-2035
  • Table 33: Eastern Europe Market Value (USD Billion) Forecast by Country, 2020-2035
  • Table 34: Eastern Europe Market Volume (Metric Tons) Forecast by Country, 2020-2035
  • Table 35: Eastern Europe Market Value (USD Billion) Forecast by Raw Material, 2020-2035
  • Table 36: Eastern Europe Market Volume (Metric Tons) Forecast by Raw Material, 2020-2035
  • Table 37: Eastern Europe Market Value (USD Billion) Forecast by Form, 2020-2035
  • Table 38: Eastern Europe Market Volume (Metric Tons) Forecast by Form, 2020-2035
  • Table 39: Eastern Europe Market Value (USD Billion) Forecast by Type, 2020-2035
  • Table 40: Eastern Europe Market Volume (Metric Tons) Forecast by Type, 2020-2035
  • Table 41: East Asia Market Value (USD Billion) Forecast by Country, 2020-2035
  • Table 42: East Asia Market Volume (Metric Tons) Forecast by Country, 2020-2035
  • Table 43: East Asia Market Value (USD Billion) Forecast by Raw Material, 2020-2035
  • Table 44: East Asia Market Volume (Metric Tons) Forecast by Raw Material, 2020-2035
  • Table 45: East Asia Market Value (USD Billion) Forecast by Form, 2020-2035
  • Table 46: East Asia Market Volume (Metric Tons) Forecast by Form, 2020-2035
  • Table 47: East Asia Market Value (USD Billion) Forecast by Type, 2020-2035
  • Table 48: East Asia Market Volume (Metric Tons) Forecast by Type, 2020-2035
  • Table 49: South Asia & Pacific Market Value (USD Billion) Forecast by Country, 2020-2035
  • Table 50: South Asia & Pacific Market Volume (Metric Tons) Forecast by Country, 2020-2035
  • Table 51: South Asia & Pacific Market Value (USD Billion) Forecast by Raw Material, 2020-2035
  • Table 52: South Asia & Pacific Market Volume (Metric Tons) Forecast by Raw Material, 2020-2035
  • Table 53: South Asia & Pacific Market Value (USD Billion) Forecast by Form, 2020-2035
  • Table 54: South Asia & Pacific Market Volume (Metric Tons) Forecast by Form, 2020-2035
  • Table 55: South Asia & Pacific Market Value (USD Billion) Forecast by Type, 2020-2035
  • Table 56: South Asia & Pacific Market Volume (Metric Tons) Forecast by Type, 2020-2035
  • Table 57: Middle East and Africa Market Value (USD Billion) Forecast by Country, 2020-2035
  • Table 58: Middle East and Africa Market Volume (Metric Tons) Forecast by Country, 2020-2035
  • Table 59: Middle East and Africa Market Value (USD Billion) Forecast by Raw Material, 2020-2035
  • Table 60: Middle East and Africa Market Volume (Metric Tons) Forecast by Raw Material, 2020-2035
  • Table 61: Middle East and Africa Market Value (USD Billion) Forecast by Form, 2020-2035
  • Table 62: Middle East and Africa Market Volume (Metric Tons) Forecast by Form, 2020-2035
  • Table 63: Middle East and Africa Market Value (USD Billion) Forecast by Type, 2020-2035
  • Table 64: Middle East and Africa Market Volume (Metric Tons) Forecast by Type, 2020-2035

List of Figures

  • Figure 1: Global Market Volume (Metric Tons) Forecast 2020-2035
  • Figure 2: Global Market Pricing Analysis
  • Figure 3: Global Market Value (USD Billion) Forecast 2020-2035
  • Figure 4: Global Market Value Share and BPS Analysis by Raw Material, 2025 and 2035
  • Figure 5: Global Market Y-o-Y Growth Comparison by Raw Material, 2025-2035
  • Figure 6: Global Market Attractiveness Analysis by Raw Material
  • Figure 7: Global Market Value Share and BPS Analysis by Form, 2025 and 2035
  • Figure 8: Global Market Y-o-Y Growth Comparison by Form, 2025-2035
  • Figure 9: Global Market Attractiveness Analysis by Form
  • Figure 10: Global Market Value Share and BPS Analysis by Type, 2025 and 2035
  • Figure 11: Global Market Y-o-Y Growth Comparison by Type, 2025-2035
  • Figure 12: Global Market Attractiveness Analysis by Type
  • Figure 13: Global Market Value (USD Billion) Share and BPS Analysis by Region, 2025 and 2035
  • Figure 14: Global Market Y-o-Y Growth Comparison by Region, 2025-2035
  • Figure 15: Global Market Attractiveness Analysis by Region
  • Figure 16: North America Market Incremental $ Opportunity, 2025-2035
  • Figure 17: Latin America Market Incremental $ Opportunity, 2025-2035
  • Figure 18: Western Europe Market Incremental $ Opportunity, 2025-2035
  • Figure 19: Eastern Europe Market Incremental $ Opportunity, 2025-2035
  • Figure 20: East Asia Market Incremental $ Opportunity, 2025-2035
  • Figure 21: South Asia & Pacific Market Incremental $ Opportunity, 2025-2035
  • Figure 22: Middle East and Africa Market Incremental $ Opportunity, 2025-2035
  • Figure 23: North America Market Value Share and BPS Analysis by Country, 2025 and 2035
  • Figure 24: North America Market Value Share and BPS Analysis by Raw Material, 2025 and 2035
  • Figure 25: North America Market Y-o-Y Growth Comparison by Raw Material, 2025-2035
  • Figure 26: North America Market Attractiveness Analysis by Raw Material
  • Figure 27: North America Market Value Share and BPS Analysis by Form, 2025 and 2035
  • Figure 28: North America Market Y-o-Y Growth Comparison by Form, 2025-2035
  • Figure 29: North America Market Attractiveness Analysis by Form
  • Figure 30: North America Market Value Share and BPS Analysis by Type, 2025 and 2035
  • Figure 31: North America Market Y-o-Y Growth Comparison by Type, 2025-2035
  • Figure 32: North America Market Attractiveness Analysis by Type
  • Figure 33: Latin America Market Value Share and BPS Analysis by Country, 2025 and 2035
  • Figure 34: Latin America Market Value Share and BPS Analysis by Raw Material, 2025 and 2035
  • Figure 35: Latin America Market Y-o-Y Growth Comparison by Raw Material, 2025-2035
  • Figure 36: Latin America Market Attractiveness Analysis by Raw Material
  • Figure 37: Latin America Market Value Share and BPS Analysis by Form, 2025 and 2035
  • Figure 38: Latin America Market Y-o-Y Growth Comparison by Form, 2025-2035
  • Figure 39: Latin America Market Attractiveness Analysis by Form
  • Figure 40: Latin America Market Value Share and BPS Analysis by Type, 2025 and 2035
  • Figure 41: Latin America Market Y-o-Y Growth Comparison by Type, 2025-2035
  • Figure 42: Latin America Market Attractiveness Analysis by Type
  • Figure 43: Western Europe Market Value Share and BPS Analysis by Country, 2025 and 2035
  • Figure 44: Western Europe Market Value Share and BPS Analysis by Raw Material, 2025 and 2035
  • Figure 45: Western Europe Market Y-o-Y Growth Comparison by Raw Material, 2025-2035
  • Figure 46: Western Europe Market Attractiveness Analysis by Raw Material
  • Figure 47: Western Europe Market Value Share and BPS Analysis by Form, 2025 and 2035
  • Figure 48: Western Europe Market Y-o-Y Growth Comparison by Form, 2025-2035
  • Figure 49: Western Europe Market Attractiveness Analysis by Form
  • Figure 50: Western Europe Market Value Share and BPS Analysis by Type, 2025 and 2035
  • Figure 51: Western Europe Market Y-o-Y Growth Comparison by Type, 2025-2035
  • Figure 52: Western Europe Market Attractiveness Analysis by Type
  • Figure 53: Eastern Europe Market Value Share and BPS Analysis by Country, 2025 and 2035
  • Figure 54: Eastern Europe Market Value Share and BPS Analysis by Raw Material, 2025 and 2035
  • Figure 55: Eastern Europe Market Y-o-Y Growth Comparison by Raw Material, 2025-2035
  • Figure 56: Eastern Europe Market Attractiveness Analysis by Raw Material
  • Figure 57: Eastern Europe Market Value Share and BPS Analysis by Form, 2025 and 2035
  • Figure 58: Eastern Europe Market Y-o-Y Growth Comparison by Form, 2025-2035
  • Figure 59: Eastern Europe Market Attractiveness Analysis by Form
  • Figure 60: Eastern Europe Market Value Share and BPS Analysis by Type, 2025 and 2035
  • Figure 61: Eastern Europe Market Y-o-Y Growth Comparison by Type, 2025-2035
  • Figure 62: Eastern Europe Market Attractiveness Analysis by Type
  • Figure 63: East Asia Market Value Share and BPS Analysis by Country, 2025 and 2035
  • Figure 64: East Asia Market Value Share and BPS Analysis by Raw Material, 2025 and 2035
  • Figure 65: East Asia Market Y-o-Y Growth Comparison by Raw Material, 2025-2035
  • Figure 66: East Asia Market Attractiveness Analysis by Raw Material
  • Figure 67: East Asia Market Value Share and BPS Analysis by Form, 2025 and 2035
  • Figure 68: East Asia Market Y-o-Y Growth Comparison by Form, 2025-2035
  • Figure 69: East Asia Market Attractiveness Analysis by Form
  • Figure 70: East Asia Market Value Share and BPS Analysis by Type, 2025 and 2035
  • Figure 71: East Asia Market Y-o-Y Growth Comparison by Type, 2025-2035
  • Figure 72: East Asia Market Attractiveness Analysis by Type
  • Figure 73: South Asia & Pacific Market Value Share and BPS Analysis by Country, 2025 and 2035
  • Figure 74: South Asia & Pacific Market Value Share and BPS Analysis by Raw Material, 2025 and 2035
  • Figure 75: South Asia & Pacific Market Y-o-Y Growth Comparison by Raw Material, 2025-2035
  • Figure 76: South Asia & Pacific Market Attractiveness Analysis by Raw Material
  • Figure 77: South Asia & Pacific Market Value Share and BPS Analysis by Form, 2025 and 2035
  • Figure 78: South Asia & Pacific Market Y-o-Y Growth Comparison by Form, 2025-2035
  • Figure 79: South Asia & Pacific Market Attractiveness Analysis by Form
  • Figure 80: South Asia & Pacific Market Value Share and BPS Analysis by Type, 2025 and 2035
  • Figure 81: South Asia & Pacific Market Y-o-Y Growth Comparison by Type, 2025-2035
  • Figure 82: South Asia & Pacific Market Attractiveness Analysis by Type
  • Figure 83: Middle East and Africa Market Value Share and BPS Analysis by Country, 2025 and 2035
  • Figure 84: Middle East and Africa Market Value Share and BPS Analysis by Raw Material, 2025 and 2035
  • Figure 85: Middle East and Africa Market Y-o-Y Growth Comparison by Raw Material, 2025-2035
  • Figure 86: Middle East and Africa Market Attractiveness Analysis by Raw Material
  • Figure 87: Middle East and Africa Market Value Share and BPS Analysis by Form, 2025 and 2035
  • Figure 88: Middle East and Africa Market Y-o-Y Growth Comparison by Form, 2025-2035
  • Figure 89: Middle East and Africa Market Attractiveness Analysis by Form
  • Figure 90: Middle East and Africa Market Value Share and BPS Analysis by Type, 2025 and 2035
  • Figure 91: Middle East and Africa Market Y-o-Y Growth Comparison by Type, 2025-2035
  • Figure 92: Middle East and Africa Market Attractiveness Analysis by Type
  • Figure 93: Global Market - Tier Structure Analysis
  • Figure 94: Global Market - Company Share Analysis

Frequently Asked Questions

How big is the starch-derived fiber market in 2025?

The global starch-derived fiber market is estimated to be valued at USD 65.0 billion in 2025.

What will be the size of starch-derived fiber market in 2035?

The market size for the starch-derived fiber market is projected to reach USD 110.0 billion by 2035.

How much will be the starch-derived fiber market growth between 2025 and 2035?

The starch-derived fiber market is expected to grow at a 5.4% CAGR between 2025 and 2035.

Which form type is projected to lead in the starch-derived fiber market in 2025?

The spun form is projected to lead in the starch-derived fiber market with 58% market share in 2025.

Which application segment to contribute significant share in the starch-derived fiber market in 2025?

In terms of application, edible/food-grade segment to command 67% share in the starch-derived fiber market in 2025.

Explore Similar Insights

Future Market Insights

Starch-derived Fiber Market