Fiber Cement Market Size and Share Forecast Outlook 2025 to 2035

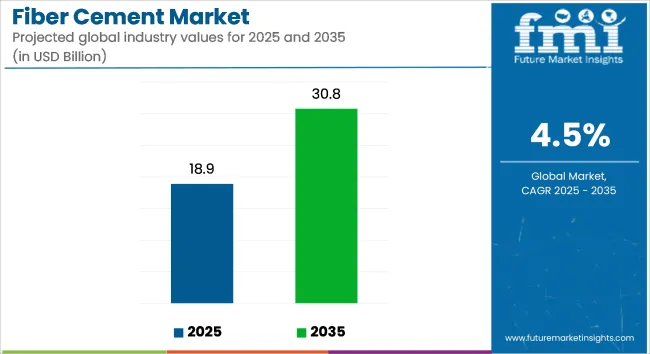
The global fiber cement market is estimated to be valued at USD 18.9 billion in 2025 and is forecast to grow to USD 30.8 billion by 2035, advancing at a CAGR of 4.5% during the forecast period. Market growth is being driven by increasing demand for durable, cost-effective, and environmentally sustainable construction materials across residential, commercial, and industrial infrastructure projects.
Quick Stats for Fiber Cement Market

  • Industry Value (2025): USD 18.9 billion
  • Forecast Value (2035): USD 30.8 billion
  • Forecast CAGR (2025 to 2035): 4.5%
  • Leading Application Segment (2025): Siding - ~42% share
  • Key Growth Regions: United States, China, India, Brazil, Southeast Asia
  • Top Key Players: James Hardie Industries, Etex Group, Nichiha Corporation, Swisspearl Group, SCG Building Materials, Everest Industries, Saint-Gobain, Cembrit Holding A/S, Elementia, Plycem
Fiber Cement Market Industry Value Analysis
Metric Value
Industry Size (2025E) USD 18.9 billion
Industry Value (2035F) USD 30.8 billion
CAGR (2025 to 2035) 4.5%

Fiber cement is being adopted as a fire-resistant, termite-proof, and moisture-tolerant alternative to traditional wood and asbestos-based construction products. The material is being used in roofing, wall cladding, external facades, siding panels, and structural applications. Its long service life and minimal maintenance requirements are making it a preferred solution among architects, contractors, and regulatory authorities focused on building safety and environmental compliance.

Strict building codes and safety standards are reinforcing the adoption of fiber cement boards and panels, particularly in regions experiencing rapid urbanization and population growth. Applications in affordable housing, modular construction, and disaster-resilient infrastructure are further accelerating demand. As governments implement green building regulations and promote sustainable development, the use of low-VOC, non-toxic materials such as fiber cement is being encouraged.

Adoption challenges include high upfront costs, labor-intensive installation processes, and limited consumer awareness in developing markets. However, ongoing product innovation aimed at improving workability, lightweight construction, and aesthetic design is helping mitigate these barriers. Manufacturers are investing in prefabricated and interlocking fiber cement systems to streamline installation and reduce overall project costs.

Eco-friendly variants of fiber cement, incorporating recycled content and low-emission binders, are being introduced to align with environmental building certifications such as LEED and BREEAM. These advancements are supporting broader use in both new construction and renovation projects.

With infrastructure investment being scaled across urban and semi-urban developments, fiber cement is expected to maintain relevance as a performance-driven and regulation-compliant material. The market is projected to experience sustained growth through 2035, supported by sustainability mandates, construction modernization, and the global shift toward resilient building systems.

Analyzing Fiber Cement Market by Top Investing Segments

Siding Applications Projected to Dominate Market Share Due to Durability and Aesthetic Versatility

Siding is estimated to account for approximately 42% of the global fiber cement market share in 2025 and is expected to maintain leadership through 2035, growing at a CAGR of 5.7%. Its superior resistance to warping, rotting, pests, and weathering has made it the preferred solution in residential and light commercial projects.

Demand for plank, lap, and vertical siding panels is increasing in both developed and emerging markets due to rising renovation activity and fire-safety concerns. Fiber cement siding also offers a wide range of finishes that mimic wood, stone, or brick, which appeals to architects and homeowners seeking performance with visual appeal.

In addition, growing demand for low-maintenance materials is favoring siding adoption in suburban and coastal regions. Companies such as James Hardie and Nichiha are investing in high-performance textured finishes and factory-painted sidings to boost value-added offerings.
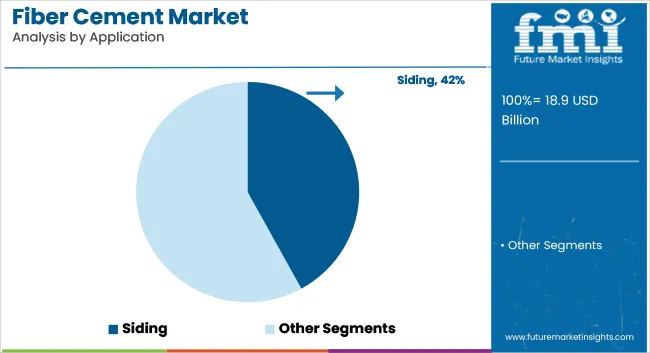
Fiber Cement Market Analysis By Application

Residential Construction to Lead End-Use with 47% Share in 2025 and Continued Expansion

The residential segment is projected to contribute nearly 47% of fiber cement demand in 2025, With CAGR 4.4% led by strong single-family housing construction and increasing renovation spending. Rapid urbanization, rising disaster resilience standards, and a growing middle-class demographic in countries like India, Indonesia, and Brazil are fueling demand for affordable, long-lasting construction materials.

In developed markets, such as the USA and Europe, consumers are choosing fiber cement products for their energy efficiency, aesthetic appeal, and low lifecycle costs. Builders and developers are also integrating these products to meet evolving energy codes and green building certifications such as LEED and BREEAM. The segment is forecast to grow steadily at a CAGR of 5.5% over the forecast period, supported by government-backed affordable housing initiatives and eco-housing policies.
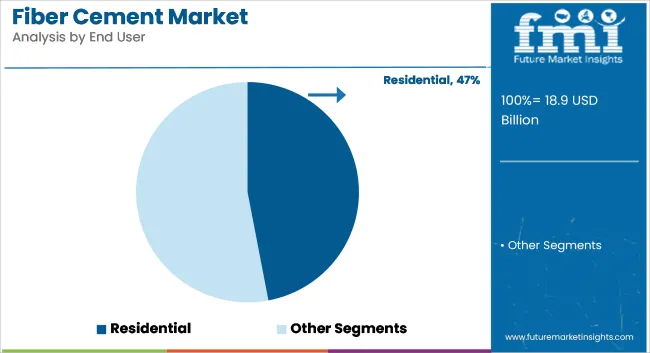
Fiber Cement Market Analysis By End User

Country-wise Analysis

United States

The USA industry is undergoing massive growth in light of escalating demand for hardy, low-maintenance, and fire-resistance building materials. In consideration of greater focus on sustainability and energy efficiency when it comes to building construction, the product is picking up the pace of utilization in both domestic and commercial buildings.

It can resist weathering, is non-flammable, and the material has appearance flexibility. This allows it to stand out as an optimum solution for cladding, roofing, and siding systems all over the country. FMI is of the opinion that the USA fiber cement market is slated to grow at 4.9% CAGR during the study period.

The urban and suburban building boom, which is being driven by increased investments in infrastructure and housing developments, is propelling the market. Further, the trend toward environmentally friendly, or green buildings, and LEED-certified buildings is driving the adoption of sustainable and recyclable building materials such as fiber cement. Also, investment by the USA government in infrastructure renewal and disaster-resistant housing systems is aiding the growth of the market.

The adoption of the product in the renovation and remodelling sector is another key driver, as homeowners look for long-lasting, moisture-resistant, and termite-proof materials for home improvement projects. Furthermore, stringent fire safety regulations-especially in wildfire-prone states like California-are encouraging the use of fire-resistant fiber cement siding and panels.

Country CAGR (2025 to 2035)
USA 4.9%

UK

The UK market is growing as urban expansion, green construction trends, and tough building standards propel demand for energy-efficient, fire-resistant, and long-lasting building materials. As housing needs and retrofit projects grow, the product will be used more for roof covering, siding, and facades. FMI is of the opinion that the UK market is slated to grow at 4.2% CAGR during the study period.

Post-Grenfell Tower fire regulations have brought a considerable change in the direction of non-combustible materials, such as fiber cement panels and cladding systems. Building safety standards of the UK (BS 8414 and BS EN 12467) promote the use of fire-resistant materials, thus the product has emerged as a desirable alternative to plastic and wood-based combustible panels.

The nation is emphasizing Net Zero 2050 carbon emissions targets. This increases the use of environmentally friendly and recyclable building materials. The growing emphasis on sustainable, durable building materials in social housing and public infrastructure is also boosting product demand.

Country CAGR (2025 to 2035)
UK 4.2%

Japan

Japan is growing due to urban expansion, seismic-resistant construction practices, and the government’s focus on sustainable building materials. The country’s high earthquake frequency requires impact-resistant and durable construction solutions, making the product a popular choice in exterior cladding, partition boards, and structural applications. FMI is of the opinion that the Japanese market is slated to grow at 4.3% CAGR during the study period.

Japan's prefabricated and modular housing boom is driving demand for lightweight, easy-to-install fiber cement boards. The government’s Smart City initiatives are further promoting green and energy-efficient building materials like fiber cement.

Country CAGR (2025 to 2035)
Japan 4.3%

South Korea

The South Korean market is expanding fast with massive government investment in urban infrastructure, growth in smart city projects, and rising use of environmentally friendly building materials. With the rapid urbanization of the country and high population density, demand for long-lasting, fire-resistant, and low-maintenance materials in residential, commercial, and industrial applications is on the rise. FMI is of the opinion that the South Korean market is slated to grow at 4.5% CAGR during the study period.

The government of South Korea has adopted policies that favor sustainable building through the use of non-toxic, recyclable, and energy-efficient materials such as fiber cement. The nation's Green Building Act and Smart City policy aim at minimizing carbon footprints within the construction industry, thus positioning the product as a material of choice because it has low environmental footprints, a long service life, and is recyclable.

Country CAGR (2025 to 2035)
South Korea 4.5%

Competition Outlook

The fiber cement market is growing increasingly competitive, with major players investing in product innovation, capacity expansion, and regional penetration. Companies are focusing on vertical integration to streamline raw material sourcing and ensure consistency in quality and cost structure. Advanced manufacturing processes like autoclaving, hybrid curing, and lightweight formulations are being developed to increase energy efficiency and reduce environmental footprint.

Leading firms are offering a wide range of product formats-boards, panels, sheets, and siding products-tailored to local climates and construction needs. Product differentiation is also expanding through digitally printed textures, anti-fungal coatings, and impact-resistant panels. North American and European companies are entering strategic alliances and joint ventures in Asia and Latin America to tap into fast-growing construction markets.

Sustainability remains central to the competitive strategy, with players integrating recyclable materials and improving end-of-life recovery rates. As performance expectations grow and regulatory standards become more stringent, innovation, cost competitiveness, and localization of production are shaping the next phase of market growth.

Recent Developments
  • In February 2025, James Hardie was reported to have unveiled a new and expanded range of Hardie® fiber cement products at the 2025 International Builders’ Show. The updated product lineup included innovations in siding and panel systems, developed to enhance fire resistance, durability, and design flexibility for residential and multifamily construction.
  • March 6, 2025, American Fiber Cement (AFC) expanded its product portfolio by launching seven new Swisspearl cladding solutions and a new line of AFC-branded panels. These include innovative finishes like Carbon+, Sky, and Lines+, designed for modern architecture with enhanced durability, aesthetics, and weather resistance. The move strengthens AFC’s position in the North American market for sustainable and high-performance building materials
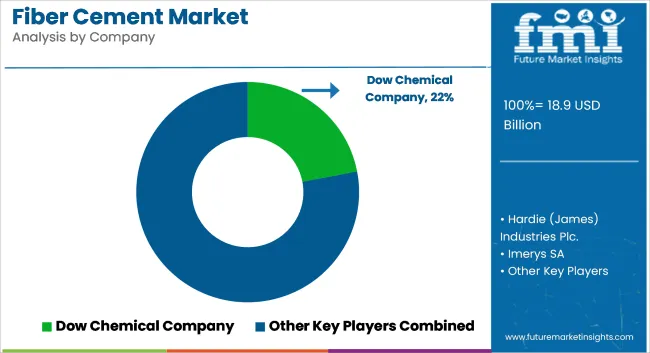
Fiber Cement Market Analysis By Company

Key Players

  • James Hardie Industries plc
  • Elementia SA de CV
  • Building Materials Corporation of America (now GAF/Standard Industries)
  • CEMVIN
  • Secolite (Placacem Lda)
  • Cembrit (under swisspearl group)
  • James Hardie Europe GmbH
  • CHEM TECH Korea Co., Ltd.
  • Nichiha Corporation
  • Konoshima Chemical Co., Ltd.
  • SHERA

Key Segmentation

By Raw Materials:

By raw materials, the segmentation is as silica, Portland cement, cellulosic fiber, and others.

By End User:

By end user, the segmentation is as residential and non-residential.

By Application:

By application, the segmentation is as cladding, siding, backer boards, molding and trimming, roofing, wall partitions, and others.

By Region:

By region, the segmentation is as North America, Latin America, Europe, Asia Pacific, and the Middle East & Africa.

Table of Content

  1. Executive Summary
  2. Market Overview
  3. Market Background
  4. Global Market Analysis 2020 to 2024 and Forecast, 2025 to 2035
  5. Global Market Analysis 2020 to 2024 and Forecast 2025 to 2035, By Raw Materials
    • Silica
    • Portland Cement
    • Cellulosic Fiber
    • Others
  6. Global Market Analysis 2020 to 2024 and Forecast 2025 to 2035, By End User
    • Residential
    • Non-Residential
  7. Global Market Analysis 2020 to 2024 and Forecast 2025 to 2035, By Application
    • Cladding
    • Siding
    • Backer Boards
    • Molding and Trimming
    • Roofing
    • Wall Partitions
    • Others
  8. Global Market Analysis 2020 to 2024 and Forecast 2025 to 2035, By Region
    • North America
    • Latin America
    • Western Europe
    • Eastern Europe
    • South Asia and Pacific
    • East Asia
    • Middle East and Africa
  9. North America Market Analysis 2020 to 2024 and Forecast 2025 to 2035, By Country
  10. Latin America Market Analysis 2020 to 2024 and Forecast 2025 to 2035, By Country
  11. Western Europe Market Analysis 2020 to 2024 and Forecast 2025 to 2035, By Country
  12. Eastern Europe Market Analysis 2020 to 2024 and Forecast 2025 to 2035, By Country
  13. South Asia and Pacific Market Analysis 2020 to 2024 and Forecast 2025 to 2035, By Country
  14. East Asia Market Analysis 2020 to 2024 and Forecast 2025 to 2035, By Country
  15. Middle East and Africa Market Analysis 2020 to 2024 and Forecast 2025 to 2035, By Country
  16. Key Countries Market Analysis
  17. Market Structure Analysis
  18. Competition Analysis
    • Dow Chemical Company
    • Hardie (James) Industries Plc.
    • Imerys SA
    • Elementia SA de CV
    • Building Materials Corporation of America
    • PPG Industries Incorporated
    • Akzo Nobel NV
    • Canfor Corporation
    • Ecolab Incorporated
    • Central Fiber LLC
    • Mercer International Incorporated
    • US Silica Holdings Incorporated
  19. Assumptions & Acronyms Used
  20. Research Methodology

List of Tables

  • Table 1: Global Market Value (USD Million) Forecast by Region, 2020 to 2035
  • Table 2: Global Market Volume (Tons) Forecast by Region, 2020 to 2035
  • Table 3: Global Market Value (USD Million) Forecast by Raw Materials, 2020 to 2035
  • Table 4: Global Market Volume (Tons) Forecast by Raw Materials, 2020 to 2035
  • Table 5: Global Market Value (USD Million) Forecast by End User, 2020 to 2035
  • Table 6: Global Market Volume (Tons) Forecast by End User, 2020 to 2035
  • Table 7: Global Market Value (USD Million) Forecast by Application, 2020 to 2035
  • Table 8: Global Market Volume (Tons) Forecast by Application, 2020 to 2035
  • Table 9: North America Market Value (USD Million) Forecast by Country, 2020 to 2035
  • Table 10: North America Market Volume (Tons) Forecast by Country, 2020 to 2035
  • Table 11: North America Market Value (USD Million) Forecast by Raw Materials, 2020 to 2035
  • Table 12: North America Market Volume (Tons) Forecast by Raw Materials, 2020 to 2035
  • Table 13: North America Market Value (USD Million) Forecast by End User, 2020 to 2035
  • Table 14: North America Market Volume (Tons) Forecast by End User, 2020 to 2035
  • Table 15: North America Market Value (USD Million) Forecast by Application, 2020 to 2035
  • Table 16: North America Market Volume (Tons) Forecast by Application, 2020 to 2035
  • Table 17: Latin America Market Value (USD Million) Forecast by Country, 2020 to 2035
  • Table 18: Latin America Market Volume (Tons) Forecast by Country, 2020 to 2035
  • Table 19: Latin America Market Value (USD Million) Forecast by Raw Materials, 2020 to 2035
  • Table 20: Latin America Market Volume (Tons) Forecast by Raw Materials, 2020 to 2035
  • Table 21: Latin America Market Value (USD Million) Forecast by End User, 2020 to 2035
  • Table 22: Latin America Market Volume (Tons) Forecast by End User, 2020 to 2035
  • Table 23: Latin America Market Value (USD Million) Forecast by Application, 2020 to 2035
  • Table 24: Latin America Market Volume (Tons) Forecast by Application, 2020 to 2035
  • Table 25: Western Europe Market Value (USD Million) Forecast by Country, 2020 to 2035
  • Table 26: Western Europe Market Volume (Tons) Forecast by Country, 2020 to 2035
  • Table 27: Western Europe Market Value (USD Million) Forecast by Raw Materials, 2020 to 2035
  • Table 28: Western Europe Market Volume (Tons) Forecast by Raw Materials, 2020 to 2035
  • Table 29: Western Europe Market Value (USD Million) Forecast by End User, 2020 to 2035
  • Table 30: Western Europe Market Volume (Tons) Forecast by End User, 2020 to 2035
  • Table 31: Western Europe Market Value (USD Million) Forecast by Application, 2020 to 2035
  • Table 32: Western Europe Market Volume (Tons) Forecast by Application, 2020 to 2035
  • Table 33: Eastern Europe Market Value (USD Million) Forecast by Country, 2020 to 2035
  • Table 34: Eastern Europe Market Volume (Tons) Forecast by Country, 2020 to 2035
  • Table 35: Eastern Europe Market Value (USD Million) Forecast by Raw Materials, 2020 to 2035
  • Table 36: Eastern Europe Market Volume (Tons) Forecast by Raw Materials, 2020 to 2035
  • Table 37: Eastern Europe Market Value (USD Million) Forecast by End User, 2020 to 2035
  • Table 38: Eastern Europe Market Volume (Tons) Forecast by End User, 2020 to 2035
  • Table 39: Eastern Europe Market Value (USD Million) Forecast by Application, 2020 to 2035
  • Table 40: Eastern Europe Market Volume (Tons) Forecast by Application, 2020 to 2035
  • Table 41: South Asia and Pacific Market Value (USD Million) Forecast by Country, 2020 to 2035
  • Table 42: South Asia and Pacific Market Volume (Tons) Forecast by Country, 2020 to 2035
  • Table 43: South Asia and Pacific Market Value (USD Million) Forecast by Raw Materials, 2020 to 2035
  • Table 44: South Asia and Pacific Market Volume (Tons) Forecast by Raw Materials, 2020 to 2035
  • Table 45: South Asia and Pacific Market Value (USD Million) Forecast by End User, 2020 to 2035
  • Table 46: South Asia and Pacific Market Volume (Tons) Forecast by End User, 2020 to 2035
  • Table 47: South Asia and Pacific Market Value (USD Million) Forecast by Application, 2020 to 2035
  • Table 48: South Asia and Pacific Market Volume (Tons) Forecast by Application, 2020 to 2035
  • Table 49: East Asia Market Value (USD Million) Forecast by Country, 2020 to 2035
  • Table 50: East Asia Market Volume (Tons) Forecast by Country, 2020 to 2035
  • Table 51: East Asia Market Value (USD Million) Forecast by Raw Materials, 2020 to 2035
  • Table 52: East Asia Market Volume (Tons) Forecast by Raw Materials, 2020 to 2035
  • Table 53: East Asia Market Value (USD Million) Forecast by End User, 2020 to 2035
  • Table 54: East Asia Market Volume (Tons) Forecast by End User, 2020 to 2035
  • Table 55: East Asia Market Value (USD Million) Forecast by Application, 2020 to 2035
  • Table 56: East Asia Market Volume (Tons) Forecast by Application, 2020 to 2035
  • Table 57: Middle East and Africa Market Value (USD Million) Forecast by Country, 2020 to 2035
  • Table 58: Middle East and Africa Market Volume (Tons) Forecast by Country, 2020 to 2035
  • Table 59: Middle East and Africa Market Value (USD Million) Forecast by Raw Materials, 2020 to 2035
  • Table 60: Middle East and Africa Market Volume (Tons) Forecast by Raw Materials, 2020 to 2035
  • Table 61: Middle East and Africa Market Value (USD Million) Forecast by End User, 2020 to 2035
  • Table 62: Middle East and Africa Market Volume (Tons) Forecast by End User, 2020 to 2035
  • Table 63: Middle East and Africa Market Value (USD Million) Forecast by Application, 2020 to 2035
  • Table 64: Middle East and Africa Market Volume (Tons) Forecast by Application, 2020 to 2035

List of Figures

  • Figure 1: Global Market Value (USD Million) by Raw Materials, 2025 to 2035
  • Figure 2: Global Market Value (USD Million) by End User, 2025 to 2035
  • Figure 3: Global Market Value (USD Million) by Application, 2025 to 2035
  • Figure 4: Global Market Value (USD Million) by Region, 2025 to 2035
  • Figure 5: Global Market Value (USD Million) Analysis by Region, 2020 to 2035
  • Figure 6: Global Market Volume (Tons) Analysis by Region, 2020 to 2035
  • Figure 7: Global Market Value Share (%) and BPS Analysis by Region, 2025 to 2035
  • Figure 8: Global Market Y-o-Y Growth (%) Projections by Region, 2025 to 2035
  • Figure 9: Global Market Value (USD Million) Analysis by Raw Materials, 2020 to 2035
  • Figure 10: Global Market Volume (Tons) Analysis by Raw Materials, 2020 to 2035
  • Figure 11: Global Market Value Share (%) and BPS Analysis by Raw Materials, 2025 to 2035
  • Figure 12: Global Market Y-o-Y Growth (%) Projections by Raw Materials, 2025 to 2035
  • Figure 13: Global Market Value (USD Million) Analysis by End User, 2020 to 2035
  • Figure 14: Global Market Volume (Tons) Analysis by End User, 2020 to 2035
  • Figure 15: Global Market Value Share (%) and BPS Analysis by End User, 2025 to 2035
  • Figure 16: Global Market Y-o-Y Growth (%) Projections by End User, 2025 to 2035
  • Figure 17: Global Market Value (USD Million) Analysis by Application, 2020 to 2035
  • Figure 18: Global Market Volume (Tons) Analysis by Application, 2020 to 2035
  • Figure 19: Global Market Value Share (%) and BPS Analysis by Application, 2025 to 2035
  • Figure 20: Global Market Y-o-Y Growth (%) Projections by Application, 2025 to 2035
  • Figure 21: Global Market Attractiveness by Raw Materials, 2025 to 2035
  • Figure 22: Global Market Attractiveness by End User, 2025 to 2035
  • Figure 23: Global Market Attractiveness by Application, 2025 to 2035
  • Figure 24: Global Market Attractiveness by Region, 2025 to 2035
  • Figure 25: North America Market Value (USD Million) by Raw Materials, 2025 to 2035
  • Figure 26: North America Market Value (USD Million) by End User, 2025 to 2035
  • Figure 27: North America Market Value (USD Million) by Application, 2025 to 2035
  • Figure 28: North America Market Value (USD Million) by Country, 2025 to 2035
  • Figure 29: North America Market Value (USD Million) Analysis by Country, 2020 to 2035
  • Figure 30: North America Market Volume (Tons) Analysis by Country, 2020 to 2035
  • Figure 31: North America Market Value Share (%) and BPS Analysis by Country, 2025 to 2035
  • Figure 32: North America Market Y-o-Y Growth (%) Projections by Country, 2025 to 2035
  • Figure 33: North America Market Value (USD Million) Analysis by Raw Materials, 2020 to 2035
  • Figure 34: North America Market Volume (Tons) Analysis by Raw Materials, 2020 to 2035
  • Figure 35: North America Market Value Share (%) and BPS Analysis by Raw Materials, 2025 to 2035
  • Figure 36: North America Market Y-o-Y Growth (%) Projections by Raw Materials, 2025 to 2035
  • Figure 37: North America Market Value (USD Million) Analysis by End User, 2020 to 2035
  • Figure 38: North America Market Volume (Tons) Analysis by End User, 2020 to 2035
  • Figure 39: North America Market Value Share (%) and BPS Analysis by End User, 2025 to 2035
  • Figure 40: North America Market Y-o-Y Growth (%) Projections by End User, 2025 to 2035
  • Figure 41: North America Market Value (USD Million) Analysis by Application, 2020 to 2035
  • Figure 42: North America Market Volume (Tons) Analysis by Application, 2020 to 2035
  • Figure 43: North America Market Value Share (%) and BPS Analysis by Application, 2025 to 2035
  • Figure 44: North America Market Y-o-Y Growth (%) Projections by Application, 2025 to 2035
  • Figure 45: North America Market Attractiveness by Raw Materials, 2025 to 2035
  • Figure 46: North America Market Attractiveness by End User, 2025 to 2035
  • Figure 47: North America Market Attractiveness by Application, 2025 to 2035
  • Figure 48: North America Market Attractiveness by Country, 2025 to 2035
  • Figure 49: Latin America Market Value (USD Million) by Raw Materials, 2025 to 2035
  • Figure 50: Latin America Market Value (USD Million) by End User, 2025 to 2035
  • Figure 51: Latin America Market Value (USD Million) by Application, 2025 to 2035
  • Figure 52: Latin America Market Value (USD Million) by Country, 2025 to 2035
  • Figure 53: Latin America Market Value (USD Million) Analysis by Country, 2020 to 2035
  • Figure 54: Latin America Market Volume (Tons) Analysis by Country, 2020 to 2035
  • Figure 55: Latin America Market Value Share (%) and BPS Analysis by Country, 2025 to 2035
  • Figure 56: Latin America Market Y-o-Y Growth (%) Projections by Country, 2025 to 2035
  • Figure 57: Latin America Market Value (USD Million) Analysis by Raw Materials, 2020 to 2035
  • Figure 58: Latin America Market Volume (Tons) Analysis by Raw Materials, 2020 to 2035
  • Figure 59: Latin America Market Value Share (%) and BPS Analysis by Raw Materials, 2025 to 2035
  • Figure 60: Latin America Market Y-o-Y Growth (%) Projections by Raw Materials, 2025 to 2035
  • Figure 61: Latin America Market Value (USD Million) Analysis by End User, 2020 to 2035
  • Figure 62: Latin America Market Volume (Tons) Analysis by End User, 2020 to 2035
  • Figure 63: Latin America Market Value Share (%) and BPS Analysis by End User, 2025 to 2035
  • Figure 64: Latin America Market Y-o-Y Growth (%) Projections by End User, 2025 to 2035
  • Figure 65: Latin America Market Value (USD Million) Analysis by Application, 2020 to 2035
  • Figure 66: Latin America Market Volume (Tons) Analysis by Application, 2020 to 2035
  • Figure 67: Latin America Market Value Share (%) and BPS Analysis by Application, 2025 to 2035
  • Figure 68: Latin America Market Y-o-Y Growth (%) Projections by Application, 2025 to 2035
  • Figure 69: Latin America Market Attractiveness by Raw Materials, 2025 to 2035
  • Figure 70: Latin America Market Attractiveness by End User, 2025 to 2035
  • Figure 71: Latin America Market Attractiveness by Application, 2025 to 2035
  • Figure 72: Latin America Market Attractiveness by Country, 2025 to 2035
  • Figure 73: Western Europe Market Value (USD Million) by Raw Materials, 2025 to 2035
  • Figure 74: Western Europe Market Value (USD Million) by End User, 2025 to 2035
  • Figure 75: Western Europe Market Value (USD Million) by Application, 2025 to 2035
  • Figure 76: Western Europe Market Value (USD Million) by Country, 2025 to 2035
  • Figure 77: Western Europe Market Value (USD Million) Analysis by Country, 2020 to 2035
  • Figure 78: Western Europe Market Volume (Tons) Analysis by Country, 2020 to 2035
  • Figure 79: Western Europe Market Value Share (%) and BPS Analysis by Country, 2025 to 2035
  • Figure 80: Western Europe Market Y-o-Y Growth (%) Projections by Country, 2025 to 2035
  • Figure 81: Western Europe Market Value (USD Million) Analysis by Raw Materials, 2020 to 2035
  • Figure 82: Western Europe Market Volume (Tons) Analysis by Raw Materials, 2020 to 2035
  • Figure 83: Western Europe Market Value Share (%) and BPS Analysis by Raw Materials, 2025 to 2035
  • Figure 84: Western Europe Market Y-o-Y Growth (%) Projections by Raw Materials, 2025 to 2035
  • Figure 85: Western Europe Market Value (USD Million) Analysis by End User, 2020 to 2035
  • Figure 86: Western Europe Market Volume (Tons) Analysis by End User, 2020 to 2035
  • Figure 87: Western Europe Market Value Share (%) and BPS Analysis by End User, 2025 to 2035
  • Figure 88: Western Europe Market Y-o-Y Growth (%) Projections by End User, 2025 to 2035
  • Figure 89: Western Europe Market Value (USD Million) Analysis by Application, 2020 to 2035
  • Figure 90: Western Europe Market Volume (Tons) Analysis by Application, 2020 to 2035
  • Figure 91: Western Europe Market Value Share (%) and BPS Analysis by Application, 2025 to 2035
  • Figure 92: Western Europe Market Y-o-Y Growth (%) Projections by Application, 2025 to 2035
  • Figure 93: Western Europe Market Attractiveness by Raw Materials, 2025 to 2035
  • Figure 94: Western Europe Market Attractiveness by End User, 2025 to 2035
  • Figure 95: Western Europe Market Attractiveness by Application, 2025 to 2035
  • Figure 96: Western Europe Market Attractiveness by Country, 2025 to 2035
  • Figure 97: Eastern Europe Market Value (USD Million) by Raw Materials, 2025 to 2035
  • Figure 98: Eastern Europe Market Value (USD Million) by End User, 2025 to 2035
  • Figure 99: Eastern Europe Market Value (USD Million) by Application, 2025 to 2035
  • Figure 100: Eastern Europe Market Value (USD Million) by Country, 2025 to 2035
  • Figure 101: Eastern Europe Market Value (USD Million) Analysis by Country, 2020 to 2035
  • Figure 102: Eastern Europe Market Volume (Tons) Analysis by Country, 2020 to 2035
  • Figure 103: Eastern Europe Market Value Share (%) and BPS Analysis by Country, 2025 to 2035
  • Figure 104: Eastern Europe Market Y-o-Y Growth (%) Projections by Country, 2025 to 2035
  • Figure 105: Eastern Europe Market Value (USD Million) Analysis by Raw Materials, 2020 to 2035
  • Figure 106: Eastern Europe Market Volume (Tons) Analysis by Raw Materials, 2020 to 2035
  • Figure 107: Eastern Europe Market Value Share (%) and BPS Analysis by Raw Materials, 2025 to 2035
  • Figure 108: Eastern Europe Market Y-o-Y Growth (%) Projections by Raw Materials, 2025 to 2035
  • Figure 109: Eastern Europe Market Value (USD Million) Analysis by End User, 2020 to 2035
  • Figure 110: Eastern Europe Market Volume (Tons) Analysis by End User, 2020 to 2035
  • Figure 111: Eastern Europe Market Value Share (%) and BPS Analysis by End User, 2025 to 2035
  • Figure 112: Eastern Europe Market Y-o-Y Growth (%) Projections by End User, 2025 to 2035
  • Figure 113: Eastern Europe Market Value (USD Million) Analysis by Application, 2020 to 2035
  • Figure 114: Eastern Europe Market Volume (Tons) Analysis by Application, 2020 to 2035
  • Figure 115: Eastern Europe Market Value Share (%) and BPS Analysis by Application, 2025 to 2035
  • Figure 116: Eastern Europe Market Y-o-Y Growth (%) Projections by Application, 2025 to 2035
  • Figure 117: Eastern Europe Market Attractiveness by Raw Materials, 2025 to 2035
  • Figure 118: Eastern Europe Market Attractiveness by End User, 2025 to 2035
  • Figure 119: Eastern Europe Market Attractiveness by Application, 2025 to 2035
  • Figure 120: Eastern Europe Market Attractiveness by Country, 2025 to 2035
  • Figure 121: South Asia and Pacific Market Value (USD Million) by Raw Materials, 2025 to 2035
  • Figure 122: South Asia and Pacific Market Value (USD Million) by End User, 2025 to 2035
  • Figure 123: South Asia and Pacific Market Value (USD Million) by Application, 2025 to 2035
  • Figure 124: South Asia and Pacific Market Value (USD Million) by Country, 2025 to 2035
  • Figure 125: South Asia and Pacific Market Value (USD Million) Analysis by Country, 2020 to 2035
  • Figure 126: South Asia and Pacific Market Volume (Tons) Analysis by Country, 2020 to 2035
  • Figure 127: South Asia and Pacific Market Value Share (%) and BPS Analysis by Country, 2025 to 2035
  • Figure 128: South Asia and Pacific Market Y-o-Y Growth (%) Projections by Country, 2025 to 2035
  • Figure 129: South Asia and Pacific Market Value (USD Million) Analysis by Raw Materials, 2020 to 2035
  • Figure 130: South Asia and Pacific Market Volume (Tons) Analysis by Raw Materials, 2020 to 2035
  • Figure 131: South Asia and Pacific Market Value Share (%) and BPS Analysis by Raw Materials, 2025 to 2035
  • Figure 132: South Asia and Pacific Market Y-o-Y Growth (%) Projections by Raw Materials, 2025 to 2035
  • Figure 133: South Asia and Pacific Market Value (USD Million) Analysis by End User, 2020 to 2035
  • Figure 134: South Asia and Pacific Market Volume (Tons) Analysis by End User, 2020 to 2035
  • Figure 135: South Asia and Pacific Market Value Share (%) and BPS Analysis by End User, 2025 to 2035
  • Figure 136: South Asia and Pacific Market Y-o-Y Growth (%) Projections by End User, 2025 to 2035
  • Figure 137: South Asia and Pacific Market Value (USD Million) Analysis by Application, 2020 to 2035
  • Figure 138: South Asia and Pacific Market Volume (Tons) Analysis by Application, 2020 to 2035
  • Figure 139: South Asia and Pacific Market Value Share (%) and BPS Analysis by Application, 2025 to 2035
  • Figure 140: South Asia and Pacific Market Y-o-Y Growth (%) Projections by Application, 2025 to 2035
  • Figure 141: South Asia and Pacific Market Attractiveness by Raw Materials, 2025 to 2035
  • Figure 142: South Asia and Pacific Market Attractiveness by End User, 2025 to 2035
  • Figure 143: South Asia and Pacific Market Attractiveness by Application, 2025 to 2035
  • Figure 144: South Asia and Pacific Market Attractiveness by Country, 2025 to 2035
  • Figure 145: East Asia Market Value (USD Million) by Raw Materials, 2025 to 2035
  • Figure 146: East Asia Market Value (USD Million) by End User, 2025 to 2035
  • Figure 147: East Asia Market Value (USD Million) by Application, 2025 to 2035
  • Figure 148: East Asia Market Value (USD Million) by Country, 2025 to 2035
  • Figure 149: East Asia Market Value (USD Million) Analysis by Country, 2020 to 2035
  • Figure 150: East Asia Market Volume (Tons) Analysis by Country, 2020 to 2035
  • Figure 151: East Asia Market Value Share (%) and BPS Analysis by Country, 2025 to 2035
  • Figure 152: East Asia Market Y-o-Y Growth (%) Projections by Country, 2025 to 2035
  • Figure 153: East Asia Market Value (USD Million) Analysis by Raw Materials, 2020 to 2035
  • Figure 154: East Asia Market Volume (Tons) Analysis by Raw Materials, 2020 to 2035
  • Figure 155: East Asia Market Value Share (%) and BPS Analysis by Raw Materials, 2025 to 2035
  • Figure 156: East Asia Market Y-o-Y Growth (%) Projections by Raw Materials, 2025 to 2035
  • Figure 157: East Asia Market Value (USD Million) Analysis by End User, 2020 to 2035
  • Figure 158: East Asia Market Volume (Tons) Analysis by End User, 2020 to 2035
  • Figure 159: East Asia Market Value Share (%) and BPS Analysis by End User, 2025 to 2035
  • Figure 160: East Asia Market Y-o-Y Growth (%) Projections by End User, 2025 to 2035
  • Figure 161: East Asia Market Value (USD Million) Analysis by Application, 2020 to 2035
  • Figure 162: East Asia Market Volume (Tons) Analysis by Application, 2020 to 2035
  • Figure 163: East Asia Market Value Share (%) and BPS Analysis by Application, 2025 to 2035
  • Figure 164: East Asia Market Y-o-Y Growth (%) Projections by Application, 2025 to 2035
  • Figure 165: East Asia Market Attractiveness by Raw Materials, 2025 to 2035
  • Figure 166: East Asia Market Attractiveness by End User, 2025 to 2035
  • Figure 167: East Asia Market Attractiveness by Application, 2025 to 2035
  • Figure 168: East Asia Market Attractiveness by Country, 2025 to 2035
  • Figure 169: Middle East and Africa Market Value (USD Million) by Raw Materials, 2025 to 2035
  • Figure 170: Middle East and Africa Market Value (USD Million) by End User, 2025 to 2035
  • Figure 171: Middle East and Africa Market Value (USD Million) by Application, 2025 to 2035
  • Figure 172: Middle East and Africa Market Value (USD Million) by Country, 2025 to 2035
  • Figure 173: Middle East and Africa Market Value (USD Million) Analysis by Country, 2020 to 2035
  • Figure 174: Middle East and Africa Market Volume (Tons) Analysis by Country, 2020 to 2035
  • Figure 175: Middle East and Africa Market Value Share (%) and BPS Analysis by Country, 2025 to 2035
  • Figure 176: Middle East and Africa Market Y-o-Y Growth (%) Projections by Country, 2025 to 2035
  • Figure 177: Middle East and Africa Market Value (USD Million) Analysis by Raw Materials, 2020 to 2035
  • Figure 178: Middle East and Africa Market Volume (Tons) Analysis by Raw Materials, 2020 to 2035
  • Figure 179: Middle East and Africa Market Value Share (%) and BPS Analysis by Raw Materials, 2025 to 2035
  • Figure 180: Middle East and Africa Market Y-o-Y Growth (%) Projections by Raw Materials, 2025 to 2035
  • Figure 181: Middle East and Africa Market Value (USD Million) Analysis by End User, 2020 to 2035
  • Figure 182: Middle East and Africa Market Volume (Tons) Analysis by End User, 2020 to 2035
  • Figure 183: Middle East and Africa Market Value Share (%) and BPS Analysis by End User, 2025 to 2035
  • Figure 184: Middle East and Africa Market Y-o-Y Growth (%) Projections by End User, 2025 to 2035
  • Figure 185: Middle East and Africa Market Value (USD Million) Analysis by Application, 2020 to 2035
  • Figure 186: Middle East and Africa Market Volume (Tons) Analysis by Application, 2020 to 2035
  • Figure 187: Middle East and Africa Market Value Share (%) and BPS Analysis by Application, 2025 to 2035
  • Figure 188: Middle East and Africa Market Y-o-Y Growth (%) Projections by Application, 2025 to 2035
  • Figure 189: Middle East and Africa Market Attractiveness by Raw Materials, 2025 to 2035
  • Figure 190: Middle East and Africa Market Attractiveness by End User, 2025 to 2035
  • Figure 191: Middle East and Africa Market Attractiveness by Application, 2025 to 2035
  • Figure 192: Middle East and Africa Market Attractiveness by Country, 2025 to 2035

Frequently Asked Questions

What will be the overall fiber cement market worth in 2025?

The overall market size is slated to reach USD 18.9 billion in 2025.

What will be the overall fiber cement market worth in 2035?

The fiber cement market is expected to reach USD 30.8 billion in 2035.

Who are the major fiber cement companies?

The prominent companies include Allura USA, Everest Industries Limited, Hume Cemboard Industries, SCG Building Materials, Toray Industries Inc., Mahaphant Fibre Cement Co., Ltd., CertainTeed (Saint-Gobain), CSR Limited, and Elementia Materiales.

Which raw material is widely used for fiber cement?

Silica is a widely used raw material.

Explore Similar Insights

Future Market Insights

Fiber Cement Market