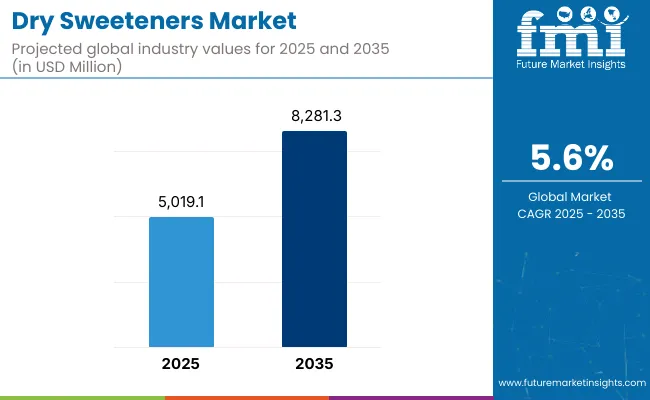
The international Dry Sweeteners Market seeks to reach USD 5019.1 million by 2025 while projecting USD 8281.3 million value in 2035 through a 5.6% yearly growth rate between 2025 2035.

| Attributes | Description |
|---|---|
| Estimated Global Industry Size (2025E) | USD 5019.1 Million |
| Projected Global Industry Value (2035F) | USD 8281.3 Million |
| Value-based CAGR (2025 to 2035) | 5.6% |
Dry sweeteners continue to experience rapid market changes because customers favor more nutritious alternative sweeteners compared to traditional sugar. The expansion of diabetes and obesity cases drives consumer demand for sweeteners which taste similar to sugar but contain fewer calories while delivering reduced glycemic responses.
Dry sweeteners such as stevia, monk fruit, and erythritol are reclaiming market favor due to their health potential as well as technological success in baking foods and beverages. The market continues to grow because technological advances combine with public understanding of dangerous outcomes from too much sugar consumption.
Businesses consistently develop natural and organic options among their product lines in response to rising clean-label product demand. The market experiences expansion because expanding e-commerce platforms grant consumers better access to diverse dry sweetener products.
Each segment within the industry uses different benefits to serve different consumer requirements between product types and forms and their respective applications. Market dynamics become defined by pricing sensitivities together with consumer preference patterns as well as ongoing regulatory rules.
The dry sweeteners market sees increasing use of these ingredients across processed food applications as well as in beverages and pharmaceutical products. Consumers who want nutritious alternatives that maintain flavor are expected to drive increased demand for advanced sweetening options.
The dry sweetener market encounters problems related to changing plant material prices as well as differences in consumer understanding of these products. The dry sweeteners sector is expected to experience continuous growth because health-conscious consumers will continue to choose natural options backed by continuous product improvements
Growth of the nutraceutical and dietary supplement sector using dry sweeteners
Over the past few years the utilization of dry sweeteners in nutraceutical and dietary supplement manufacturing has experienced substantial growth. The popularity of naturally derived dry sweeteners including stevia and monk fruit and erythritol rises because these zero-calorie sweeteners match the needs of health-focused consumers.
Substantial market expansion results from consumer demand for healthier substitute sugars that replaces traditional sugar.
The nutraceutical industry uses dry sweeteners for two essential purposes which include their sweetening characteristics along with their health-giving features. Experiments show stevia possesses anti-inflammatory and antioxidant effects thereby improving nutritional supplements' overall quality.
The adoption of these sweeteners connects to current consumer interest in product categories that both satisfy nutritional requirements and deliver further health benefits.
Personalized nutrition has propelled this industry growth at a rapid pace. Many consumers now seek supplements which meet their unique dietary requirements as they gain better understanding about their individual health needs. Customized products receive dry sweeteners well because these ingredients retain taste qualities without sacrificing wellness gains.
Increasing consumer demand for low-calorie sweeteners
The significantly growing market for low-calorie sweeteners persists because consumers place increasing attention on health and wellness. As people gain awareness about dietary choices, they search for sweet alternatives that avoid the health problems created by excessive sugar consumption.
The growing number of obesity and diabetes sufferers and heart disease patients represents one major driving factor behind consumer interest in low-calorie sweeteners. People who want a healthier alternative to sugar-based sweeteners seek low-calorie substitutes because evidence shows that high sugar consumption causes these health conditions.
Manufacturers have responded to consumer demand by introducing stevia along with erythritol and monk fruit sweeteners that derive from natural sources with low blood sugar consequences.
The rise of interest in natural and organic products represents another significant reason behind this consumer trend. Consumer understanding about food ingredients drives them away from artificial sweeteners toward naturally derived sweeteners in their product choices. Food production transparency along with cleaner product labels create a market preference.
Enhanced focus on sustainable and environmentally friendly production methods.
The attention to sustainable and environmentally friendly manufacturing approaches has grown significantly throughout numerous industrial sectors over the past several years. The manufacturing sector has experienced a fundamental change because both environmental sensitivity and worldwide resource preservation goals have become key priorities.
Public concern about climate change and natural resource depletion serves as the chief motivator for this environmental movement. The sustainability revolution forces industries to adopt responsible practices which secure their future operation and safeguard natural environments.
A combination of environmentally friendly technological solutions and processes currently guides industries toward waste reduction efforts together with energy efficiency and pollution reduction practices. Many manufacturing operations integrate solar power and wind energy to decrease their dependence on non-renewable fossil fuel consumption.
Current marketplace requirements stand as a vital determining factor. Modern buyers show increased knowledge and concern about what they buy. Customers tend to buy from brands that practice ethical business methods and pledge to sustainable initiatives.
Sustainable business practices together with Sustainability marketing strategies have become essential competitive differentiators for enterprises because of rising consumer demand. The adoption of eco-labels together with certifications and open environmental impact reporting methods has now become common practice across numerous industries.
Improved packaging solutions for better shelf life and convenience.
Modern manufacturing and industry show a central focus on sustainable environmentally friendly production approaches. Rising environmental issues have caused both businesses and consumers to shift toward sustainability as they make their operational decisions.
The primary force behind this direction are the environmental regulations that business must follow. National governments worldwide enforce tighter environmental rules which make companies redesign their operations to become environmentally friendly.
Organizations must lower their carbon footprint and minimize their waste output in addition to preserving water supplies while choosing renewable energy technologies. Multiple countries established rigorous carbon neutrality targets which now drive companies to implement sustainable technologies as they seek investment opportunities.
The power of customer expectations significantly influences market directions. Modern consumers understand product environmental effects better and make choices with greater environmental awareness. People are choosing products from brands which prioritize sustainability in their operations.
Due to growing consumer awareness about sustainability companies now use products made from recycled components and reduce waste while implementing circular economy models.
During the period 2020 to 2025, the sales grew at a CAGR of 5.6% and it is predicted to continue to grow at a CAGR of 5.1% during the forecast period of 2025-35.
The dry sweeteners market has experienced major evolutionary changes since manufacturers began responding to consumers' demands for health-oriented low-calorie sweet products. From artificial sweeteners such as saccharin and aspartame ruling the market in the mid-20th century the late 1990s brought a substantial change as customers turned to natural choices.
The consumer privacy revolution occurred because consumers educated themselves about synthetic additive risks while simultaneously prioritizing their health more seriously. Consumer interest in natural sweeteners including stevia and monk fruit and erythritol generated market expansion. The market received a major boost thanks to regulatory acceptance across different regions.
The market expanded substantially because of increasing popularity of fat-reducing eating styles that included low-carb and sugar-free diets. The present market depends heavily on mergers and acquisitions and strategic partnerships to create new product lines.
Industry forecasts project that dry sweeteners will sustain consistent market growth at a predicted compound annual growth rate (CAGR) of approximately 6.5% during the following decade. The dry sweetener market will experience consistent expansion due to increasing health-oriented consumer preferences for low-calorie and naturally derived sweetening ingredients.
Various sectors such as food and beverages, pharmaceuticals and personal care utilize dry sweeteners through product development which will drive market expansion in the next decade. Manufacturer innovation through blended sweeteners which merge characteristics from diverse natural ingredients will drive steady demand expansion for these products.
The wide availability of products through e-commerce platforms along with their market expansion capabilities and educational opportunities will drive the growth of these platforms into the future.
Tier 1 : Archer Daniels Midland Company and Cargill Incorporated together with Tate & Lyle control the market through their global leadership position and substantial market shares. The dominant market position which these giants sustain is made possible through their broad distribution systems along with their large-scale advantages and strong scientific and research programs.
Market leaders invest money to create new products together with market expansion strategies that include intentional acquisitions and mergers. These companies sustain industry leadership positions through continuous adherence to market trends along with regulatory demands thus creating benchmark industry practices which in turn propel market expansion
Tier 2 : The market's significant influence belongs to four companies including Ingredion and Tereos Starch & Sweeteners s.a.s. and Daesang Corporation together with Roquette Freres under Tier 2 classification. These companies target particular markets and regions where they deliver specialized product solutions.
These companies use superior quality combined with innovative solutions and loyal customer relationships to defend their market position. The quick nature of their adaptations to market variations together with consumer preference patterns enables these companies to maintain robust market positioning and increasing market capture of precisely defined niche categories
Tier 3 : The market consists of three tiers where Sweeteners Plus alongside Marroquin Organic together with Royal Ingredients Group along with Health Care Products Ltd and Malt Products Corporation and Jimbo's Naturally operate as smaller or emerging businesses featuring local operations that maintain minimal market penetration.
These companies choose to stand out by presenting distinctive goods alongside specialized diet-focused products and novel packaging methods. Their commitment to community involvement together with individualized personal service attracts devoted customers even though their market exists alongside bigger competitors.
Most companies serve as leading forces in market trend creation along with meeting industrial market requirements.

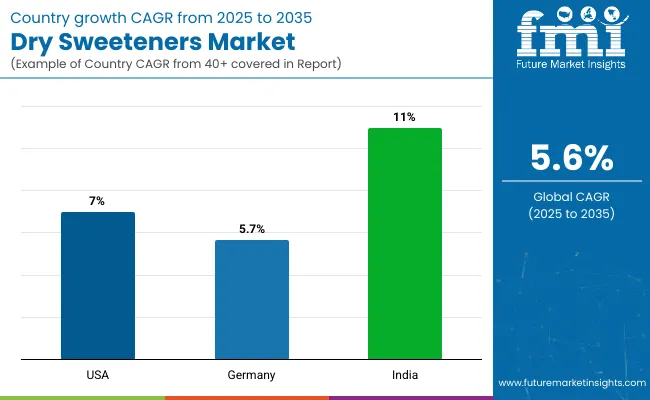
The following table shows the estimated growth rates of the significant three geographies sales. USA and Germany are set to exhibit high consumption, recording CAGRs of 7.6% and 6.2% respectively, through 2035.
| Country | CAGR, 2025 to 2035 |
|---|---|
| USA | 7.0% |
| Germany | 5.7% |
| India | 11.0% |
The USA market needs innovative products that substitute sugar to assist consumers practicing keto and paleo dietary restrictions
Sugar alternatves joining the USA food market for keto and paleo diets mark an active space at the cutting edge of product development. Major developments have occurred because consumers seek low-carb naturally sweetened products.
The preferred substances for keto-friendly substitutes include erythritol alongside stevia and monk fruit extract. The sugar alcohol substance Erythritol allows users to enjoy sweet taste levels like regular sugar while avoiding calories and preserving blood sugar stability making it great for keto dessert items and snack consumption.
Two plant-based products named stevia and monk fruit extract deliver strong sweet flavors to beverages and chocolates which also appear in energy bars.
When following the paleo diet people tend to prefer honey produced from raw sources along with coconut sugar. Coconut sugar maintains its nutritional value because it comes from coconut palm nectar while also conforming to the paleo movement's preference for unprocessed whole ingredients.
Not being ketogenic enables raw honey to retain its popularity because of its authentic natural extraction while avoiding significant processing which matches paleo guidelines.
The German food and beverage sector experienced radical changes when processed foods emerged to lead because consumer lifestyles changed. An elevated health interest and time-saving needs have created increased market demand for convenient meal options including ready-made nutrition-rich dishes and fortified food products which address numerous dietary requirements.
Sustainability factors have gained significant importance in business which causes organizations to focus on reducing their environmental footprints. Sustainable food improvements include the development of degradable packaging solutions together with waste reduction programs and support for local ingredient procurement. Blockchain technology has improved transparency so consumers can track their food products from growing fields to final delivery.
Companies place special importance on natural components as well as clear labeling information. Consumers are showing a preference for products that are free from artificial additives and preservatives. Processed food manufacturers are tapping into this trend by introducing products that align with these values
The Indian market has seen substantial changes in processed foods consumption because of rising urbanization levels together with increased disposable income. Working citizens who move to cities embrace rapid schedules where convenience stands as their top concern. The numerical shift of people to cities creates an elevated demand for processed foods as well as ready-to-eat meals and easy preparation food options. Americans with increased disposable income now buy processed foods on a regular basis which is leading these products to become more prominent in people's diets.
Modern retail approaches complemented by supermarkets together with digital grocery markets have expanded processed food accessibility across wider markets. Targeted food company marketing along with easy access have been instrumental forces that drove up customer interest in processed foods. The growing consumption of Western-style meals alongside dietary preferences for novelty fuels India's increasing market for processed food items.
Urbanization along with rising purchasing power and changing consumer tastes has established a powerful market for processed foods throughout India. The market for processed foods will keep expanding because of ongoing urban development and economic growth which secures processed foods as fundamental components of urban Indian lifestyles.

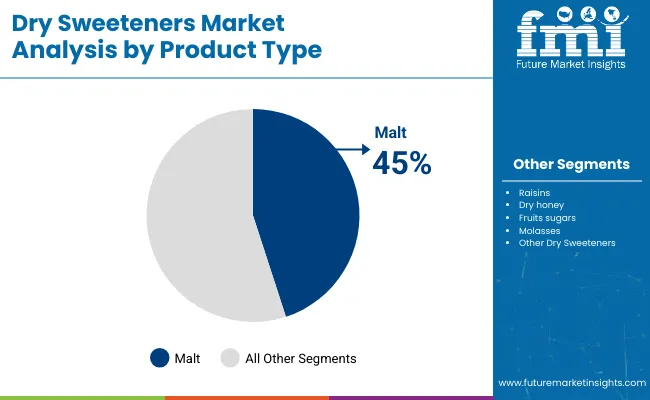
| Segment | Value Share (2025) |
|---|---|
| Malt (Product Type) | 45% |
The worldwide popularity of malt-based food products demonstrates that consumer food tastes continue to change. Consumers now choose unprocessed food products and natural ingredients so malt-based sweeteners make an excellent fit for the current market demands.
Barley-derived malt products preserve all original nutrients from barley while offering natural-flavored options which draw health-focused consumers. The application of malt extends beyond traditional malt beverages because malt extract actively functions as an essential additive in baked goods and cereals and confectioneries to boost flavor quality along with preservation attributes.
The rising demand of gluten-free products has catalyzed malt extract producers to introduce rice-derived versions among other non-barley grain extracts demonstrating industry flexibility. Issuing information about ingredient sources and processing methods forms the core of the clean-label movement in which manufacturers who use malt products align.
The detailed knowledge of customers about food components has made malt products more appealing due to their natural origin.

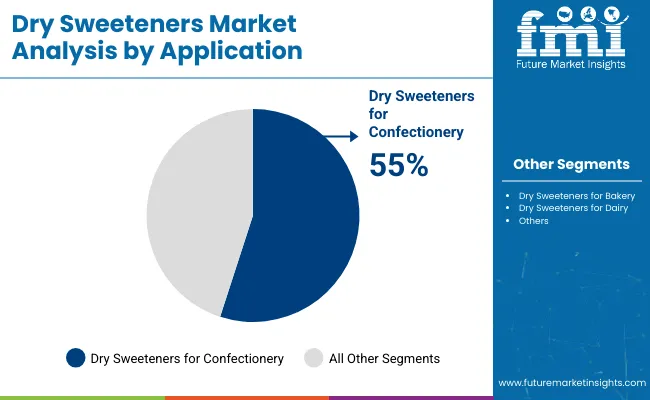
| Segment | Value Share (2025) |
|---|---|
| Dry Sweeteners for Confectionery (Application) | 55% |
Dry sweeteners have gained global leadership within the confectionery market because of their increasing application in this sector. The move by consumers toward health-focused eating patterns drives the confectionery industry's transformation path. People are now exercising greater caution regarding their sugar consumption because they understand its health risks yet desire satisfying results which dry sweeteners offer them. Manufacturers of confectioneries are now using dry sweeteners including stevia alongside erythritol and monk fruit to create delicious treats without any guilt.
Dry sweeteners drive sector expansion through their ability to replicateLongrightarrow both sugar characteristics and health considerations in confectionery which leads to innovative.to industry growth opportunities. The ongoing advancement of dry sweetener technology indicates their strong industry-leading position for the coming years of confectionery market evolution.
Competitive pressure in the dry sweeteners sector exists because of four primary companies: Archer Daniels Midland Company, Sweeteners Plus, Marroquin Organic, along with Cargill Incorporated. Through their research and development powers these companies lead market innovation by concentrating on natural yet organic sweeteners to meet increasing health-focused consumer behavior.
The dual leaders Archer Daniels Midland and Cargill maintain market dominance by connecting their global reach with diverse product lines and the market segment leaders Sweeteners Plus and Marroquin Organic establish their positions by concentrating on sophisticated operations and quality requirements.
Gaining market share in healthier sweetener solutions comes from strategic alliances and mergers combined with expanding online distribution options allowing companies to profit from rising consumer interest in natural sweeteners.
The market is expected to grow at a CAGR of 5.6 % throughout the forecast period.
By 2035, the sales value is expected to be worth USD 8281.3 Million.
North America is expected to dominate the global consumption.
Archer Daniels Midland Company; Sweeteners Plus; Marroquin Organic; Cargill Incorporated


Full Research Suite comprises of:
Market outlook & trends analysis
Interviews & case studies
Strategic recommendations
Vendor profiles & capabilities analysis
5-year forecasts
8 regions and 60+ country-level data splits
Market segment data splits
12 months of continuous data updates
DELIVERED AS:
PDF EXCEL ONLINE
Dry-type Air-core Smoothing Reactor Market Size and Share Forecast Outlook 2025 to 2035
Dry Powder Inhaler Market Size and Share Forecast Outlook 2025 to 2035
Dry Vacuum Pumps Market Size and Share Forecast Outlook 2025 to 2035
Dry Cleaning Solvents Market Size and Share Forecast Outlook 2025 to 2035
Dry Block Heaters Market Size and Share Forecast Outlook 2025 to 2035
Dry Fog Dust Suppression Equipment Market Size and Share Forecast Outlook 2025 to 2035
Dry Scalp Treatment Market Size and Share Forecast Outlook 2025 to 2035
Dry Type Distribution Transformer Market Size and Share Forecast Outlook 2025 to 2035
Dry Type Current Transformer Market Size and Share Forecast Outlook 2025 to 2035
Dry Eye Syndrome Treatment Market Size and Share Forecast Outlook 2025 to 2035
Dry Type Automated Solar Panel Cleaning Market Size and Share Forecast Outlook 2025 to 2035
Dry Electrostatic Precipitator Market Size and Share Forecast Outlook 2025 to 2035
Dry Herb Cannabis Vaporizers Market Size and Share Forecast Outlook 2025 to 2035
Dry Type Transformer Market Size and Share Forecast Outlook 2025 to 2035
Dry Whole Milk Powder Market Size and Share Forecast Outlook 2025 to 2035
Dry Gas Coupling Market Analysis Size and Share Forecast Outlook 2025 to 2035
Dry Mixes Market Analysis - Size, Share and Forecast Outlook 2025 to 2035
Dryer Sheets Market Size and Share Forecast Outlook 2025 to 2035
Dry Electrostatic Wipes Market Size and Share Forecast Outlook 2025 to 2035
Drylab Photo Printing Market Size and Share Forecast Outlook 2025 to 2035

Thank you!
You will receive an email from our Business Development Manager. Please be sure to check your SPAM/JUNK folder too.
Chat With
MaRIA