Dry Eye Syndrome Treatment Market
Market Insights on Dry Eye Syndrome Treatment covering sales outlook, demand forecast & up-to-date key trends
Dry Eye Syndrome Treatment Market by Product Type, Prescription, Distribution Channel &Region -Forecast for 2022-2031
Dry Eye Syndrome Treatment Market Overview (2022-2031)
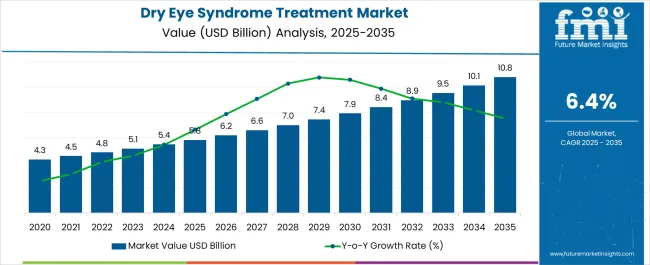
[314 Pages Report] The global dry eye syndrome treatment market size is estimated to reach US$ 4.80 Bn in 2022 and is projected to grow at a healthy CAGR of 7.0% between 2022 and 2032, surpassing a valuation of US$ 8.84 Bn by the end of 2031.
Rising prevalence of dry eye syndrome, along with increasing demand for dry eye treatment for relieving various symptoms is a major factor boosting the growth of dry eye syndrome treatment market.
Dry eye disease (DED) has become a public health concern causing ocular discomfort, fatigue and visual disturbance that interferes with quality of life. It is one of the most common and uncomfortable ocular surface diseases (OSDs).
It occurs when tears are not able to provide adequate moisture/lubrication or there is low production of tears. Presence of this condition can lead to numerous symptoms ranging from redness of the eyes, burning sensation, and inflammation to itching and blurry vision.
The rapid rise in dry eye disease cases coupled with increasing adoption of various treatments like dry eye treatment drops and artificial tears for relieving multiple symptoms will create opportunities for growth in dry eye syndrome treatment market and eyecare products market during the forecast period.
In addition to this, rising popularity of excimer and femtosecond ophthalmic lasers for treating dry eye syndrome will auger well for the market in the forthcoming years.
Market Outlook:
Data Points |
Market Insights |
Dry Eye Syndrome Treatment Market Value 2021 |
US$ 4.52 Bn |
Dry Eye Syndrome Treatment Market Value 2022 |
US$ 4.80 Bn |
Dry Eye Syndrome Treatment Market Value 2031 |
US$ 8.84 Bn |
Dry Eye Syndrome Treatment Market Forecast CAGR 2022-2031 |
7.0% |
Market Share of Top 5 Countries |
53.4% |
Key Players |
Allergen plc. (Abbvie), Novartis AG, Otsuka Pharmaceuticals Co., Ltd., Bausch Health Companies, Inc. Akron, Inc., Johnson & Johnson, Inc., Thea Pharmaceuticals Limited, OASIS Medical, Altaire Pharmaceuticals Inc., Boiron USA, Similasan Corporation, Scope Ophthalmics Ltd., Reckitt Benckiser Group PLC, Medicom Healthcare Ltd, FDC Limited., Lupin Limited, Jamjoom Pharmaceuticals Co., and Sentiss Pharma Private limited. |
In recent years there has been a sharp rise in various eye diseases due to increasing usage of electronic gadgets such as cell phones, tablets and laptops. This has generated immense demand for dry eye treatments and the trend is likely to escalate during the forecast period.
Similarly, increase in the number of eye care centers worldwide and rising penetration of OTC eyedrop market across both developed and developing regions will boost market growth during the assessment period.
In 2021, the dry eye syndrome treatment market accounted for around 12% of the US$ 36.0 Bn ophthalmology drugs market in 2021. Rising demand for dry eye syndrome treatments along with rapid expansion of ophthalmic eye drops market worldwide will continue to augment market growth in upcoming years.
Let us know your requirement to get
100% FREE customization
How The Market Progressed Till June 2022?
Particulars |
Details |
H1, 2021 |
6.84% |
H1, 2022 Projected |
7.01% |
H1, 2022 Outlook |
6.31% |
BPS Change - H1, 2022 (O) – H1, 2022 (P) |
(-) 70 ↓ |
BPS Change – H1, 2022 (O) – H1, 2021 |
(-) 53 ↓ |
The comparative and review analysis of the market dynamics as well as market growth rate of global dry eye syndrome treatment market as studied by Future Market Insights, will show a negative BPS growth in H1-2022 outlook as compared to H1-2022 projected period by 70 BPS, and, a decline in BPS growth is expected in H1-2022 over H1- 2021 duration with 53 Basis Point Share (BPS).
The market is subject to changes as per macro and industry standards with reference to pharmaceutical licensing and prescription pattern for the indication. The decline in the BPS values is associated with the lack of standardized treatment guidelines and modalities for dry eye in different regions, and the lack of the current available OTC drugs in efficient management of the disease indication, owing to the low drug bioavailability.
Key developments in the market include the development of intranasal tear neurostimulation devices, which induce an increase in tear production in adults. With the development of new treatment modalities, the market for dry eye syndrome treatment is set to gain traction over the forecasted years, promoting a positive outlook in demand.
2016-2021 Market Demand Outlook For Dry Eye Syndrome Treatment Compared To 2022-2031 Forecast
The global sales of dry eye syndrome treatment is expected to rise at a robust CAGR of 7% between 2022 and 2032 in comparison to 6.2% CAGR registered from 2016 and 2021. Increasing incidence of dry eye syndrome worldwide, rise in product development and innovation, surge in number of LASIK surgeries, and rapid expansion of eyedrop market are some of the key factors driving the growth in dry eye syndrome treatment market.
Dry eye syndrome treatment includes a wide range of therapeutics that are being utilized to treat dry eye syndrome. Adoption of these treatments significantly reduces various symptoms associated with dry eye syndrome and thus enable patients to lead a quality life.
Growing awareness among individuals about dry eye syndrome and its symptoms is expected to boost the sales of dry eye syndrome treatment during the forecast period. Furthermore, exponential growth of eye infections treatment market across developing regions will make a conducive environment for the manufacturers of dry eye syndrome treatments in future.
Similarly, expansion of dry eye remedies market size across developing regions along with surging adoption of dry eye treatment drops by patients for relieving multiple symptoms will generate lucrative opportunities for the manufacturers of dry eye syndrome treatment.
Which Factors Are Restraining The Growth In Dry Eye Syndrome Treatment Market?
Despite a positive growth trajectory, the global dry eye syndrome treatment market is facing various challenges that are likely to pose a threat to its growth during the forecast period. Some of these factors are lack of awareness about dry eye disease and poor availability of certain products across emerging economies.
Find your sweet spots for generating winning opportunities in this market.
Talk to AnalystCountry-Wise Insights
What Makes the U.S. an Attractive Market for Dry Eye Syndrome Treatment?
“Booming Eyecare Products Market and Rising Investments in Research and Development Driving Growth in the U.S. Market”
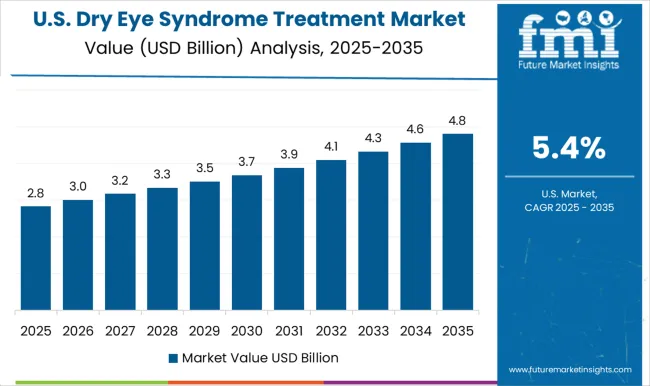
The U.S. is estimated to account for over 80.6% of the North America dry eye syndrome treatment market in 2022. Rising prevalence of dry eye syndrome, presence of leading pharmaceutical manufacturers, and rapid expansion of eyecare products market and vision care market are some of the factors driving demand in the U.S. market.
Similarly, increasing research and development activities for novel treatments, rising consumer awareness about the prevailing dry eye disease treatment market trends, and growing popularity of dry eye treatment drops are expected to aid market growth in the region during the forecast period.
Why is Germany Considered a Lucrative Market for Dry Eye Syndrome Treatment?
“Heavy Presence of Leading Market Players Favoring Market Growth in Germany”
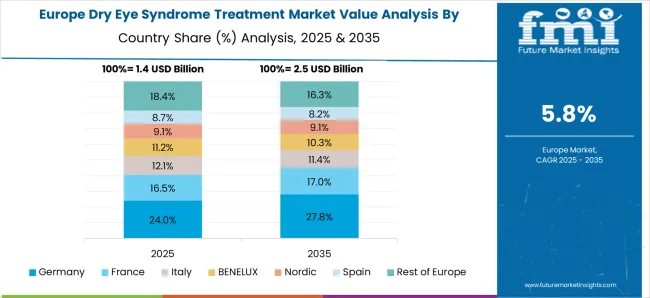
Germany is expected to dominate the Europe dry eye syndrome treatment market with around 17.2% value share in 2022. Large presence of pharmaceutical companies, rapid growth of OTC eyedrop market, and growing aging populations is driving the demand in the Germany market.
What are the Factors Fueling the Demand for Dry Eye Syndrome Treatment in China?
"Rising Geriatric Population and Surge in Dry Eye Disease Cases Fueling Demand in China”
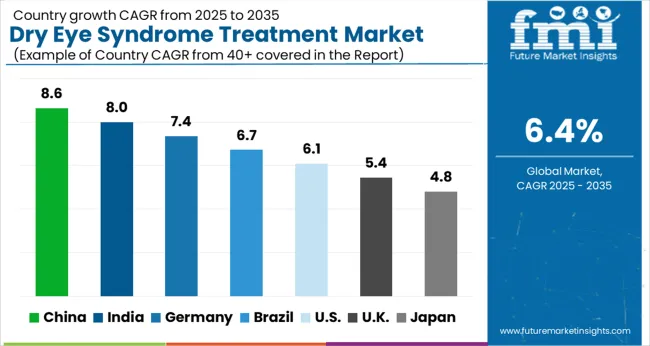
The dry eye syndrome treatment market in China is projected to grow at 9.5% CAGR throughout the forecast period. Amid rising prevalence of keratoconjunctivitis sicca (KS), there is a rapid surge in research & development activities to develop new drugs for effective treatment of the disease.
Similarly, flourishing eyedrop market, rising geriatric population, availability of various dry eye treatment drops at lower costs, and rapid expansion of dry eye remedies market size are expected to create lucrative opportunities for the manufacturers of dry eye syndrome treatments across China during the forecast period.
Category-Wise Insights
Which is the Top Selling Product for the Treatment of Dry Eye Syndrome?
“Demand for Artificial Tears to Continue Gaining Traction”
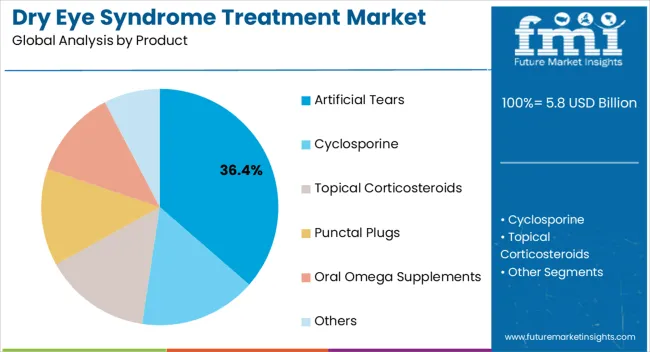
By product, artificial tears segment accounted for the maximum share of 60.8% in 2021 and is expected to grow at a healthy CAGR of 7.1% during the forecast period.
Factors such as high prevalence of dry eye disease, increasing screen time, aging population, rising demand for dry eye treatment, and highly effective nature of artificial tears in reducing various symptoms of dry eye syndrome are triggering growth in this segment.
Which Prescription Category Leads the Global Dry Eye Syndrome Treatment Market?
“Rx Segment to Lead the Global Dry Eye Syndrome Treatment Market”
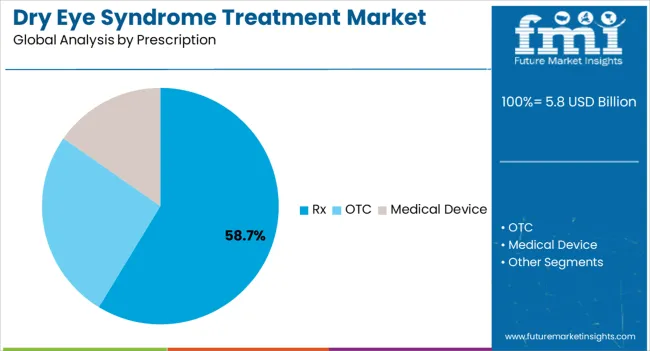
In terms of prescription, Rx (prescription) medicine segment accounted for 71.4% of the total market share in 2021 and is forecast to grow at a significant pace during the assessment period. Availability of novel products with improved mechanism of action, making it preferred choice among ophthalmologist is one of the primary factors positively driving the sales of the prescription drugs.
Which Distribution Segment Accounts for the Largest Revenue Generation?
“Hospital Pharmacies and Retail Pharmacies to Remain Attractive Destinations for Dry Eye Syndrome Treatment”
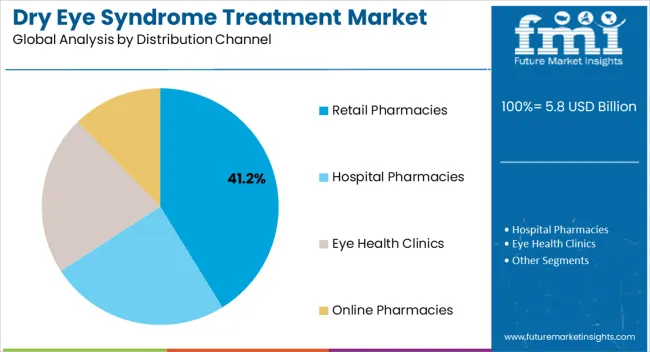
By distribution channel, hospital pharmacies and retail pharmacies together accounted for more than 80.0% of the dry eye syndrome treatment market in 2021 and the trend is expected to continue throughout the forecast period (2022-2031). Hospital pharmacies are given preference as most of the medications are prescribed after thorough eye examination by an ophthalmologist.

A unified Market Research Subscription Platform, built for today's disparate research needs.
Competitive Landscape
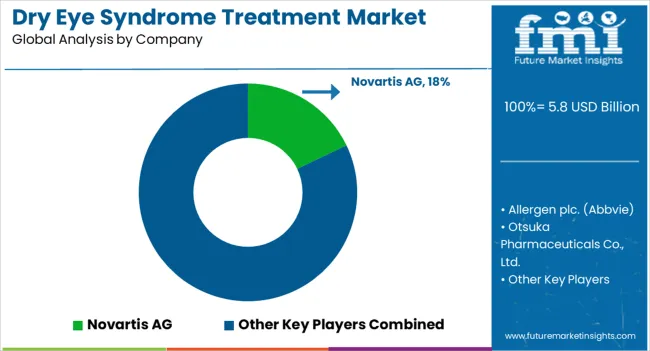
llergen plc. (Abbvie), Novartis AG, Otsuka Pharmaceuticals Co., Ltd., Bausch Health Companies, Inc. Akron, Inc., and Johnson & Johnson, Inc. are some of the leading players operating in the market.
Key players in dry eye syndrome treatment market are actively seeking to strengthen their position through new product launches, approvals, and agreements. They are vigorously investing in research and development activities to introduce novel products with effective and long-lasting features.
For instance:
- In October 2021, the U.S. Food and Drug Administration (FDA) approved Tyrvaya nasal spray for dry eye. The spray simulates tear, oil and mucin production and thus eliminates undesirable ocular stinging and burning sensations.
- In October 2019, Sun Pharmaceutical Industries Ltd, announced that one of its wholly owned subsidiaries has commercialized CEQUA (cyclosporine ophthalmic solution) 0.09% in the U.S. With U.S.
Scope Of The Report
Understand the prevailing trends and emerging opportunities in the dry eye syndrome treatment market with latest report from the leading research firm Future Market Insights. Know in detail about the major forces behind the expansion of dry eye syndrome treatment market.
Besides underscoring the impact of government initiatives to tackle the rising burden of dry eye syndrome, FMI’s report highlights the correlation between ophthalmic eye drops market and dry eye syndrome treatment market.
It provides solutions to queries like how will the development of novel therapeutics affect growth of dry eye syndrome treatment market? Why is North America dominating the global dry eye syndrome treatment market? and which factors are making Asia Pacific a lucrative market for dry eye syndrome treatment? Detailed information on this is compiled in the dry eye syndrome treatment market analysis, which is interspersed with relevant statistics and graphs.
The Dry Eye Syndrome Treatment market analysis includes:
- A 9-year realistic dry eye syndrome treatment sales forecast slicing forecast across multiple verticals
- Demand and supply trend analysis across 25 countries for dry eye treatment drops
- Impact of novel product development and launches on dry eye syndrome treatment market
- Systematic analysis of regional pockets and leading segments of dry eye syndrome treatment in detail
- Illustrative representation of statistical data showcasing sales trends across each year over the assessment period
- Strategies adopted by leading dry eye syndrome treatment market players to stay on top of the ladder
- Cascading effect of the dry eye remedies market growth on dry eye syndrome treatment sales
- Dry eye disease treatment market trends and their influence on sales prospects of dry eyes treatment
- Most effective go-to-market strategy for dry eye syndrome treatment market growth
- Governing factors including consumer preference, trends driving sales of OTC eyedrops and their impact on sales of dry eye syndrome treatment
Attribute |
Details |
Forecast Period |
2022-2031 |
Historic Data Available for |
2016-2021 |
Market Analysis |
US$ Million for Value |
Report Coverage |
Market forecast, company share analysis, competition intelligence, DROT analysis, market dynamics and challenges, and strategic growth initiatives |
Key Segments Covered |
|
Key regions covered |
North America
Latin America
Western Europe
Eastern Europe
South Asia Pacific
Middle East & Africa
Rest of the World
|
Distribution Channel |
|
Key companies profiled |
Allergen plc. (Abbvie), Novartis AG, Otsuka Pharmaceuticals Co., Ltd., Bausch Health Companies, Inc., Akron, Inc., Johnson & Johnson, Inc., Thea Pharmaceuticals Limited, OASIS Medical, Altaire Pharmaceuticals Inc., Boiron USA, Similasan Corporation, Scope Ophthalmics Ltd., Reckitt Benckiser Group PLC, Medicom Healthcare Ltd, FDC Limited., Lupin Limited, Jamjoom Pharmaceuticals Co., Sentiss Pharma Private limited. |
Customization & pricing |
Available upon request |
Dry Eye Syndrome Treatment Market By Category
By Product:
- Cyclosporine
- Topical Corticosteroids
- Artificial Tears
- Punctal Plugs
- Removable
- Dissolvable
- Oral Omega Supplements
- Others
By Prescription:
- Rx
- OTC
- Medical Device
By Distribution Channel:
- Hospital Pharmacies
- Eye Health Clinics
- Retail Pharmacies
- Online Pharmacies
By Region:
- North America
- Latin America
- Europe
- East Asia
- South Asia
- Oceania
- Middle East and Africa (MEA)
Frequently Asked Questions
The global dry eye syndrome treatment market is set to grow at 7.0% CAGR throughout the forecast period.
North America currently holds the largest market share of 37.6% in the dry eye syndrome treatment market.
Rise in number of research & development activities to develop effective treatment for dry eye syndrome and OTC availability of the DES drugs are some of the key trends witnessed in this market place.
The dry eye syndrome treatment market in Japan is expected to grow at 6.1% CAGR during the forecast period.
Table of Content
1. Executive Summary
1.1. Global Market Outlook
1.2. Demand Side Trends
1.3. Supply Side Trends
1.4. Analysis and Recommendations
2. Market Overview
2.1. Market Coverage / Taxonomy
2.2. Market Definition / Scope / Limitations
2.3. Inclusion and Exclusions
3. Key Market Trends
3.1. Key Trends Impacting the Market
3.2. Method Innovation / Development Trends
4. Key Success Factors
4.1. Dry Eye Syndrome Epidemiology, By Country, 2016-2031
4.1.1. Prevalence of dry eye disease
4.1.2. Potential patient number of dry eye disease
4.1.3. Percentage of severity, mild, modulate, and severe
4.1.4. Patients number under treatment
4.1.5. Prevalence of MGD and occurrence rate of dry eye among MGD patient
4.2. Regulatory Scenario
4.3. New Product Launches
4.4. Reimbursement Scenario
4.5. Dry Eye Syndrome- Diagnostics protocol/ Criteria by key countries
4.6. Dry Eye Syndrome – Patient Treatment Journey
5. Market Background
5.1. Macro-Economic Factors
5.1.1. Global GDP Growth Outlook
5.1.2. Global Healthcare Industry Outlook
5.2. Forecast Factors - Relevance & Impact
5.2.1. Increase in Geriatric Population
5.2.2. Increasing Prevalence of Dry Eye Syndrome
5.2.3. Limited Awareness About Dry Eye Syndrome
5.3. Market Dynamics
5.3.1. Drivers
5.3.2. Restraints
5.3.3. Trends
5.3.4. Opportunity Analysis
6. COVID19 Crisis Analysis
6.1. Current COVID19 Statistics and Probable Future Impact
6.2. Current GDP Projection and Probable Impact
6.3. Current Economic Projection as compared to 2008 Economic analysis
6.4. COVID19 and Impact Analysis
6.4.1. Revenue By Product
6.4.2. Revenue By Distribution Channel
6.4.3. Revenue By Prescription
6.4.4. Revenue By Country
7. Global Dry Eye Syndrome Market Demand (In Volume Units) Analysis 2016–2021 and Forecast, 2022-2031
7.1. Historical Market (Volume) Analysis, 2016–2021
7.2. Current and Future Market (Volume) Projections, 2022-2031
7.2.1. Y-o-Y Growth Trend Analysis
8. Global Dry Eye Syndrome Market- Pricing Analysis
8.1. Regional Pricing Analysis, By Product
8.2. Pricing Break-up
8.2.1. Manufacturer Level Pricing
8.2.2. Distributor Level Pricing
8.3. Average Pricing Analysis Benchmark
9. Global Dry Eye Syndrome Market Value (US$ Mn) Analysis 2016-2021 and Forecast, 2022-2031
9.1. Historical Market Value (US$ Mn) Analysis, 2016-2021
9.2. Current and Future Market Value (US$ Mn) Projections, 2022-2031
9.2.1. Y-o-Y Growth Trend Analysis
9.2.2. Absolute $ Opportunity Analysis
10. Global Dry Eye Syndrome Market Analysis 2016-2021 and Forecast 2022-2031, By Product
10.1. Introduction / Key Findings
10.2. Historical Market Size (US$ Mn) By Product, 2016-2021
10.3. Current and Future Market Size (US$ Mn) Analysis and Forecast By Product, 2022-2031
10.3.1. Cyclosporin
10.3.2. Topical Corticosteroids
10.3.3. Artificial Tears
10.3.4. Punctal plugs
10.3.4.1. Removable
10.3.4.2. Dissolvable
10.3.5. Omega Supplements
10.4. Others Market Attractiveness Analysis, By Product
11. Global Dry Eye Syndrome Market Analysis 2016-2021 and Forecast 2022-2031, By Prescription
11.1. Introduction / Key Findings
11.2. Historical Market Size (US$ Mn) By Prescription, 2016-2021
11.3. Current and Future Market Size (US$ Mn) Analysis and Forecast By Prescription, 2022-2031
11.3.1. Rx
11.3.2. OTC
11.3.3. Medical Device
11.4. Others Market Attractiveness Analysis, By Prescription
12. Global Dry Eye Syndrome Market Analysis 2016-2021 and Forecast 2022-2031, By Distribution Channel
12.1. Introduction / Key Findings
12.2. Historical Market Size (US$ Mn) By Distribution Channel, 2016-2021
12.3. Current and Future Market Size (US$ Mn)) Analysis and Forecast By Distribution Channel, 2022-2031
12.3.1. Hospital Pharmacies
12.3.2. Eye Health Clinics
12.3.3. Retail Pharmacies
12.3.4. Online Pharmacies
12.4. Market Attractiveness Analysis, By Distribution Channel
13. Global Dry Eye Syndrome Market Analysis 2016-2021 and Forecast 2022-2031, by Region
13.1. Introduction
13.2. Historical Market Size (US$ Mn) Analysis, By Region, 2016 - 2021
13.3. Current Market Size (US$ Mn) Analysis and Forecast By Region, 2022 - 2031
13.3.1. North America
13.3.2. Latin America
13.3.3. Europe
13.3.4. East Asia
13.3.5. South Asia
13.3.6. Oceania
13.3.7. Middle East and Africa (MEA)
13.4. Market Attractiveness Analysis, By Region
14. North America Dry Eye Syndrome Market Analysis 2016-2021 and Forecast 2022-2031
14.1. Introduction
14.2. Historical Market Size (US$ Mn) Analysis, By Market Taxonomy, 2016-2021
14.3. Current and Future Market Size (US$ Mn) Analysis Forecast By Market Taxonomy, 2022-2031
14.3.1. By Country
14.3.1.1. U.S.
14.3.1.2. Canada
14.3.2. By Product
14.3.3. By Prescription
14.3.4. By Distribution Channel
14.4. Market Attractiveness Analysis
14.5. Drivers and Restraints - Impact Analysis
15. Latin America Dry Eye Syndrome Market Analysis 2016-2021 and Forecast 2022-2031
15.1. Introduction
15.2. Historical Market Size (US$ Mn) Analysis, By Market Taxonomy, 2016 - 2021
15.3. Current and Future Market Size (US$ Mn) Analysis Forecast By Market Taxonomy, 2022-2031
15.3.1. By Country
15.3.1.1. Brazil
15.3.1.2. Mexico
15.3.1.3. Rest of Latin America
15.3.2. By Product
15.3.3. By Prescription
15.3.4. By Distribution Channel
15.4. Market Attractiveness Analysis
15.5. Drivers and Restraints - Impact Analysis
16. Europe Dry Eye Syndrome Market Analysis 2016-2021 and Forecast 2022-2031
16.1. Introduction
16.2. Historical Market Size (US$ Mn) Analysis, By Market Taxonomy, 2016-2021
16.3. Current and Future Market Size (US$ Mn) Analysis Forecast By Market Taxonomy 2022-2031
16.3.1. By Country
16.3.1.1. Germany
16.3.1.2. Italy
16.3.1.3. France
16.3.1.4. U.K.
16.3.1.5. Spain
16.3.1.6. Russia
16.3.1.7. Poland
16.3.1.8. Rest of Europe
16.3.2. By Product
16.3.3. By Prescription
16.3.4. By Distribution Channel
16.4. Market Attractiveness Analysis
16.5. Drivers and Restraints - Impact Analysis
17. South Asia Dry Eye Syndrome Market Analysis 2016-2021 and Forecast 2022-2031
17.1. Introduction
17.2. Historical Market Size (US$ Mn) Analysis, By Market Taxonomy, 2016-2021
17.3. Current and Future Market Size (US$ Mn) Analysis, By Market Taxonomy 2022-2031
17.3.1. By Country
17.3.1.1. India
17.3.1.2. Thailand
17.3.1.3. Indonesia
17.3.1.4. Malaysia
17.3.1.5. Vietnam
17.3.1.6. Rest of South Asia
17.3.2. By Product
17.3.3. By Prescription
17.3.4. By Distribution Channel
17.4. Market Attractiveness Analysis
17.5. Drivers and Restraints - Impact Analysis
18. East Asia Dry Eye Syndrome Market Analysis 2016-2021 and Forecast 2022-2031
18.1. Introduction
18.2. Historical Market Size (US$ Mn) Analysis, By Market Taxonomy, 2016-2021
18.3. Current and Future Market Size (US$ Mn) Analysis, By Market Taxonomy, 2022-2031
18.3.1. By Country
18.3.1.1. China
18.3.1.2. Japan
18.3.1.3. South Korea
18.3.2. By Product
18.3.3. By Prescription
18.3.4. By Distribution Channel
18.4. Market Attractiveness Analysis
18.5. Drivers and Restraints - Impact Analysis
19. Oceania Dry Eye Syndrome Market Analysis 2016-2021 and Forecast 2022-2031
19.1. Introduction
19.2. Historical Market Size (US$ Mn Analysis, By Market Taxonomy, 2016-2021
19.3. Current and Future Market Size (US$ Mn) Analysis, By Market Taxonomy, 2022-2031
19.3.1. By Country
19.3.1.1. Australia
19.3.1.2. New Zealand
19.3.2. By Product
19.3.3. By Prescription
19.3.4. By Distribution Channel
19.4. Market Attractiveness Analysis
19.5. Drivers and Restraints - Impact Analysis
20. Middle East and Africa Dry Eye Syndrome Market Analysis 2016-2021 and Forecast 2022-2031
20.1. Introduction
20.2. Historical Market Size (US$ Mn) Analysis, By Market Taxonomy, 2016-2021
20.3. Current and Future Market Size (US$ Mn) Analysis, By Market Taxonomy, 2022-2031
20.3.1. By Country
20.3.1.1. GCC Countries
20.3.1.2. South Africa
20.3.1.3. North Africa
20.3.1.4. Rest of Middle East and Africa
20.3.2. By Product
20.3.3. By Prescription
20.3.4. By Distribution Channel
20.4. Market Attractiveness Analysis
20.5. Drivers and Restraints - Impact Analysis
21. Countries Dry Eye Syndrome Market 2022 & 2031
21.1. U.S. Dry Eye Syndrome Market Analysis
21.1.1. By Product
21.1.2. By Prescription
21.1.3. By Distribution Channel
21.2. Canada Dry Eye Syndrome Market Analysis
21.2.1. By Product
21.2.2. By Prescription
21.2.3. By Distribution Channel
21.3. Brazil Dry Eye Syndrome Market Analysis
21.3.1. By Product
21.3.2. By Prescription
21.3.3. By Distribution Channel
21.4. Mexico Dry Eye Syndrome Market Analysis
21.4.1. By Product
21.4.2. By Prescription
21.4.3. By Distribution Channel
21.5. U.K. Dry Eye Syndrome Market Analysis
21.5.1. By Product
21.5.2. By Prescription
21.5.3. By Distribution Channel
21.6. Germany Dry Eye Syndrome Market Analysis
21.6.1. By Product
21.6.2. By Prescription
21.6.3. By Distribution Channel
21.7. France Dry Eye Syndrome Market Analysis
21.7.1. By Product
21.7.2. By Prescription
21.7.3. By Distribution Channel
21.8. Italy Dry Eye Syndrome Market Analysis
21.8.1. By Product
21.8.2. By Prescription
21.8.3. By Distribution Channel
21.9. Spain Dry Eye Syndrome Market Analysis
21.9.1. By Product
21.9.2. By Prescription
21.9.3. By Distribution Channel
21.10. Russia Dry Eye Syndrome Market Analysis
21.10.1. By Product
21.10.2. By Prescription
21.10.3. By Distribution Channel
21.11. Poland Dry Eye Syndrome Market Analysis
21.11.1. By Product
21.11.2. By Prescription
21.11.3. By Distribution Channel
21.12. Japan Dry Eye Syndrome Market Analysis
21.12.1. By Product
21.12.2. By Prescription
21.12.3. By Distribution Channel
21.13. China Dry Eye Syndrome Market Analysis
21.13.1. By Product
21.13.2. By Prescription
21.13.3. By Distribution Channel
21.14. South Korea Dry Eye Syndrome Market Analysis
21.14.1. By Product
21.14.2. By Prescription
21.14.3. By Distribution Channel
21.15. India Dry Eye Syndrome Market Analysis
21.15.1. By Product
21.15.2. By Prescription
21.15.3. By Distribution Channel
21.16. Thailand Dry Eye Syndrome Market Analysis
21.16.1. By Product
21.16.2. By Prescription
21.16.3. By Distribution Channel
21.17. Indonesia Dry Eye Syndrome Market Analysis
21.17.1. By Product
21.17.2. By Prescription
21.17.3. By Distribution Channel
21.18. Malaysia Dry Eye Syndrome Market Analysis
21.18.1. By Product
21.18.2. By Prescription
21.18.3. By Distribution Channel
21.19. Vietnam Dry Eye Syndrome Market Analysis
21.19.1. By Product
21.19.2. By Prescription
21.19.3. By Distribution Channel
21.20. Australia Dry Eye Syndrome Market Analysis
21.20.1. By Product
21.20.2. By Prescription
21.20.3. By Distribution Channel
21.21. New Zealand Dry Eye Syndrome Market Analysis
21.21.1. By Product
21.21.2. By Prescription
21.21.3. By Distribution Channel
21.22. GCC Countries Dry Eye Syndrome Market Analysis
21.22.1. By Product
21.22.2. By Prescription
21.22.3. By Distribution Channel
21.23. South Africa Dry Eye Syndrome Market Analysis
21.23.1. By Product
21.23.2. By Prescription
21.23.3. By Distribution Channel
22. Market Structure Analysis
22.1. Market Analysis, By Tier of Companies
22.2. Market Concentration
22.3. Market Presence Analysis
22.3.1. By Regional footprint of Players
22.3.2. Product foot print by Players
22.3.3. Channel Foot Print by Players
23. Competition Analysis
23.1. Competition Dashboard
23.2. Competition Deep Dive
23.2.1. Allergan Plc.
23.2.1.1. Product Portfolio
23.2.1.2. Profitability by Market Segments (Drugs/Channel/Region)
23.2.1.3. Sales Footprint
23.2.1.4. Strategy Overview
23.2.1.4.1. Marketing Strategy
23.2.1.4.2. Product Strategy
23.2.1.4.3. Channel Strategy
23.2.2. Novartis AG
23.2.2.1. Product Portfolio
23.2.2.2. Profitability by Market Segments (Drugs/Channel/Region)
23.2.2.3. Sales Footprint
23.2.2.4. Strategy Overview
23.2.2.4.1. Marketing Strategy
23.2.2.4.2. Product Strategy
23.2.2.4.3. Channel Strategy
23.2.3. Otsuka Pharmaceutical Co.,Ltd.
23.2.3.1. Product Portfolio
23.2.3.2. Profitability by Market Segments (Drugs/Channel/Region)
23.2.3.3. Sales Footprint
23.2.3.4. Strategy Overview
23.2.3.4.1. Marketing Strategy
23.2.3.4.2. Product Strategy
23.2.3.4.3. Channel Strategy
23.2.4. Santen Pharmaceutical Co Ltd.
23.2.4.1. Product Portfolio
23.2.4.2. Profitability by Market Segments (Drugs/Channel/Region)
23.2.4.3. Sales Footprint
23.2.4.4. Strategy Overview
23.2.4.4.1. Marketing Strategy
23.2.4.4.2. Product Strategy
23.2.4.4.3. Channel Strategy
23.2.5. Bausch Health Companies Inc.
23.2.5.1. Product Portfolio
23.2.5.2. Profitability by Market Segments (Drugs/Channel/Region)
23.2.5.3. Sales Footprint
23.2.5.4. Strategy Overview
23.2.5.4.1. Marketing Strategy
23.2.5.4.2. Product Strategy
23.2.5.4.3. Channel Strategy
23.2.6. Akorn, Inc.
23.2.6.1. Product Portfolio
23.2.6.2. Profitability by Market Segments (Drugs/Channel/Region)
23.2.6.3. Sales Footprint
23.2.6.4. Strategy Overview
23.2.6.4.1. Marketing Strategy
23.2.6.4.2. Product Strategy
23.2.6.4.3. Channel Strategy
23.2.7. Johnson & Johnson, Inc.
23.2.7.1. Product Portfolio
23.2.7.2. Profitability by Market Segments (Drugs/Channel/Region)
23.2.7.3. Sales Footprint
23.2.7.4. Strategy Overview
23.2.7.4.1. Marketing Strategy
23.2.7.4.2. Product Strategy
23.2.7.4.3. Channel Strategy
23.2.8. Thea Pharmaceuticals Limited
23.2.8.1. Product Portfolio
23.2.8.2. Profitability by Market Segments (Drugs/Channel/Region)
23.2.8.3. Sales Footprint
23.2.8.4. Strategy Overview
23.2.8.4.1. Marketing Strategy
23.2.8.4.2. Product Strategy
23.2.8.4.3. Channel Strategy
23.2.9. OASIS Medical
23.2.9.1. Product Portfolio
23.2.9.2. Profitability by Market Segments (Drugs/Channel/Region)
23.2.9.3. Sales Footprint
23.2.9.4. Strategy Overview
23.2.9.4.1. Marketing Strategy
23.2.9.4.2. Product Strategy
23.2.9.4.3. Channel Strategy
23.2.10. Altaire Pharmaceuticals Inc.
23.2.10.1. Product Portfolio
23.2.10.2. Profitability by Market Segments (Drugs/Channel/Region)
23.2.10.3. Sales Footprint
23.2.10.4. Strategy Overview
23.2.10.4.1. Marketing Strategy
23.2.10.4.2. Product Strategy
23.2.10.4.3. Channel Strategy
23.2.11. Boiron USA
23.2.11.1. Product Portfolio
23.2.11.2. Profitability by Market Segments (Drugs/Channel/Region)
23.2.11.3. Sales Footprint
23.2.11.4. Strategy Overview
23.2.11.4.1. Marketing Strategy
23.2.11.4.2. Product Strategy
23.2.11.4.3. Channel Strategy
23.2.12. Similasan Corporation
23.2.12.1. Product Portfolio
23.2.12.2. Profitability by Market Segments (Drugs/Channel/Region)
23.2.12.3. Sales Footprint
23.2.12.4. Strategy Overview
23.2.12.4.1. Marketing Strategy
23.2.12.4.2. Product Strategy
23.2.12.4.3. Channel Strategy
23.2.13. Scope Ophthalmics Ltd.
23.2.13.1. Product Portfolio
23.2.13.2. Profitability by Market Segments (Drugs/Channel/Region)
23.2.13.3. Sales Footprint
23.2.13.4. Strategy Overview
23.2.13.4.1. Marketing Strategy
23.2.13.4.2. Product Strategy
23.2.13.4.3. Channel Strategy
23.2.14. Reckitt Benckiser Group PLC
23.2.14.1. Product Portfolio
23.2.14.2. Profitability by Market Segments (Drugs/Channel/Region)
23.2.14.3. Sales Footprint
23.2.14.4. Strategy Overview
23.2.14.4.1. Marketing Strategy
23.2.14.4.2. Product Strategy
23.2.14.4.3. Channel Strategy
23.2.15. Medicom Healthcare Ltd
23.2.15.1. Product Portfolio
23.2.15.2. Profitability by Market Segments (Drugs/Channel/Region)
23.2.15.3. Sales Footprint
23.2.15.4. Strategy Overview
23.2.15.4.1. Marketing Strategy
23.2.15.4.2. Product Strategy
23.2.15.4.3. Channel Strategy
23.2.16. FDC Limited.
23.2.16.1. Product Portfolio
23.2.16.2. Profitability by Market Segments (Drugs/Channel/Region)
23.2.16.3. Sales Footprint
23.2.16.4. Strategy Overview
23.2.16.4.1. Marketing Strategy
23.2.16.4.2. Product Strategy
23.2.16.4.3. Channel Strategy
23.2.17. Lupin Limited
23.2.17.1. Product Portfolio
23.2.17.2. Profitability by Market Segments (Drugs/Channel/Region)
23.2.17.3. Sales Footprint
23.2.17.4. Strategy Overview
23.2.17.4.1. Marketing Strategy
23.2.17.4.2. Product Strategy
23.2.17.4.3. Channel Strategy
23.2.18. Jamjoom Pharmaceuticals Co.
23.2.18.1. Product Portfolio
23.2.18.2. Profitability by Market Segments (Drugs/Channel/Region)
23.2.18.3. Sales Footprint
23.2.18.4. Strategy Overview
23.2.18.4.1. Marketing Strategy
23.2.18.4.2. Product Strategy
23.2.18.4.3. Channel Strategy
23.2.19. Sentiss Pharma Private limited
23.2.19.1. Product Portfolio
23.2.19.2. Profitability by Market Segments (Drugs/Channel/Region)
23.2.19.3. Sales Footprint
23.2.19.4. Strategy Overview
23.2.19.4.1. Marketing Strategy
23.2.19.4.2. Product Strategy
23.2.19.4.3. Channel Strategy
24. Assumptions and Acronyms Used
25. Research Methodology
Let us know your requirement to get
100% FREE customization
List of Tables
Table 01: Global Dry Eye Syndrome Treatment Market size (US$ Mn) Analysis 2016-2021 and Forecast 2022-2031, By Product
Table 02: Global Dry Eye Syndrome Treatment Market size (US$ Mn) Analysis 2016-2021 and Forecast 2022-2031, By Prescription
Table 03: Global Dry Eye Syndrome Treatment Market size (US$ Mn) Analysis 2016-2021 and Forecast 2022-2031, By Distribution Channel
Table 04: Global Dry Eye Syndrome Treatment Market size (US$ Mn) Analysis 2016-2021 and Forecast 2022-2031, By Region
Table 05: North America Dry Eye Syndrome Treatment Market Size (US$ Mn) Analysis 2016-2021 and Forecast 2022-2031, By Country
Table 06: North America Dry Eye Syndrome Treatment Market Size (US$ Mn) Analysis 2016-2021 and Forecast 2022-2031, By Product
Table 07: North America Dry Eye Syndrome Treatment Volume (000’ Units) Analysis 2016-2021 and Forecast 2022-2031, By Product
Table 08: North America Dry Eye Syndrome Treatment Market Size (US$ Mn) Analysis 2016-2021 and Forecast 2022-2031, By Prescription
Table 09: North America Dry Eye Syndrome Treatment Market Size (US$ Mn) Analysis 2016-2021 and Forecast 2022-2031, By Distribution Channel
Table 10: Latin America Dry Eye Syndrome Treatment Market Size (US$ Mn) Analysis 2016-2021 and Forecast 2022-2031, By Country
Table 11: Latin America Dry Eye Syndrome Treatment Market Size (US$ Mn) Analysis 2016-2021 and Forecast 2022-2031, By Product
Table 12: Latin America Dry Eye Syndrome Treatment Volume (000’ Units) Analysis 2016-2021 and Forecast 2022-2031, By Product
Table 13: Latin America Dry Eye Syndrome Treatment Market Size (US$ Mn) Analysis 2016-2021 and Forecast 2022-2031, By Prescription
Table 14: Latin America Dry Eye Syndrome Treatment Market Size (US$ Mn) Analysis 2016-2021 and Forecast 2022-2031, By Distribution Channel
Table 15: Europe Dry Eye Syndrome Treatment Market Size (US$ Mn) Analysis 2016-2021 and Forecast 2022-2031, By Country
Table 16: Europe Dry Eye Syndrome Treatment Market Size (US$ Mn) Analysis 2016-2021 and Forecast 2022-2031, By Product
Table 17: Europe Dry Eye Syndrome Treatment Volume (000’ Units) Analysis 2016-2021 and Forecast 2022-2031, By Product
Table 18: Europe Dry Eye Syndrome Treatment Market Size (US$ Mn) Analysis 2016-2021 and Forecast 2022-2031, By Prescription
Table 19: Europe Dry Eye Syndrome Treatment Market Size (US$ Mn) Analysis 2016-2021 and Forecast 2022-2031, By Distribution Channel
Table 20: South Asia Dry Eye Syndrome Treatment Market Size (US$ Mn) Analysis 2016-2021 and Forecast 2022-2031, By Country
Table 21: South Asia Dry Eye Syndrome Treatment Market Size (US$ Mn) Analysis 2016-2021 and Forecast 2022-2031, By Product
Table 22: South Asia Dry Eye Syndrome Treatment Volume (000’ Units) Analysis 2016-2021 and Forecast 2022-2031, By Product
Table 23: South Asia Dry Eye Syndrome Treatment Market Size (US$ Mn) Analysis 2016-2021 and Forecast 2022-2031, By Prescription
Table 24: South Asia Dry Eye Syndrome Treatment Market Size (US$ Mn) Analysis 2016-2021 and Forecast 2022-2031, By Distribution Channel
Table 25: East Asia Dry Eye Syndrome Treatment Market Size (US$ Mn) Analysis 2016-2021 and Forecast 2022-2031, By Country
Table 26: East Asia Dry Eye Syndrome Treatment Market Size (US$ Mn) Analysis 2016-2021 and Forecast 2022-2031, By Product
Table 27: East Asia Dry Eye Syndrome Treatment Volume (000’ Units) Analysis 2016-2021 and Forecast 2022-2031, By Product
Table 28: East Asia Dry Eye Syndrome Treatment Market Size (US$ Mn) Analysis 2016-2021 and Forecast 2022-2031, By Prescription
Table 29: East Asia Dry Eye Syndrome Treatment Market Size (US$ Mn) Analysis 2016-2021 and Forecast 2022-2031, By Distribution Channel
Table 30: Oceania Dry Eye Syndrome Treatment Market Size (US$ Mn) Analysis 2016-2021 and Forecast 2022-2031, By Country
Table 31: Oceania Dry Eye Syndrome Treatment Market Size (US$ Mn) Analysis 2016-2021 and Forecast 2022-2031, By Product
Table 32: Oceania Dry Eye Syndrome Treatment Volume (000’ Units) Analysis 2016-2021 and Forecast 2022-2031, By Product
Table 33: Oceania Dry Eye Syndrome Treatment Market Size (US$ Mn) Analysis 2016-2021 and Forecast 2022-2031, By Prescription
Table 34: Oceania Dry Eye Syndrome Treatment Market Size (US$ Mn) Analysis 2016-2021 and Forecast 2022-2031, By Distribution Channel
Table 35: MEA Dry Eye Syndrome Treatment Market Size (US$ Mn) Analysis 2016-2021 and Forecast 2022-2031, By Country
Table 36: MEA Dry Eye Syndrome Treatment Market Size (US$ Mn) Analysis 2016-2021 and Forecast 2022-2031, By Product
Table 37: MEA Dry Eye Syndrome Treatment Volume (000’ Units) Analysis 2016-2021 and Forecast 2022-2031, By Product
Table 38: MEA Dry Eye Syndrome Treatment Market Size (US$ Mn) Analysis 2016-2021 and Forecast 2022-2031, By Prescription
Table 39: MEA Dry Eye Syndrome Treatment Market Size (US$ Mn) Analysis 2016-2021 and Forecast 2022-2031, By Distribution Channel
Find your sweet spots for generating winning opportunities in this market.
Talk to AnalystList of Charts
Figure 01: Global Dry Eye Syndrome Treatment Market Volume Analysis (000’ Units), 2016-2021
Figure 02: Dry Eye Syndrome Treatment Market Volume Forecast (000’ Units), 2022-2031
Figure 03: Cyclosporine Pricing Analysis (US$) for Per Unit (Per pack of 60 0.4 ml vials), By Region, 2021
Figure 04: Topical Corticosteroids Pricing Analysis (US$) for Per Unit (Per 5ml bottle), By Region, 2021
Figure 05: Artificial Tears Pricing Analysis (US$) for Per Unit (Per pack of 15 ml), By Region, 2021
Figure 06: Removable Punctal Plugs Pricing Analysis (US$) for Per Unit (Per pack of one pair), By Region, 2021
Figure 07: Dissolvable Punctal Plugs Pricing Analysis (US$) for Per Unit (Per pack of one pair), By Region, 2021
Figure 08: Oral Omega Supplements Corticosteroids Pricing Analysis (US$) for Per Unit (Per pack of 120 capsules), By Region, 2021
Figure 09: Global Dry Eye Syndrome Treatment Market Demand (in Value or Size in US$ Mn) Analysis 2016-2021 and Forecast, 2022-2031
Figure 10: Global Dry Eye Syndrome Treatment Market Value (US$ Mn), 2016-2021
Figure 11: Global Dry Eye Syndrome Treatment Market Absolute $ Opportunity (US$ Mn), 2021-2031
Figure 12: Global Dry Eye Syndrome Treatment Market Share Analysis (%) By Product, 2022 & 2031
Figure 13: Global Dry Eye Syndrome Treatment Market Y-o-Y Growth (%) By Product, 2021-2031
Figure 14: Global Dry Eye Syndrome Treatment Market Attractiveness Analysis, By Product, 2022-2031
Figure 15: Global Dry Eye Syndrome Treatment Market Share Analysis (%) By Prescription, 2022 & 2031
Figure 16: Global Dry Eye Syndrome Treatment Market Y-o-Y Growth (%) By Prescription, 2021-2031
Figure 17: Global Dry Eye Syndrome Treatment Market Attractiveness Analysis, By Prescription, 2022-2031
Figure 18: Global Dry Eye Syndrome Treatment Market Share Analysis (%) By Distribution Channel, 2022 & 2031
Figure 19: Global Dry Eye Syndrome Treatment Market Y-o-Y Growth (%) By Distribution Channel, 2021-2031
Figure 20: Global Dry Eye Syndrome Treatment Market Attractiveness Analysis, By Distribution Channel, 2022-2031
Figure 21: Global Dry Eye Syndrome Treatment Market Share Analysis (%) By Region, 2022 & 2031
Figure 22: Global Dry Eye Syndrome Treatment Market Y-o-Y Growth (%) By Region, 2021-2031
Figure 23: Global Dry Eye Syndrome Treatment Market Attractiveness Analysis, By Region, 2022-2031
Figure 24: North America Dry Eye Syndrome Treatment Market Size (US$ Mn) Analysis, 2016-2021
Figure 25: North America Dry Eye Syndrome Treatment Market Size (US$ Mn) & Y-o-Y Growth (%), 2021-2031
Figure 26: North America Dry Eye Syndrome Treatment Market Attractiveness Analysis, By Product
Figure 27: North America Dry Eye Syndrome Treatment Market Attractiveness Analysis, By Prescription
Figure 28: North America Dry Eye Syndrome Treatment Market Attractiveness Analysis, By Distribution Channel
Figure 29: North America Dry Eye Syndrome Treatment Market Attractiveness Analysis, By Country
Figure 30: Latin America Dry Eye Syndrome Treatment Market Size (US$ Mn) Analysis, 2016-2021
Figure 31: Latin America Dry Eye Syndrome Treatment Market Size (US$ Mn) & Y-o-Y Growth (%), 2021-2031
Figure 32: Latin America Dry Eye Syndrome Treatment Market Attractiveness Analysis, By Product
Figure 33: Latin America Dry Eye Syndrome Treatment Market Attractiveness Analysis, By Prescription
Figure 34: Latin America Dry Eye Syndrome Treatment Market Attractiveness Analysis, By Distribution Channel
Figure 35: Latin America Dry Eye Syndrome Treatment Market Attractiveness Analysis, By Country
Figure 36: Europe Dry Eye Syndrome Treatment Market Size (US$ Mn) Analysis, 2016-2021
Figure 37: Europe Dry Eye Syndrome Treatment Market Size (US$ Mn) & Y-o-Y Growth (%), 2021-2031
Figure 38: Europe Dry Eye Syndrome Treatment Market Attractiveness Analysis, By Product
Figure 39: Europe Dry Eye Syndrome Treatment Market Attractiveness Analysis, By Prescription
Figure 40: Europe Dry Eye Syndrome Treatment Market Attractiveness Analysis, By Distribution Channel
Figure 41: Europe Dry Eye Syndrome Treatment Market Attractiveness Analysis, By Country
Figure 42: South Asia Dry Eye Syndrome Treatment Market Size (US$ Mn) Analysis, 2016-2021
Figure 43: South Asia Dry Eye Syndrome Treatment Market Size (US$ Mn) & Y-o-Y Growth (%), 2021-2031
Figure 44: South Asia Dry Eye Syndrome Treatment Market Attractiveness Analysis, By Product
Figure 45: South Asia Dry Eye Syndrome Treatment Market Attractiveness Analysis, By Prescription
Figure 46: South Asia Dry Eye Syndrome Treatment Market Attractiveness Analysis, By Distribution Channel
Figure 47: South Asia Dry Eye Syndrome Treatment Market Attractiveness Analysis, By Country
Figure 48: East Asia Dry Eye Syndrome Treatment Market Size (US$ Mn) Analysis, 2016-2021
Figure 49: East Asia Dry Eye Syndrome Treatment Market Size (US$ Mn) & Y-o-Y Growth (%), 2021-2031
Figure 50: East Asia Dry Eye Syndrome Treatment Market Attractiveness Analysis, By Product
Figure 51: East Asia Dry Eye Syndrome Treatment Market Attractiveness Analysis, By Prescription
Figure 52: East Asia Dry Eye Syndrome Treatment Market Attractiveness Analysis, By Distribution Channel
Figure 53: East Asia Dry Eye Syndrome Treatment Market Attractiveness Analysis, By Country
Figure 54: Oceania Dry Eye Syndrome Treatment Market Size (US$ Mn) Analysis, 2016-2021
Figure 55: Oceania Dry Eye Syndrome Treatment Market Size (US$ Mn) & Y-o-Y Growth (%), 2021-2031
Figure 56: Oceania Dry Eye Syndrome Treatment Market Attractiveness Analysis, By Product
Figure 57: Oceania Dry Eye Syndrome Treatment Market Attractiveness Analysis, By Prescription
Figure 58: Oceania Dry Eye Syndrome Treatment Market Attractiveness Analysis, By Distribution Channel
Figure 59: Oceania Dry Eye Syndrome Treatment Market Attractiveness Analysis, By Country
Figure 60: MEA Dry Eye Syndrome Treatment Market Size (US$ Mn) Analysis, 2016-2021
Figure 61: MEA Dry Eye Syndrome Treatment Market Size (US$ Mn) & Y-o-Y Growth (%), 2021-2031
Figure 62: MEA Dry Eye Syndrome Treatment Market Attractiveness Analysis, By Product
Figure 63: MEA Dry Eye Syndrome Treatment Market Attractiveness Analysis, By Prescription
Figure 64: MEA Dry Eye Syndrome Treatment Market Attractiveness Analysis, By Distribution Channel
Figure 65: MEA Dry Eye Syndrome Treatment Market Attractiveness Analysis, By Country
Figure 66: U.S. Dry Eye Syndrome Treatment Market Share Analysis (%), by Product, 2022 & 2031
Figure 67: U.S. Dry Eye Syndrome Treatment Market Share Analysis (%), by Prescription, 2022 & 2031
Figure 68: U.S. Dry Eye Syndrome Treatment Market Share Analysis (%), by Distribution Channel, 2022 & 2031
Figure 69: U.S. Dry Eye Syndrome Treatment Market Value Analysis (US$ Mn), 2022 & 2031
Figure 70: Canada Dry Eye Syndrome Treatment Market Share Analysis (%), by Product, 2022 & 2031
Figure 71: Canada Dry Eye Syndrome Treatment Market Share Analysis (%), by Prescription, 2022 & 2031
Figure 72: Canada Dry Eye Syndrome Treatment Market Share Analysis (%), by Distribution Channel, 2022 & 2031
Figure 73: Canada Dry Eye Syndrome Treatment Market Value Analysis (US$ Mn), 2022 & 2031
Figure 74: Brazil Dry Eye Syndrome Treatment Market Share Analysis (%), by Product, 2022 & 2031
Figure 75: Brazil Dry Eye Syndrome Treatment Market Share Analysis (%), by Prescription, 2022 & 2031
Figure 76: Brazil Dry Eye Syndrome Treatment Market Share Analysis (%), by Distribution Channel, 2022 & 2031
Figure 77: Brazil Dry Eye Syndrome Treatment Market Value Analysis (US$ Mn), 2022 & 2031
Figure 78: Mexico Dry Eye Syndrome Treatment Market Share Analysis (%), by Product, 2022 & 2031
Figure 79: Mexico Dry Eye Syndrome Treatment Market Share Analysis (%), by Prescription, 2022 & 2031
Figure 80: Mexico Dry Eye Syndrome Treatment Market Share Analysis (%), by Distribution Channel, 2022 & 2031
Figure 81: Mexico Dry Eye Syndrome Treatment Market Value Analysis (US$ Mn), 2022 & 2031
Figure 82: U.K. Dry Eye Syndrome Treatment Market Share Analysis (%), by Product, 2022 & 2031
Figure 83: U.K. Dry Eye Syndrome Treatment Market Share Analysis (%), by Prescription, 2022 & 2031
Figure 84: U.K. Dry Eye Syndrome Treatment Market Share Analysis (%), by Distribution Channel, 2022 & 2031
Figure 85: U.K. Dry Eye Syndrome Treatment Market Value Analysis (US$ Mn), 2022 & 2031
Figure 86: Germany Dry Eye Syndrome Treatment Market Share Analysis (%), by Product, 2022 & 2031
Figure 87: Germany Dry Eye Syndrome Treatment Market Share Analysis (%), by Prescription, 2022 & 2031
Figure 88: Germany Dry Eye Syndrome Treatment Market Share Analysis (%), by Distribution Channel, 2022 & 2031
Figure 89: Germany Dry Eye Syndrome Treatment Market Value Analysis (US$ Mn), 2022 & 2031
Figure 90: France Dry Eye Syndrome Treatment Market Share Analysis (%), by Product, 2022 & 2031
Figure 91: France Dry Eye Syndrome Treatment Market Share Analysis (%), by Prescription, 2022 & 2031
Figure 92: France Dry Eye Syndrome Treatment Market Share Analysis (%), by Distribution Channel, 2022 & 2031
Figure 93: France Dry Eye Syndrome Treatment Market Value Analysis (US$ Mn), 2022 & 2031
Figure 94: Italy Dry Eye Syndrome Treatment Market Share Analysis (%), by Product, 2022 & 2031
Figure 95: Italy Dry Eye Syndrome Treatment Market Share Analysis (%), by Prescription, 2022 & 2031
Figure 96: Italy Dry Eye Syndrome Treatment Market Share Analysis (%), by Distribution Channel, 2022 & 2031
Figure 97: Italy Dry Eye Syndrome Treatment Market Value Analysis (US$ Mn), 2022 & 2031
Figure 98: Spain Dry Eye Syndrome Treatment Market Share Analysis (%), by Product, 2022 & 2031
Figure 99: Spain Dry Eye Syndrome Treatment Market Share Analysis (%), by Prescription, 2022 & 2031
Figure 100: Spain Dry Eye Syndrome Treatment Market Share Analysis (%), by Distribution Channel, 2022 & 2031
Figure 101: Spain Dry Eye Syndrome Treatment Market Value Analysis (US$ Mn), 2022 & 2031
Figure 102: Russia Dry Eye Syndrome Treatment Market Share Analysis (%), by Product, 2022 & 2031
Figure 103: Russia Dry Eye Syndrome Treatment Market Share Analysis (%), by Prescription, 2022 & 2031
Figure 104: Russia Dry Eye Syndrome Treatment Market Share Analysis (%), by Distribution Channel, 2022 & 2031
Figure 105: Russia Dry Eye Syndrome Treatment Market Value Analysis (US$ Mn), 2022 & 2031
Figure 106: Poland Dry Eye Syndrome Treatment Market Share Analysis (%), by Product, 2022 & 2031
Figure 107: Poland Dry Eye Syndrome Treatment Market Share Analysis (%), by Prescription, 2022 & 2031
Figure 108: Poland Dry Eye Syndrome Treatment Market Share Analysis (%), by Distribution Channel, 2022 & 2031
Figure 109: Poland Dry Eye Syndrome Treatment Market Value Analysis (US$ Mn), 2022 & 2031
Figure 110: Japan Dry Eye Syndrome Treatment Market Share Analysis (%), by Product, 2022 & 2031
Figure 111: Japan Dry Eye Syndrome Treatment Market Share Analysis (%), by Prescription, 2022 & 2031
Figure 112: Japan Dry Eye Syndrome Treatment Market Share Analysis (%), by Distribution Channel, 2022 & 2031
Figure 113: Japan Dry Eye Syndrome Treatment Market Value Analysis (US$ Mn), 2022 & 2031
Figure 114: China Dry Eye Syndrome Treatment Market Share Analysis (%), by Product, 2022 & 2031
Figure 115: China Dry Eye Syndrome Treatment Market Share Analysis (%), by Prescription, 2022 & 2031
Figure 116: China Dry Eye Syndrome Treatment Market Share Analysis (%), by Distribution Channel, 2022 & 2031
Figure 117: China Dry Eye Syndrome Treatment Market Value Analysis (US$ Mn), 2022 & 2031
Figure 118: South Korea Dry Eye Syndrome Treatment Market Share Analysis (%), by Product, 2022 & 2031
Figure 119: South Korea Dry Eye Syndrome Treatment Market Share Analysis (%), by Prescription, 2022 & 2031
Figure 120: South Korea Dry Eye Syndrome Treatment Market Share Analysis (%), by Distribution Channel, 2022 & 2031
Figure 121: South Korea Dry Eye Syndrome Treatment Market Value Analysis (US$ Mn), 2022 & 2031
Figure 122: India Dry Eye Syndrome Treatment Market Share Analysis (%), by Product, 2022 & 2031
Figure 123: India Dry Eye Syndrome Treatment Market Share Analysis (%), by Prescription, 2022 & 2031
Figure 124: India Dry Eye Syndrome Treatment Market Share Analysis (%), by Distribution Channel, 2022 & 2031
Figure 125: India Dry Eye Syndrome Treatment Market Value Analysis (US$ Mn), 2022 & 2031
Figure 126: Thailand Dry Eye Syndrome Treatment Market Share Analysis (%), by Product, 2022 & 2031
Figure 127: Thailand Dry Eye Syndrome Treatment Market Share Analysis (%), by Prescription, 2022 & 2031
Figure 128: Thailand Dry Eye Syndrome Treatment Market Share Analysis (%), by Distribution Channel, 2022 & 2031
Figure 129: Thailand Dry Eye Syndrome Treatment Market Value Analysis (US$ Mn), 2022 & 2031
Figure 130: Indonesia Dry Eye Syndrome Treatment Market Share Analysis (%), by Product, 2022 & 2031
Figure 131: Indonesia Dry Eye Syndrome Treatment Market Share Analysis (%), by Prescription, 2022 & 2031
Figure 132: Indonesia Dry Eye Syndrome Treatment Market Share Analysis (%), by Distribution Channel, 2022 & 2031
Figure 133: Indonesia Dry Eye Syndrome Treatment Market Value Analysis (US$ Mn), 2022 & 2031
Figure 134: Malaysia Dry Eye Syndrome Treatment Market Share Analysis (%), by Product, 2022 & 2031
Figure 135: Malaysia Dry Eye Syndrome Treatment Market Share Analysis (%), by Prescription, 2022 & 2031
Figure 136: Malaysia Dry Eye Syndrome Treatment Market Share Analysis (%), by Distribution Channel, 2022 & 2031
Figure 137: Malaysia Dry Eye Syndrome Treatment Market Value Analysis (US$ Mn), 2022 & 2031
Figure 138: Vietnam Dry Eye Syndrome Treatment Market Share Analysis (%), by Product, 2022 & 2031
Figure 139: Vietnam Dry Eye Syndrome Treatment Market Share Analysis (%), by Prescription, 2022 & 2031
Figure 140: Vietnam Dry Eye Syndrome Treatment Market Share Analysis (%), by Distribution Channel, 2022 & 2031
Figure 141: Vietnam Dry Eye Syndrome Treatment Market Value Analysis (US$ Mn), 2022 & 2031
Figure 142: Australia Dry Eye Syndrome Treatment Market Share Analysis (%), by Product, 2022 & 2031
Figure 143: Australia Dry Eye Syndrome Treatment Market Share Analysis (%), by Prescription, 2022 & 2031
Figure 144: Australia Dry Eye Syndrome Treatment Market Share Analysis (%), by Distribution Channel, 2022 & 2031
Figure 145: Australia Dry Eye Syndrome Treatment Market Value Analysis (US$ Mn), 2022 & 2031
Figure 146: New Zealand Dry Eye Syndrome Treatment Market Share Analysis (%), by Product, 2022 & 2031
Figure 147: New Zealand Dry Eye Syndrome Treatment Market Share Analysis (%), by Prescription, 2022 & 2031
Figure 148: New Zealand Dry Eye Syndrome Treatment Market Share Analysis (%), by Distribution Channel, 2022 & 2031
Figure 149: New Zealand Dry Eye Syndrome Treatment Market Value Analysis (US$ Mn), 2022 & 2031
Figure 150: GCC Countries Dry Eye Syndrome Treatment Market Share Analysis (%), by Product, 2022 & 2031
Figure 151: GCC Countries Dry Eye Syndrome Treatment Market Share Analysis (%), by Prescription, 2022 & 2031
Figure 152: GCC Countries Dry Eye Syndrome Treatment Market Share Analysis (%), by Distribution Channel, 2022 & 2031
Figure 153: GCC Countries Dry Eye Syndrome Treatment Market Value Analysis (US$ Mn), 2022 & 2031
Figure 154: South Africa Dry Eye Syndrome Treatment Market Share Analysis (%), by Product, 2022 & 2031
Figure 155: South Africa Dry Eye Syndrome Treatment Market Share Analysis (%), by Prescription, 2022 & 2031
Figure 156: South Africa Dry Eye Syndrome Treatment Market Share Analysis (%), by Distribution Channel, 2022 & 2031
Figure 157: South Africa Dry Eye Syndrome Treatment Market Value Analysis (US$ Mn), 2022 & 2031
Need specific information?
Request CustomizationExplore Healthcare Insights
View Reports