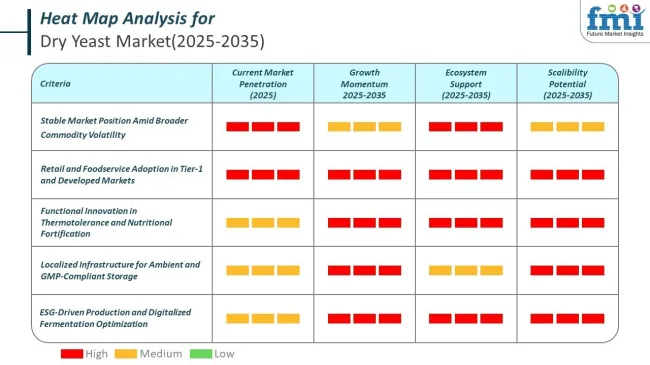
Dry Yeast Market Size and Share Forecast Outlook 2025 to 2035

The dry yeast market is expected to post healthy growth, reaching roughly USD 110.3 billion by 2035 from about USD 54 billion in 2025, at a CAGR of 7.4%. Growth will be driven by rising demand for processed bakery items, convenient snack formats, and fermented beverages.

Robust leavening capabilities, long shelf life, and easy storage have positioned dry yeast as a preferred ingredient across foodservice and retail sectors. Momentum is being reinforced by clean-label reformulations and the introduction of non-GMO, organic, and gluten-free variants that cater to evolving dietary preferences.
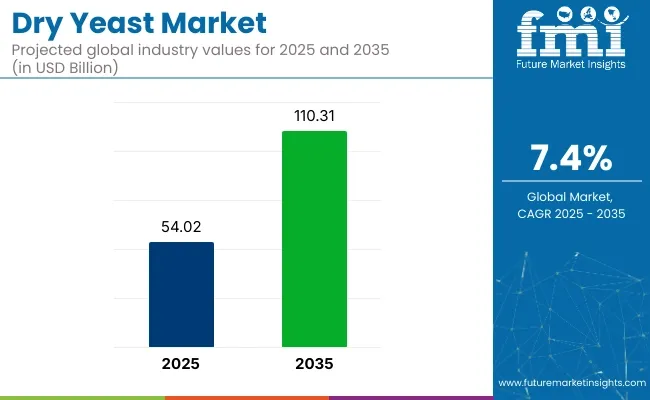
Quick Stats of Dry Yeast Market

  • Market Value (2025): USD 54 billion
  • Forecast Value (2035): USD 110.3 billion
  • Forecast CAGR (2025 to 2035): 7.4%
  • Leading Segment by Product Type in 2025: Active Dry Yeast (53% share)
  • Key Players: Kerry Group, Bio Springer S.A, Koninklijke DSM N.V., Lallemand Inc, Angel Yeast Co., Ltd, and Associated British Foods Plc

Dry Yeast Market

Metric Value
Industry Size (2025E) USD 54 billion
Industry Value (2035F) USD 110.3 billion
CAGR (2025 to 2035) 7.4%

The United States is projected to maintain the largest share of the dry yeast market through 2035, benefiting from sustained bread and beer consumption. China is likely to register the fastest absolute growth, supported by large-scale bakery expansion and a flourishing craft-brew scene. Europe’s demand is expected to be strengthened by clean-label trends and heightened interest in artisanal baked goods.

According to the Confederation of EU Yeast Producers (COFALEC) 2024 bulletin, investments in high-efficiency fermentation processes and non-GMO strains were stepped up across member countries, signaling regulatory and industry alignment toward safe, traceable yeast supply chains.

As global dietary habits continue to pivot toward convenience and wellness, steady advances in yeast technology, diversified application bases, and supportive regulatory frameworks are expected to underpin the dry yeast market’s robust outlook over the next decade.

It is anticipated that the dry yeast market will enter a phase of accelerated diversification, with precision-engineered strains being rolled out to improve fermentation efficiency in next-generation bakery, beverage, and bio-industrial lines. Product portfolios are expected to shift toward clean-label, non-GMO, and allergen-friendly variants that satisfy stricter regulatory thresholds and rising consumer scrutiny.

Analyzing Dry Yeast Market by Top Investment Segments

The market is segmented based on product type, form, base, nature, and region. By product type, the market is divided into active dry yeast and inactive dry yeast. In terms of form, it is segmented into powder and flakes. Based on base, the market is categorized into fortified and unfortified variants.

By nature, the market includes organic and conventional dry yeast. Regionally, the market is classified into North America, Latin America, Western Europe, Eastern Europe, South Asia and Pacific, East Asia, and the Middle East and Africa.

By Base, Unfortified Segment to Continue Dominance with 79.1% Market Share in 2025

The unfortified segment is projected to lead the dry yeast market in 2025, accounting for a substantial 79.1% share. This segment’s strength lies in its appeal to consumers who seek natural, clean-label food ingredients without synthetic additives or enrichment. Unfortified dry yeast is highly favored in baking, brewing, and snack production, where purity and authenticity of ingredients are valued.

Its versatility allows it to integrate easily across a variety of culinary applications, from artisan bread to savory snacks, supporting demand from both food manufacturers and end consumers. The segment is also buoyed by the growing demand for vegan and vegetarian-friendly ingredients, as unfortified yeast is often free from allergens, gluten, and added nutrients.

Meanwhile, the fortified segment caters to niche health-conscious consumers seeking added vitamins, particularly B-complex, but is witnessing comparatively slower adoption in mainstream food production. This segment accounts for 20.9% share.

Leading companies are emphasizing unfortified offerings in their product lines, responding to rising demand for transparency and ingredient simplicity. As health trends and dietary awareness continue to influence purchase decisions, the unfortified segment is expected to maintain its stronghold in the dry yeast market from 2025 to 2035.

Base Share (2025)
Unfortified 79.1%
Fortified 20.9%

By Nature, Conventional Segment to Hold Leadership with 95.9% Share in 2025

The conventional segment is expected to dominate the dry yeast market in 2025 with a projected market share of 95.9%. This share reflects continued consumer trust in traditionally processed food ingredients, particularly in bakery and brewing sectors where familiarity, consistency, and cost-effectiveness are key. Conventional dry yeast is produced without GMOs or synthetic additives, aligning with growing preferences for naturally derived, minimally processed food items.

It is widely adopted by commercial bakeries, packaged food brands, and household consumers due to its established performance and reliability in fermentation processes. Although organic yeast has seen growing interest, it remains limited by higher production costs, certification challenges, and narrower distribution channels. Consequently, organic dry yeast continues to serve a niche audience, mostly in premium health food markets and specialty product segments.

The organic segment occupies 4.1% market share. Market leaders such as Lallemand, Lesaffre, and Angel Yeast have a strong presence in the conventional segment, supporting its scale through robust global supply chains. As inflationary pressures influence cost-sensitive markets and consumers seek stable ingredient sources, the conventional segment is likely to maintain its dominance well during the forecast period.
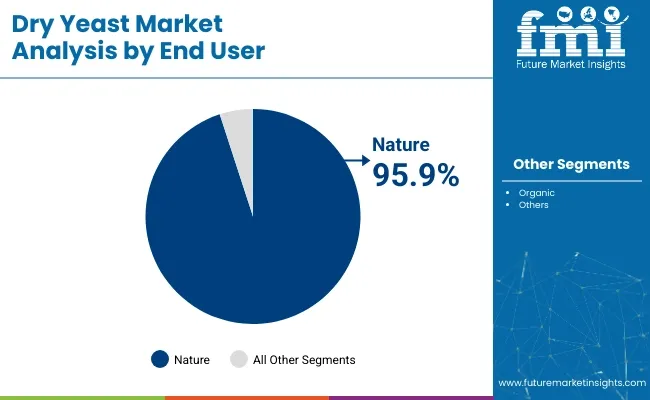
Dry Yeast Market Analysis By End User

Nature Share (2025)
Conventional 95.9%
Organic 4.1%

By Form, Powder Segment to Grow at 5.2% CAGR from 2025 to 2035

The powder segment of the dry yeast market is anticipated to grow at a CAGR of 5.2% from 2025 to 2035 and holds 78% share, emerging as a key driver of long-term market expansion. Powdered dry yeast is widely used in both commercial and domestic settings for its extended shelf life, easy storage, and efficient rehydration capabilities.

Its convenience and compatibility with automated baking processes make it highly preferred in the packaged food, snacks, and ready-mix bakery industries. As manufacturers aim to streamline operations and reduce waste, powdered yeast becomes an optimal choice for consistent leavening and fermentation across large production batches. The segment is further bolstered by increased demand for home baking, plant-based foods, and meat alternatives, where powdered yeast plays a vital role in flavor development and texture.

While flake-form yeast is gaining niche popularity for its use as a seasoning and nutritional enhancer, it remains more common in retail and health food channels. With expanding food processing industries in Asia Pacific, Latin America, and Eastern Europe, powdered yeast is expected to maintain steady global traction. Its affordability, ease of transport, and high yield per gram ensure sustained demand over the forecast period. Moreover, the liquid segment accounts for 22% share.
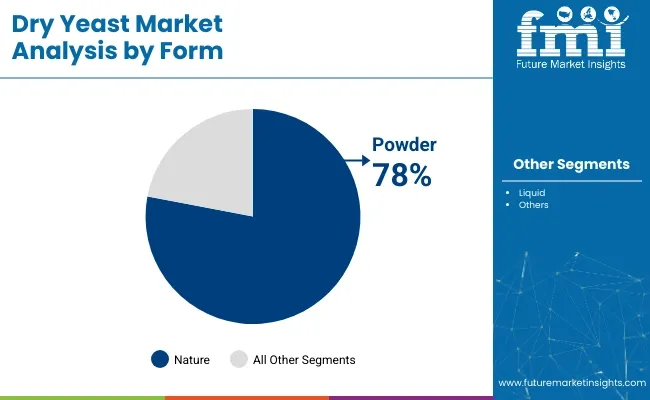
Dry Yeast Market Analysis By Form

Form Share (2025)
Powder 78%
Liquid 22%

By Product Type, Active Dry Yeast Segment to Expand at CAGR of 5.6% from 2025 to 2035

The active dry yeast segment is forecasted to grow at a CAGR of 5.6% from 2025 to 2035 and holds 68% share, fueled by consistent demand across the baking, brewing, and food service sectors. Active dry yeast is widely used due to its strong fermentation activity, ease of storage, and extended shelf life compared to fresh yeast.

It is particularly favored in commercial and home baking applications where reliable rising and dough conditioning are essential. The resurgence of artisanal baking, along with increased consumer interest in home cooking and traditional fermentation methods, is contributing to steady growth in this segment. Its granular format allows for simplified dosing and handling, making it a practical option for both industrial bakeries and small-scale users.

While inactive dry yeast is gaining attention as a nutritional supplement and seasoning due to its high vitamin B content and umami flavor, it remains niche compared to the broad application base of active dry yeast. It holds 32% market share. Manufacturers are also innovating within the active yeast category by offering instant and rapid-rise variants to enhance convenience. As food processing expands across emerging economies, active dry yeast will remain a staple input across a variety of baking and fermented food applications.
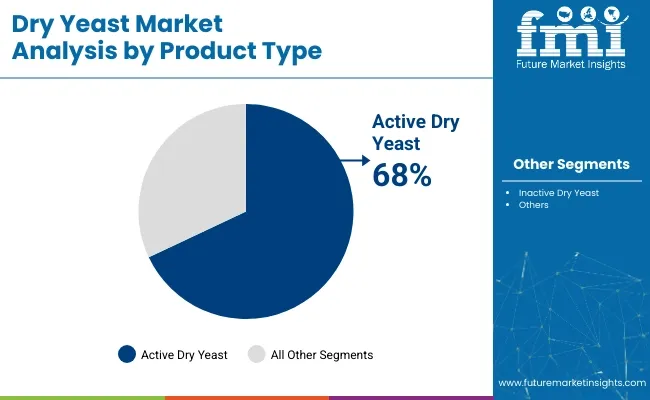
Dry Yeast Market Analysis By Product Type

Product Type Share (2025)
Active Dry Yeast 68%
Inactive Dry Yeast 32%

Dry Yeast Market Drivers

  • Growing demand from the bakery, brewing, and wine-making industries.
  • Increasing popularity of convenience foods and baked goods.
  • Advancements in food processing technologies.
  • Surge in consumer preference for natural and clean-label ingredients.

Dry Yeast Market Challenges

  • Disruptions in the supply chain, such as transportation delays or logistical issues, can affect the timely delivery of dry yeast products to customers.
  • Maintaining consistent quality standards throughout the production process is crucial, as variations in quality can impact the performance of dry yeast in various applications.
  • Compliance with regulations and standards related to food safety and labeling adds complexity and cost to producing and distributing dry yeast products.
  • Sustainability and environmental impact are growing concerns for consumers and regulators, prompting companies to adopt eco-friendly practices.

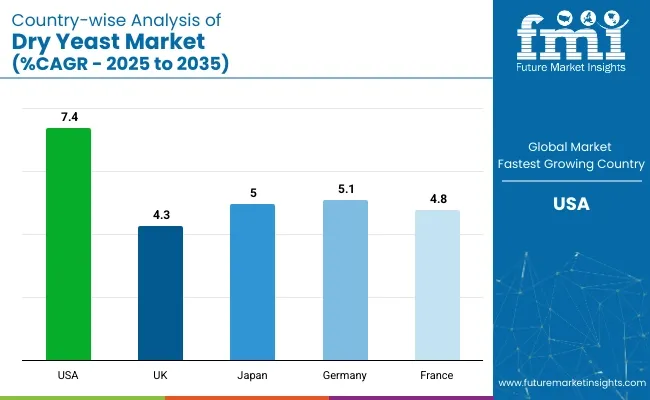
Dry Yeast Market Analyzed by Top Countries

Country-wise Analysis Of Dry Yeast Market

Countries Estimated CAGR (2025 to 2035)
USA 7.4%
UK 4.3%
Japan 5.0%
Germany 5.1%
France 4.8%

United States

The USA dry yeast market is estimated to grow at a 7.4% CAGR during the study period, driven by increasing demand for baked goods and convenient food products. Dry yeast is a vital ingredient in bread, pastries, and cakes, which are staples in the American diet. During the COVID-19 pandemic, home baking surged, significantly boosting retail yeast sales, a trend that has continued.

For example, busy households now prefer dry yeast for its long shelf life and ease of use. Additionally, the shift toward plant-based diets has increased the consumption of yeast-derived products like nutritional yeast, which is rich in B vitamins. These combined trends are encouraging manufacturers to expand production and innovate in dry yeast formulations.

United Kingdom

The UK dry yeast market is estimated to grow at a 4.3% CAGR during the study period, supported by increased home baking and a rising preference for organic food products. The COVID-19 lockdowns sparked a revival in home cooking, especially bread-making, which significantly boosted yeast consumption. For example, supermarkets reported temporary shortages as demand soared.

This momentum has continued post-pandemic, with consumers seeking natural, high-quality baking ingredients. Dry yeast’s versatility and long shelf life make it a preferred product in UK households. Additionally, the growth of artisanal and gluten-free baking trends is prompting food companies to innovate yeast-based product lines that cater to evolving dietary preferences.

Japan

The Japanese dry yeast market is estimated to grow at a 5.0% CAGR during the study period, reflecting the rising demand for Western-style baked goods and savory seasonings derived from yeast. Japan’s affinity for culinary innovation and quality ingredients has led to broader uses of dry yeast, from traditional breads to Japanese-style baked goods and umami seasonings.

For example, yeast extract is a popular component in ramen broths and sauces. Health-conscious consumers are also turning to nutritional yeast as a plant-based source of B vitamins. Additionally, Japan’s aging population is fostering demand for easily digestible and nutrient-rich food, pushing dry yeast consumption both in the retail and foodservice sectors.

Germany

The German dry yeast market is estimated to grow at a 5.1% CAGR during the study period, largely influenced by its strong traditions in baking and brewing. Dry yeast is integral to both artisan bread-making and the beer industry, particularly under Germany’s Reinheitsgebot or Beer Purity Law. For example, traditional German sourdough and rye breads heavily rely on consistent yeast fermentation.

The growth of home baking and microbrewing has fueled retail demand for high-quality dry yeast. Additionally, Germany's health-conscious consumers are increasingly interested in clean-label and organic food ingredients, prompting the development of non-GMO and preservative-free dry yeast options in the market.

France

The French dry yeast market is estimated to grow at a 4.8% CAGR during the study period, thanks to its deep-rooted culture of baking and growing interest in organic and artisanal products. French households are known for their consumption of bread and viennoiseries, which rely heavily on quality yeast. For example, bakers across France continue to favor dry yeast for its reliability and shelf life.

The surge in home baking, especially during and after the pandemic, has further strengthened this trend. Moreover, the expanding demand for natural and sustainable food ingredients is encouraging innovation in yeast production, including gluten-free and fortified dry yeast formulations aimed at the health-conscious French consumer.

Competitive Landscape

The global dry yeast industry is organised around a small circle of tier-1 producers, Lesaffre, AB Mauri, Angel Yeast, and Lallemand, supported by a wider group of tier-2 specialists such as Chr. Hansen, Pakmaya, Alltech, DSM-Firmenich, Kothari Yeast, and Guangxi Forise.

Production footprints have been expanded across Europe, North America, and China, while new capacity has been commissioned in Brazil, Vietnam, and Egypt to shorten logistics chains and hedge currency risk. Strategic focus has been placed on bio-innovation; suppliers have channelled R-and-D funds into non-GMO, organic, and gluten-free strains that deliver faster proofing and cleaner flavour profiles.

Cost leadership is being maintained through high-efficiency fermenters and energy-recovery loops, yet premiumization is being pursued in parallel via nutrient-enriched and probiotic-fortified formats that address health-centric demand.

Consolidation has been favoured over fragmentation. Cross-licensing agreements between yeast makers and enzyme developers have been signed so that combined starter cultures can be offered to industrial bakers seeking consistent dough rheology. Digital fermentation controls powered by AI are being piloted, allowing plants to reduce batch-to-batch variation and to cut waste water volumes. Collaboration with brewery groups has intensified; several global lager brands have locked in long-term supply contracts to secure instant dry yeast lines engineered for low-temperature fermentation.

Recent Industry News

  • In October 2024, Lesaffre acquired a 70% majority stake in Biorigin, a business unit of Zilor, to enhance its supply of yeast derivatives for savory ingredients and expand its global reach in the yeast market.
  • In June 2024, DSM-Firmenich announced the sale of its yeast extract business to Lesaffre as part of a strategic portfolio realignment, with the deal expected to close by the end of 2024.

Key Coverage of Dry Yeast Market Report

  • Adjacent Study on Dry Yeast Market Basket, Baker’s Yeast Market, Dry Wine Yeast Market
  • Opportunity Analysis of Dry Yeast Wholesale Market
  • Dry Yeast Price Fluctuations
  • Demand for Instant Dry Yeast in the United States
  • Dry Yeast Market Size, Current Insights and Demographic Trends

Scope of Report on Dry Yeast Market

Attribute Details
Current Total Market Size (2025) USD 54 billion
Projected Market Size (2035) USD 110.3 billion
CAGR (2025 to 2035) 7.4%
Base Year for Estimation 2024
Historical Period 2020 to 2024
Projections Period 2025 to 2035
Report Parameter USD billion for value
By Product Type Active Dry Yeast and Inactive Dry Yeast
By Form Powder and Flakes
By Base Fortified and Unfortified
By Nature Organic and Conventional
Regions Covered North America, Latin America, Western Europe, Eastern Europe, South Asia and Pacific, East Asia, Middle East and Africa
Countries Covered United States, United Kingdom, France, Germany, Japan
Key Players Kerry Group, Bio Springer S.A, Koninklijke DSM N.V., Lallemand Inc, Sensient Technologies Corporation, Leiber GmbH, KOHJIN Life Science Co., Ltd, Angel Yeast Co., Ltd, Titan Biotech Ltd, Associated British Foods Plc
Additional Attributes Dollar sales by value, market share analysis by region, and country-wise analysis

Key Segments

By Product Type:

  • Active Dry Yeast
  • Inactive Dry Yeast

By Form:

  • Powder
  • Flakes

By Base:

  • Fortified
  • Unfortified

By Nature:

  • Organic
  • Conventional

By Region:

  • North America
  • Latin America
  • Western Europe
  • Eastern Europe
  • South Asia and Pacific
  • East Asia
  • Middle East and Africa

Table of Content

  • 1. Executive Summary
  • 2. Market Overview
  • 3. Market Background
  • 4. Global Market Analysis 2020 to 2024 and Forecast, 2025 to 2035
  • 5. Global Market Analysis 2020 to 2024 and Forecast 2025 to 2035, By Product Type
    • 5.1. Active Dry Yeast
    • 5.2. Inactive Dry Yeast
  • 6. Global Market Analysis 2020 to 2024 and Forecast 2025 to 2035, By Form
    • 6.1. Powder
    • 6.2. Flakes
  • 7. Global Market Analysis 2020 to 2024 and Forecast 2025 to 2035, By Base
    • 7.1. Fortified
    • 7.2. Unfortified
  • 8. Global Market Analysis 2020 to 2024 and Forecast 2025 to 2035, By Nature
    • 8.1. Organic
    • 8.2. Conventional
  • 9. Global Market Analysis 2020 to 2024 and Forecast 2025 to 2035, By Region
    • 9.1. North America
    • 9.2. Latin America
    • 9.3. Western Europe
    • 9.4. Eastern Europe
    • 9.5. South Asia and Pacific
    • 9.6. East Asia
    • 9.7. Middle East and Africa
  • 10. North America Market Analysis 2020 to 2024 and Forecast 2025 to 2035, By Country
  • 11. Latin America Market Analysis 2020 to 2024 and Forecast 2025 to 2035, By Country
  • 12. Western Europe Market Analysis 2020 to 2024 and Forecast 2025 to 2035, By Country
  • 13. Eastern Europe Market Analysis 2020 to 2024 and Forecast 2025 to 2035, By Country
  • 14. South Asia and Pacific Market Analysis 2020 to 2024 and Forecast 2025 to 2035, By Country
  • 15. East Asia Market Analysis 2020 to 2024 and Forecast 2025 to 2035, By Country
  • 16. Middle East and Africa Market Analysis 2020 to 2024 and Forecast 2025 to 2035, By Country
  • 17. Key Countries Market Analysis
  • 18. Market Structure Analysis
  • 19. Competition Analysis
    • 19.1. Kerry Group
    • 19.2. Bio Springer S.A
    • 19.3. Koninklijke DSM N.V.
    • 19.4. Lallemand Inc
    • 19.5. Sensient Technologies Corporation
    • 19.6. Leiber GmbH
    • 19.7. KOHJIN Life Science Co., Ltd
    • 19.8. Angel Yeast Co., Ltd
    • 19.9. Titan Biotech Ltd
    • 19.10. Associated British Foods Plc
  • 20. Assumptions & Acronyms Used
  • 21. Research Methodology

List of Tables

  • Table 1: Global Market Value (USD Million) Forecast by Region, 2020 to 2035
  • Table 2: Global Market Volume (Tons) Forecast by Region, 2020 to 2035
  • Table 3: Global Market Value (USD Million) Forecast by Product Type, 2020 to 2035
  • Table 4: Global Market Volume (Tons) Forecast by Product Type, 2020 to 2035
  • Table 5: Global Market Value (USD Million) Forecast by Form, 2020 to 2035
  • Table 6: Global Market Volume (Tons) Forecast by Form, 2020 to 2035
  • Table 7: Global Market Value (USD Million) Forecast by Base, 2020 to 2035
  • Table 8: Global Market Volume (Tons) Forecast by Base, 2020 to 2035
  • Table 9: Global Market Value (USD Million) Forecast by Nature, 2020 to 2035
  • Table 10: Global Market Volume (Tons) Forecast by Nature, 2020 to 2035
  • Table 11: North America Market Value (USD Million) Forecast by Country, 2020 to 2035
  • Table 12: North America Market Volume (Tons) Forecast by Country, 2020 to 2035
  • Table 13: North America Market Value (USD Million) Forecast by Product Type, 2020 to 2035
  • Table 14: North America Market Volume (Tons) Forecast by Product Type, 2020 to 2035
  • Table 15: North America Market Value (USD Million) Forecast by Form, 2020 to 2035
  • Table 16: North America Market Volume (Tons) Forecast by Form, 2020 to 2035
  • Table 17: North America Market Value (USD Million) Forecast by Base, 2020 to 2035
  • Table 18: North America Market Volume (Tons) Forecast by Base, 2020 to 2035
  • Table 19: North America Market Value (USD Million) Forecast by Nature, 2020 to 2035
  • Table 20: North America Market Volume (Tons) Forecast by Nature, 2020 to 2035
  • Table 21: Latin America Market Value (USD Million) Forecast by Country, 2020 to 2035
  • Table 22: Latin America Market Volume (Tons) Forecast by Country, 2020 to 2035
  • Table 23: Latin America Market Value (USD Million) Forecast by Product Type, 2020 to 2035
  • Table 24: Latin America Market Volume (Tons) Forecast by Product Type, 2020 to 2035
  • Table 25: Latin America Market Value (USD Million) Forecast by Form, 2020 to 2035
  • Table 26: Latin America Market Volume (Tons) Forecast by Form, 2020 to 2035
  • Table 27: Latin America Market Value (USD Million) Forecast by Base, 2020 to 2035
  • Table 28: Latin America Market Volume (Tons) Forecast by Base, 2020 to 2035
  • Table 29: Latin America Market Value (USD Million) Forecast by Nature, 2020 to 2035
  • Table 30: Latin America Market Volume (Tons) Forecast by Nature, 2020 to 2035
  • Table 31: Western Europe Market Value (USD Million) Forecast by Country, 2020 to 2035
  • Table 32: Western Europe Market Volume (Tons) Forecast by Country, 2020 to 2035
  • Table 33: Western Europe Market Value (USD Million) Forecast by Product Type, 2020 to 2035
  • Table 34: Western Europe Market Volume (Tons) Forecast by Product Type, 2020 to 2035
  • Table 35: Western Europe Market Value (USD Million) Forecast by Form, 2020 to 2035
  • Table 36: Western Europe Market Volume (Tons) Forecast by Form, 2020 to 2035
  • Table 37: Western Europe Market Value (USD Million) Forecast by Base, 2020 to 2035
  • Table 38: Western Europe Market Volume (Tons) Forecast by Base, 2020 to 2035
  • Table 39: Western Europe Market Value (USD Million) Forecast by Nature, 2020 to 2035
  • Table 40: Western Europe Market Volume (Tons) Forecast by Nature, 2020 to 2035
  • Table 41: Eastern Europe Market Value (USD Million) Forecast by Country, 2020 to 2035
  • Table 42: Eastern Europe Market Volume (Tons) Forecast by Country, 2020 to 2035
  • Table 43: Eastern Europe Market Value (USD Million) Forecast by Product Type, 2020 to 2035
  • Table 44: Eastern Europe Market Volume (Tons) Forecast by Product Type, 2020 to 2035
  • Table 45: Eastern Europe Market Value (USD Million) Forecast by Form, 2020 to 2035
  • Table 46: Eastern Europe Market Volume (Tons) Forecast by Form, 2020 to 2035
  • Table 47: Eastern Europe Market Value (USD Million) Forecast by Base, 2020 to 2035
  • Table 48: Eastern Europe Market Volume (Tons) Forecast by Base, 2020 to 2035
  • Table 49: Eastern Europe Market Value (USD Million) Forecast by Nature, 2020 to 2035
  • Table 50: Eastern Europe Market Volume (Tons) Forecast by Nature, 2020 to 2035
  • Table 51: South Asia and Pacific Market Value (USD Million) Forecast by Country, 2020 to 2035
  • Table 52: South Asia and Pacific Market Volume (Tons) Forecast by Country, 2020 to 2035
  • Table 53: South Asia and Pacific Market Value (USD Million) Forecast by Product Type, 2020 to 2035
  • Table 54: South Asia and Pacific Market Volume (Tons) Forecast by Product Type, 2020 to 2035
  • Table 55: South Asia and Pacific Market Value (USD Million) Forecast by Form, 2020 to 2035
  • Table 56: South Asia and Pacific Market Volume (Tons) Forecast by Form, 2020 to 2035
  • Table 57: South Asia and Pacific Market Value (USD Million) Forecast by Base, 2020 to 2035
  • Table 58: South Asia and Pacific Market Volume (Tons) Forecast by Base, 2020 to 2035
  • Table 59: South Asia and Pacific Market Value (USD Million) Forecast by Nature, 2020 to 2035
  • Table 60: South Asia and Pacific Market Volume (Tons) Forecast by Nature, 2020 to 2035
  • Table 61: East Asia Market Value (USD Million) Forecast by Country, 2020 to 2035
  • Table 62: East Asia Market Volume (Tons) Forecast by Country, 2020 to 2035
  • Table 63: East Asia Market Value (USD Million) Forecast by Product Type, 2020 to 2035
  • Table 64: East Asia Market Volume (Tons) Forecast by Product Type, 2020 to 2035
  • Table 65: East Asia Market Value (USD Million) Forecast by Form, 2020 to 2035
  • Table 66: East Asia Market Volume (Tons) Forecast by Form, 2020 to 2035
  • Table 67: East Asia Market Value (USD Million) Forecast by Base, 2020 to 2035
  • Table 68: East Asia Market Volume (Tons) Forecast by Base, 2020 to 2035
  • Table 69: East Asia Market Value (USD Million) Forecast by Nature, 2020 to 2035
  • Table 70: East Asia Market Volume (Tons) Forecast by Nature, 2020 to 2035
  • Table 71: Middle East and Africa Market Value (USD Million) Forecast by Country, 2020 to 2035
  • Table 72: Middle East and Africa Market Volume (Tons) Forecast by Country, 2020 to 2035
  • Table 73: Middle East and Africa Market Value (USD Million) Forecast by Product Type, 2020 to 2035
  • Table 74: Middle East and Africa Market Volume (Tons) Forecast by Product Type, 2020 to 2035
  • Table 75: Middle East and Africa Market Value (USD Million) Forecast by Form, 2020 to 2035
  • Table 76: Middle East and Africa Market Volume (Tons) Forecast by Form, 2020 to 2035
  • Table 77: Middle East and Africa Market Value (USD Million) Forecast by Base, 2020 to 2035
  • Table 78: Middle East and Africa Market Volume (Tons) Forecast by Base, 2020 to 2035
  • Table 79: Middle East and Africa Market Value (USD Million) Forecast by Nature, 2020 to 2035
  • Table 80: Middle East and Africa Market Volume (Tons) Forecast by Nature, 2020 to 2035

List of Figures

  • Figure 1: Global Market Value (USD Million) by Product Type, 2025 to 2035
  • Figure 2: Global Market Value (USD Million) by Form, 2025 to 2035
  • Figure 3: Global Market Value (USD Million) by Base, 2025 to 2035
  • Figure 4: Global Market Value (USD Million) by Nature, 2025 to 2035
  • Figure 5: Global Market Value (USD Million) by Region, 2025 to 2035
  • Figure 6: Global Market Value (USD Million) Analysis by Region, 2020 to 2035
  • Figure 7: Global Market Volume (Tons) Analysis by Region, 2020 to 2035
  • Figure 8: Global Market Value Share (%) and BPS Analysis by Region, 2025 to 2035
  • Figure 9: Global Market Y-o-Y Growth (%) Projections by Region, 2025 to 2035
  • Figure 10: Global Market Value (USD Million) Analysis by Product Type, 2020 to 2035
  • Figure 11: Global Market Volume (Tons) Analysis by Product Type, 2020 to 2035
  • Figure 12: Global Market Value Share (%) and BPS Analysis by Product Type, 2025 to 2035
  • Figure 13: Global Market Y-o-Y Growth (%) Projections by Product Type, 2025 to 2035
  • Figure 14: Global Market Value (USD Million) Analysis by Form, 2020 to 2035
  • Figure 15: Global Market Volume (Tons) Analysis by Form, 2020 to 2035
  • Figure 16: Global Market Value Share (%) and BPS Analysis by Form, 2025 to 2035
  • Figure 17: Global Market Y-o-Y Growth (%) Projections by Form, 2025 to 2035
  • Figure 18: Global Market Value (USD Million) Analysis by Base, 2020 to 2035
  • Figure 19: Global Market Volume (Tons) Analysis by Base, 2020 to 2035
  • Figure 20: Global Market Value Share (%) and BPS Analysis by Base, 2025 to 2035
  • Figure 21: Global Market Y-o-Y Growth (%) Projections by Base, 2025 to 2035
  • Figure 22: Global Market Value (USD Million) Analysis by Nature, 2020 to 2035
  • Figure 23: Global Market Volume (Tons) Analysis by Nature, 2020 to 2035
  • Figure 24: Global Market Value Share (%) and BPS Analysis by Nature, 2025 to 2035
  • Figure 25: Global Market Y-o-Y Growth (%) Projections by Nature, 2025 to 2035
  • Figure 26: Global Market Attractiveness by Product Type, 2025 to 2035
  • Figure 27: Global Market Attractiveness by Form, 2025 to 2035
  • Figure 28: Global Market Attractiveness by Base, 2025 to 2035
  • Figure 29: Global Market Attractiveness by Nature, 2025 to 2035
  • Figure 30: Global Market Attractiveness by Region, 2025 to 2035
  • Figure 31: North America Market Value (USD Million) by Product Type, 2025 to 2035
  • Figure 32: North America Market Value (USD Million) by Form, 2025 to 2035
  • Figure 33: North America Market Value (USD Million) by Base, 2025 to 2035
  • Figure 34: North America Market Value (USD Million) by Nature, 2025 to 2035
  • Figure 35: North America Market Value (USD Million) by Country, 2025 to 2035
  • Figure 36: North America Market Value (USD Million) Analysis by Country, 2020 to 2035
  • Figure 37: North America Market Volume (Tons) Analysis by Country, 2020 to 2035
  • Figure 38: North America Market Value Share (%) and BPS Analysis by Country, 2025 to 2035
  • Figure 39: North America Market Y-o-Y Growth (%) Projections by Country, 2025 to 2035
  • Figure 40: North America Market Value (USD Million) Analysis by Product Type, 2020 to 2035
  • Figure 41: North America Market Volume (Tons) Analysis by Product Type, 2020 to 2035
  • Figure 42: North America Market Value Share (%) and BPS Analysis by Product Type, 2025 to 2035
  • Figure 43: North America Market Y-o-Y Growth (%) Projections by Product Type, 2025 to 2035
  • Figure 44: North America Market Value (USD Million) Analysis by Form, 2020 to 2035
  • Figure 45: North America Market Volume (Tons) Analysis by Form, 2020 to 2035
  • Figure 46: North America Market Value Share (%) and BPS Analysis by Form, 2025 to 2035
  • Figure 47: North America Market Y-o-Y Growth (%) Projections by Form, 2025 to 2035
  • Figure 48: North America Market Value (USD Million) Analysis by Base, 2020 to 2035
  • Figure 49: North America Market Volume (Tons) Analysis by Base, 2020 to 2035
  • Figure 50: North America Market Value Share (%) and BPS Analysis by Base, 2025 to 2035
  • Figure 51: North America Market Y-o-Y Growth (%) Projections by Base, 2025 to 2035
  • Figure 52: North America Market Value (USD Million) Analysis by Nature, 2020 to 2035
  • Figure 53: North America Market Volume (Tons) Analysis by Nature, 2020 to 2035
  • Figure 54: North America Market Value Share (%) and BPS Analysis by Nature, 2025 to 2035
  • Figure 55: North America Market Y-o-Y Growth (%) Projections by Nature, 2025 to 2035
  • Figure 56: North America Market Attractiveness by Product Type, 2025 to 2035
  • Figure 57: North America Market Attractiveness by Form, 2025 to 2035
  • Figure 58: North America Market Attractiveness by Base, 2025 to 2035
  • Figure 59: North America Market Attractiveness by Nature, 2025 to 2035
  • Figure 60: North America Market Attractiveness by Country, 2025 to 2035
  • Figure 61: Latin America Market Value (USD Million) by Product Type, 2025 to 2035
  • Figure 62: Latin America Market Value (USD Million) by Form, 2025 to 2035
  • Figure 63: Latin America Market Value (USD Million) by Base, 2025 to 2035
  • Figure 64: Latin America Market Value (USD Million) by Nature, 2025 to 2035
  • Figure 65: Latin America Market Value (USD Million) by Country, 2025 to 2035
  • Figure 66: Latin America Market Value (USD Million) Analysis by Country, 2020 to 2035
  • Figure 67: Latin America Market Volume (Tons) Analysis by Country, 2020 to 2035
  • Figure 68: Latin America Market Value Share (%) and BPS Analysis by Country, 2025 to 2035
  • Figure 69: Latin America Market Y-o-Y Growth (%) Projections by Country, 2025 to 2035
  • Figure 70: Latin America Market Value (USD Million) Analysis by Product Type, 2020 to 2035
  • Figure 71: Latin America Market Volume (Tons) Analysis by Product Type, 2020 to 2035
  • Figure 72: Latin America Market Value Share (%) and BPS Analysis by Product Type, 2025 to 2035
  • Figure 73: Latin America Market Y-o-Y Growth (%) Projections by Product Type, 2025 to 2035
  • Figure 74: Latin America Market Value (USD Million) Analysis by Form, 2020 to 2035
  • Figure 75: Latin America Market Volume (Tons) Analysis by Form, 2020 to 2035
  • Figure 76: Latin America Market Value Share (%) and BPS Analysis by Form, 2025 to 2035
  • Figure 77: Latin America Market Y-o-Y Growth (%) Projections by Form, 2025 to 2035
  • Figure 78: Latin America Market Value (USD Million) Analysis by Base, 2020 to 2035
  • Figure 79: Latin America Market Volume (Tons) Analysis by Base, 2020 to 2035
  • Figure 80: Latin America Market Value Share (%) and BPS Analysis by Base, 2025 to 2035
  • Figure 81: Latin America Market Y-o-Y Growth (%) Projections by Base, 2025 to 2035
  • Figure 82: Latin America Market Value (USD Million) Analysis by Nature, 2020 to 2035
  • Figure 83: Latin America Market Volume (Tons) Analysis by Nature, 2020 to 2035
  • Figure 84: Latin America Market Value Share (%) and BPS Analysis by Nature, 2025 to 2035
  • Figure 85: Latin America Market Y-o-Y Growth (%) Projections by Nature, 2025 to 2035
  • Figure 86: Latin America Market Attractiveness by Product Type, 2025 to 2035
  • Figure 87: Latin America Market Attractiveness by Form, 2025 to 2035
  • Figure 88: Latin America Market Attractiveness by Base, 2025 to 2035
  • Figure 89: Latin America Market Attractiveness by Nature, 2025 to 2035
  • Figure 90: Latin America Market Attractiveness by Country, 2025 to 2035
  • Figure 91: Western Europe Market Value (USD Million) by Product Type, 2025 to 2035
  • Figure 92: Western Europe Market Value (USD Million) by Form, 2025 to 2035
  • Figure 93: Western Europe Market Value (USD Million) by Base, 2025 to 2035
  • Figure 94: Western Europe Market Value (USD Million) by Nature, 2025 to 2035
  • Figure 95: Western Europe Market Value (USD Million) by Country, 2025 to 2035
  • Figure 96: Western Europe Market Value (USD Million) Analysis by Country, 2020 to 2035
  • Figure 97: Western Europe Market Volume (Tons) Analysis by Country, 2020 to 2035
  • Figure 98: Western Europe Market Value Share (%) and BPS Analysis by Country, 2025 to 2035
  • Figure 99: Western Europe Market Y-o-Y Growth (%) Projections by Country, 2025 to 2035
  • Figure 100: Western Europe Market Value (USD Million) Analysis by Product Type, 2020 to 2035
  • Figure 101: Western Europe Market Volume (Tons) Analysis by Product Type, 2020 to 2035
  • Figure 102: Western Europe Market Value Share (%) and BPS Analysis by Product Type, 2025 to 2035
  • Figure 103: Western Europe Market Y-o-Y Growth (%) Projections by Product Type, 2025 to 2035
  • Figure 104: Western Europe Market Value (USD Million) Analysis by Form, 2020 to 2035
  • Figure 105: Western Europe Market Volume (Tons) Analysis by Form, 2020 to 2035
  • Figure 106: Western Europe Market Value Share (%) and BPS Analysis by Form, 2025 to 2035
  • Figure 107: Western Europe Market Y-o-Y Growth (%) Projections by Form, 2025 to 2035
  • Figure 108: Western Europe Market Value (USD Million) Analysis by Base, 2020 to 2035
  • Figure 109: Western Europe Market Volume (Tons) Analysis by Base, 2020 to 2035
  • Figure 110: Western Europe Market Value Share (%) and BPS Analysis by Base, 2025 to 2035
  • Figure 111: Western Europe Market Y-o-Y Growth (%) Projections by Base, 2025 to 2035
  • Figure 112: Western Europe Market Value (USD Million) Analysis by Nature, 2020 to 2035
  • Figure 113: Western Europe Market Volume (Tons) Analysis by Nature, 2020 to 2035
  • Figure 114: Western Europe Market Value Share (%) and BPS Analysis by Nature, 2025 to 2035
  • Figure 115: Western Europe Market Y-o-Y Growth (%) Projections by Nature, 2025 to 2035
  • Figure 116: Western Europe Market Attractiveness by Product Type, 2025 to 2035
  • Figure 117: Western Europe Market Attractiveness by Form, 2025 to 2035
  • Figure 118: Western Europe Market Attractiveness by Base, 2025 to 2035
  • Figure 119: Western Europe Market Attractiveness by Nature, 2025 to 2035
  • Figure 120: Western Europe Market Attractiveness by Country, 2025 to 2035
  • Figure 121: Eastern Europe Market Value (USD Million) by Product Type, 2025 to 2035
  • Figure 122: Eastern Europe Market Value (USD Million) by Form, 2025 to 2035
  • Figure 123: Eastern Europe Market Value (USD Million) by Base, 2025 to 2035
  • Figure 124: Eastern Europe Market Value (USD Million) by Nature, 2025 to 2035
  • Figure 125: Eastern Europe Market Value (USD Million) by Country, 2025 to 2035
  • Figure 126: Eastern Europe Market Value (USD Million) Analysis by Country, 2020 to 2035
  • Figure 127: Eastern Europe Market Volume (Tons) Analysis by Country, 2020 to 2035
  • Figure 128: Eastern Europe Market Value Share (%) and BPS Analysis by Country, 2025 to 2035
  • Figure 129: Eastern Europe Market Y-o-Y Growth (%) Projections by Country, 2025 to 2035
  • Figure 130: Eastern Europe Market Value (USD Million) Analysis by Product Type, 2020 to 2035
  • Figure 131: Eastern Europe Market Volume (Tons) Analysis by Product Type, 2020 to 2035
  • Figure 132: Eastern Europe Market Value Share (%) and BPS Analysis by Product Type, 2025 to 2035
  • Figure 133: Eastern Europe Market Y-o-Y Growth (%) Projections by Product Type, 2025 to 2035
  • Figure 134: Eastern Europe Market Value (USD Million) Analysis by Form, 2020 to 2035
  • Figure 135: Eastern Europe Market Volume (Tons) Analysis by Form, 2020 to 2035
  • Figure 136: Eastern Europe Market Value Share (%) and BPS Analysis by Form, 2025 to 2035
  • Figure 137: Eastern Europe Market Y-o-Y Growth (%) Projections by Form, 2025 to 2035
  • Figure 138: Eastern Europe Market Value (USD Million) Analysis by Base, 2020 to 2035
  • Figure 139: Eastern Europe Market Volume (Tons) Analysis by Base, 2020 to 2035
  • Figure 140: Eastern Europe Market Value Share (%) and BPS Analysis by Base, 2025 to 2035
  • Figure 141: Eastern Europe Market Y-o-Y Growth (%) Projections by Base, 2025 to 2035
  • Figure 142: Eastern Europe Market Value (USD Million) Analysis by Nature, 2020 to 2035
  • Figure 143: Eastern Europe Market Volume (Tons) Analysis by Nature, 2020 to 2035
  • Figure 144: Eastern Europe Market Value Share (%) and BPS Analysis by Nature, 2025 to 2035
  • Figure 145: Eastern Europe Market Y-o-Y Growth (%) Projections by Nature, 2025 to 2035
  • Figure 146: Eastern Europe Market Attractiveness by Product Type, 2025 to 2035
  • Figure 147: Eastern Europe Market Attractiveness by Form, 2025 to 2035
  • Figure 148: Eastern Europe Market Attractiveness by Base, 2025 to 2035
  • Figure 149: Eastern Europe Market Attractiveness by Nature, 2025 to 2035
  • Figure 150: Eastern Europe Market Attractiveness by Country, 2025 to 2035
  • Figure 151: South Asia and Pacific Market Value (USD Million) by Product Type, 2025 to 2035
  • Figure 152: South Asia and Pacific Market Value (USD Million) by Form, 2025 to 2035
  • Figure 153: South Asia and Pacific Market Value (USD Million) by Base, 2025 to 2035
  • Figure 154: South Asia and Pacific Market Value (USD Million) by Nature, 2025 to 2035
  • Figure 155: South Asia and Pacific Market Value (USD Million) by Country, 2025 to 2035
  • Figure 156: South Asia and Pacific Market Value (USD Million) Analysis by Country, 2020 to 2035
  • Figure 157: South Asia and Pacific Market Volume (Tons) Analysis by Country, 2020 to 2035
  • Figure 158: South Asia and Pacific Market Value Share (%) and BPS Analysis by Country, 2025 to 2035
  • Figure 159: South Asia and Pacific Market Y-o-Y Growth (%) Projections by Country, 2025 to 2035
  • Figure 160: South Asia and Pacific Market Value (USD Million) Analysis by Product Type, 2020 to 2035
  • Figure 161: South Asia and Pacific Market Volume (Tons) Analysis by Product Type, 2020 to 2035
  • Figure 162: South Asia and Pacific Market Value Share (%) and BPS Analysis by Product Type, 2025 to 2035
  • Figure 163: South Asia and Pacific Market Y-o-Y Growth (%) Projections by Product Type, 2025 to 2035
  • Figure 164: South Asia and Pacific Market Value (USD Million) Analysis by Form, 2020 to 2035
  • Figure 165: South Asia and Pacific Market Volume (Tons) Analysis by Form, 2020 to 2035
  • Figure 166: South Asia and Pacific Market Value Share (%) and BPS Analysis by Form, 2025 to 2035
  • Figure 167: South Asia and Pacific Market Y-o-Y Growth (%) Projections by Form, 2025 to 2035
  • Figure 168: South Asia and Pacific Market Value (USD Million) Analysis by Base, 2020 to 2035
  • Figure 169: South Asia and Pacific Market Volume (Tons) Analysis by Base, 2020 to 2035
  • Figure 170: South Asia and Pacific Market Value Share (%) and BPS Analysis by Base, 2025 to 2035
  • Figure 171: South Asia and Pacific Market Y-o-Y Growth (%) Projections by Base, 2025 to 2035
  • Figure 172: South Asia and Pacific Market Value (USD Million) Analysis by Nature, 2020 to 2035
  • Figure 173: South Asia and Pacific Market Volume (Tons) Analysis by Nature, 2020 to 2035
  • Figure 174: South Asia and Pacific Market Value Share (%) and BPS Analysis by Nature, 2025 to 2035
  • Figure 175: South Asia and Pacific Market Y-o-Y Growth (%) Projections by Nature, 2025 to 2035
  • Figure 176: South Asia and Pacific Market Attractiveness by Product Type, 2025 to 2035
  • Figure 177: South Asia and Pacific Market Attractiveness by Form, 2025 to 2035
  • Figure 178: South Asia and Pacific Market Attractiveness by Base, 2025 to 2035
  • Figure 179: South Asia and Pacific Market Attractiveness by Nature, 2025 to 2035
  • Figure 180: South Asia and Pacific Market Attractiveness by Country, 2025 to 2035
  • Figure 181: East Asia Market Value (USD Million) by Product Type, 2025 to 2035
  • Figure 182: East Asia Market Value (USD Million) by Form, 2025 to 2035
  • Figure 183: East Asia Market Value (USD Million) by Base, 2025 to 2035
  • Figure 184: East Asia Market Value (USD Million) by Nature, 2025 to 2035
  • Figure 185: East Asia Market Value (USD Million) by Country, 2025 to 2035
  • Figure 186: East Asia Market Value (USD Million) Analysis by Country, 2020 to 2035
  • Figure 187: East Asia Market Volume (Tons) Analysis by Country, 2020 to 2035
  • Figure 188: East Asia Market Value Share (%) and BPS Analysis by Country, 2025 to 2035
  • Figure 189: East Asia Market Y-o-Y Growth (%) Projections by Country, 2025 to 2035
  • Figure 190: East Asia Market Value (USD Million) Analysis by Product Type, 2020 to 2035
  • Figure 191: East Asia Market Volume (Tons) Analysis by Product Type, 2020 to 2035
  • Figure 192: East Asia Market Value Share (%) and BPS Analysis by Product Type, 2025 to 2035
  • Figure 193: East Asia Market Y-o-Y Growth (%) Projections by Product Type, 2025 to 2035
  • Figure 194: East Asia Market Value (USD Million) Analysis by Form, 2020 to 2035
  • Figure 195: East Asia Market Volume (Tons) Analysis by Form, 2020 to 2035
  • Figure 196: East Asia Market Value Share (%) and BPS Analysis by Form, 2025 to 2035
  • Figure 197: East Asia Market Y-o-Y Growth (%) Projections by Form, 2025 to 2035
  • Figure 198: East Asia Market Value (USD Million) Analysis by Base, 2020 to 2035
  • Figure 199: East Asia Market Volume (Tons) Analysis by Base, 2020 to 2035
  • Figure 200: East Asia Market Value Share (%) and BPS Analysis by Base, 2025 to 2035
  • Figure 201: East Asia Market Y-o-Y Growth (%) Projections by Base, 2025 to 2035
  • Figure 202: East Asia Market Value (USD Million) Analysis by Nature, 2020 to 2035
  • Figure 203: East Asia Market Volume (Tons) Analysis by Nature, 2020 to 2035
  • Figure 204: East Asia Market Value Share (%) and BPS Analysis by Nature, 2025 to 2035
  • Figure 205: East Asia Market Y-o-Y Growth (%) Projections by Nature, 2025 to 2035
  • Figure 206: East Asia Market Attractiveness by Product Type, 2025 to 2035
  • Figure 207: East Asia Market Attractiveness by Form, 2025 to 2035
  • Figure 208: East Asia Market Attractiveness by Base, 2025 to 2035
  • Figure 209: East Asia Market Attractiveness by Nature, 2025 to 2035
  • Figure 210: East Asia Market Attractiveness by Country, 2025 to 2035
  • Figure 211: Middle East and Africa Market Value (USD Million) by Product Type, 2025 to 2035
  • Figure 212: Middle East and Africa Market Value (USD Million) by Form, 2025 to 2035
  • Figure 213: Middle East and Africa Market Value (USD Million) by Base, 2025 to 2035
  • Figure 214: Middle East and Africa Market Value (USD Million) by Nature, 2025 to 2035
  • Figure 215: Middle East and Africa Market Value (USD Million) by Country, 2025 to 2035
  • Figure 216: Middle East and Africa Market Value (USD Million) Analysis by Country, 2020 to 2035
  • Figure 217: Middle East and Africa Market Volume (Tons) Analysis by Country, 2020 to 2035
  • Figure 218: Middle East and Africa Market Value Share (%) and BPS Analysis by Country, 2025 to 2035
  • Figure 219: Middle East and Africa Market Y-o-Y Growth (%) Projections by Country, 2025 to 2035
  • Figure 220: Middle East and Africa Market Value (USD Million) Analysis by Product Type, 2020 to 2035
  • Figure 221: Middle East and Africa Market Volume (Tons) Analysis by Product Type, 2020 to 2035
  • Figure 222: Middle East and Africa Market Value Share (%) and BPS Analysis by Product Type, 2025 to 2035
  • Figure 223: Middle East and Africa Market Y-o-Y Growth (%) Projections by Product Type, 2025 to 2035
  • Figure 224: Middle East and Africa Market Value (USD Million) Analysis by Form, 2020 to 2035
  • Figure 225: Middle East and Africa Market Volume (Tons) Analysis by Form, 2020 to 2035
  • Figure 226: Middle East and Africa Market Value Share (%) and BPS Analysis by Form, 2025 to 2035
  • Figure 227: Middle East and Africa Market Y-o-Y Growth (%) Projections by Form, 2025 to 2035
  • Figure 228: Middle East and Africa Market Value (USD Million) Analysis by Base, 2020 to 2035
  • Figure 229: Middle East and Africa Market Volume (Tons) Analysis by Base, 2020 to 2035
  • Figure 230: Middle East and Africa Market Value Share (%) and BPS Analysis by Base, 2025 to 2035
  • Figure 231: Middle East and Africa Market Y-o-Y Growth (%) Projections by Base, 2025 to 2035
  • Figure 232: Middle East and Africa Market Value (USD Million) Analysis by Nature, 2020 to 2035
  • Figure 233: Middle East and Africa Market Volume (Tons) Analysis by Nature, 2020 to 2035
  • Figure 234: Middle East and Africa Market Value Share (%) and BPS Analysis by Nature, 2025 to 2035
  • Figure 235: Middle East and Africa Market Y-o-Y Growth (%) Projections by Nature, 2025 to 2035
  • Figure 236: Middle East and Africa Market Attractiveness by Product Type, 2025 to 2035
  • Figure 237: Middle East and Africa Market Attractiveness by Form, 2025 to 2035
  • Figure 238: Middle East and Africa Market Attractiveness by Base, 2025 to 2035
  • Figure 239: Middle East and Africa Market Attractiveness by Nature, 2025 to 2035
  • Figure 240: Middle East and Africa Market Attractiveness by Country, 2025 to 2035

Frequently Asked Questions

What is the projected size of the dry yeast market by 2035?

The global dry yeast market is expected to reach USD 110.31 billion by 2035, growing from USD 54.02 billion in 2025, at a CAGR of 7.4% during the forecast period.

Which product type is expected to witness the fastest growth in the dry yeast industry?

The active dry yeast segment is projected to grow at the fastest pace, registering a CAGR of 5.6% from 2025 to 2035, driven by its widespread use in baking, brewing, and home fermentation applications.

Which form of dry yeast is gaining significant traction in global markets?

The powder form segment is anticipated to grow at a CAGR of 5.2% from 2025 to 2035, owing to its extended shelf life, easy handling, and strong demand from both industrial food processors and home bakers.

What key factors are driving the global demand for dry yeast?

Major drivers include rising consumption of bakery and fermented foods, demand for clean-label and vegan ingredients, expansion of the brewing industry, and growing applications in animal feed, bioethanol, and dietary supplements.

Who are the leading players in the global dry yeast market?

Key players include Kerry Group, Bio Springer S.A, Koninklijke DSM N.V., Lallemand Inc, Angel Yeast Co., Ltd, and Associated British Foods Plc, all actively innovating with non-GMO, fortified, and functional yeast offerings.

Explore Similar Insights

Future Market Insights

Dry Yeast Market