Dry Whole Milk Powder Market Outlook (2023 to 2033)

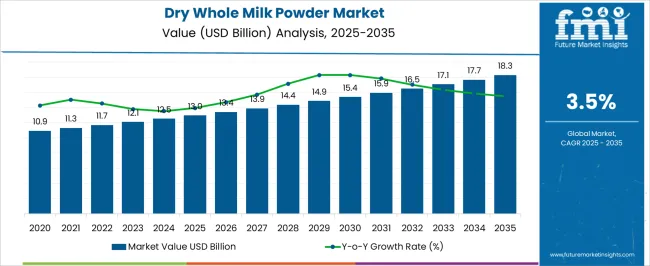
The net worth of the market share of dry whole milk powder is predicted to grow from US$ 12.1 billion in 2023 to over US$ 17.23 Billion by 2033. Due to its extended shelf life, dry whole milk powder addresses the perishability concerns of fresh dairy products. The market is expected to register a CAGR of 3.5% from 2023 to 2033.

Dry milk powder doesn't suffer from significant quality loss over the course of a year, which alleviates concerns about fresh dairy products' perishability. The longer shelf life of powdered milk influences the sales of dry whole milk powder.

In places where temperature extremes occur, and where cold chains are not reliable for delivering perishable dairy products, milk powder is especially useful. The market for dry whole milk powder is also expanding because of its advantages over liquid milk in terms of low volume and weight for transportation.

While lactose intolerance is projected to exert a restraint on the growth of the market. Also fluctuating raw material prices may impede the growth of the global dry whole milk powder market. Furthermore, new opportunities for the market are expected as the demand for nutritious food products increases. Moreover, the expansion of regulations in the processed food industry.

Impact Factors for Dry Whole Milk Powder:

  • Several factors are expected to drive the growth of the market, including rising disposable income levels, urbanization, better retail networks in developing countries, rising health consciousness among consumers, and expanding consumer lifestyles.
  • Among all dry whole milk powder markets, the Asia-Pacific dry whole milk powder market accounted for the largest share in 2023. This is due to changing lifestyles, a growing working population, rapid urbanization, higher disposable incomes, better retail infrastructure, and a high dairy consumption rate are among the reasons for the market growth.
  • A rapid globalization of cuisine, soaring confectionery, and bakery markets, a growing health awareness among consumers, and an increase in infant formula demand are expected to drive the market. As a result of the growing veganism trend and rising inflation rates, market growth is expected to be slowed.
Attributes Details
Dry Whole Milk Powder Market Value (2023) US$ 12.1 Billion
Dry Whole Milk Powder Market Expected Value (2033) US$ 17.23 Billion
Dry Whole Milk Powder Market Projected CAGR (2023 to 2033) 3.5%

Don't pay for what you don't need

Customize your report by selecting specific countries or regions and save 30%!

Global Dry Whole Milk Powder Market Historical Analysis (2017 to 2022) Vs. Forecast Outlook (2023 to 2033)

In addition to ice cream, cultured milk, yogurt, chocolate, confectionery, bakery products, soups, and sauces, milk powder is an ingredient in numerous food products. The demand for dry whole milk powders grew steadily over the past years in the food sector.

Dried whole milk powder can be used in a variety of products, including dairy items, confectionery items, infant formula, nutrient supplements, and as a saturating agent in biotechnology. Furthermore, whole dry milk offers a richer, creamier taste and contains more nutrients than its alternatives, including skimmed milk. However, consumers with lactose intolerance prefer to buy skimmed milk for its low-fat content.

  • Short Term (2022 to 2025): Following the outbreak of the pandemic, consumers began stockpiling food products, which increased the demand for shelf-stable foods. Having a longer shelf life than liquid milk, consumers started buying milk powder instead of liquid milk. To capitalize on this trend, manufacturers introduced highly enriched milk powder.
  • Medium Term (2025 to 2028): A variety of factors such as the increasing use of powdered milk in baby foods and the presence of vitamins C, B12, thiamine, and high amounts of protein contribute to the growth of the milk market worldwide.
  • Long Term (2028 to 2033): In comparison to other whey products, powdered whole milk is most commonly used by food manufacturers. If other developing countries follow suit, the market for milk powder will grow dramatically during the outlook period. Whole milk powder is primarily consumed by food manufacturers in the United States. Using whole milk powder in an environmentally-friendly manner has become a priority for food manufacturers and scientists in recent years.
Historical CAGR 4.80%
Historical Market Value (2022) US$ 11.8 Billion
Forecast CAGR 3.50%

Comparative Analysis of Adjacent Dry Whole Milk Powder Markets

Dry Whole Milk Powder Market:

Differentiating Aspects Dry Whole Milk Powder Market
CAGR (2023 to 2033) 3.5%
Market Valuation in 2023 US$ 12.1 Billion
Projected Market Value in 2033 US$ 17.23 Billion
Growth Factors Emulsion formulation is made easier through the use of factors such as substituents at the water/oil interfaces.
Opportunities Processed food regulations and preferences are evolving due to the growing demand for nutritious food.
Key Trends Surging demand for dairy products and inclination towards a healthy diet.

Milk Powder Market:

Differentiating Aspects Milk Powder Market
CAGR (2023 to 2033) 4.5%
Market Valuation in 2023 US$ 36.05 Billion
Projected Market Value in 2033 US$ 55.99 Billion
Growth Factors Due to innovative technologies that improve efficiency, expand product portfolios, and lead to sophisticated packaging and design.
Opportunities Milk powder has a longer shelf life than liquid milk, so consumers started choosing it over liquid milk.
Key Trends Rise in packaged food products and infant formula market.

Organic Milk Powder Market:

Differentiating Aspects Organic Milk Powder Market
CAGR (2023 to 2033) 5.4%
Market Valuation in 2023 US$ 2.42 Billion
Projected Market Value in 2033 US$ 4.1 Billion
Growth Factors Organic yogurt consumption, ice cream consumption, and bakery consumption are rising.
Opportunities Organic products' various beneficial attributes are contributing to a significant rise in sales of organic milk products.
Key Trends Consumption of ingredients sourced from nature and with clean labels is on the rise.
Nandini Roy Choudhury

Principal Consultant

Talk to Analyst

Find your sweet spots for generating winning opportunities in this market.

Major Factors Driving Dry Whole Milk Powder Market:

  • Rising Demand for Nutritional Food Products

The overall demand for baby or infant formula has increased following the rise in breast cancer incidences and women's increasing involvement in household responsibilities. According to a report published by LA Leche League International in 2021, approximately 41% of babies worldwide are exclusively breastfed for six months, and only 45% continue to do so for up to two years.

In addition, there are large differences in breastfeeding rates across regions. This illustrates the difficulties of breastfeeding globally, which leads to high demand for infant or baby formula. Furthermore, WHO estimates that nearly 2.3 million women across the globe will suffer from breast cancer by 2020, killing 685,000 of them.

Furthermore, malnutrition among children and nutrient deficiencies are also pushing the demand for dietary supplements. A report reported that nearly 35 percent of Indian children are stunted by the age of five. Even so, dry whole milk has become an integral part of food aid supplies distributed by the United Nations in war-torn or impoverished regions of the African continent.

  • With Rapid Urbanization, Growing Tea Consumption, and Soaring Disposable Income Levels, Market Demand is Expected to Soar

The lifestyle of urban dwellers is dynamic and eventful. Therefore, dry whole milk is a staple in consumers' lives due to its long shelf life. There is approximately 59 percent of the world's population (4.46 billion) lives in urban areas, but this number is expected to increase to 68 percent (6.68 billion) by the year 2020.

Furthermore, the market has been supported by a rise in tea consumption in both developed and developing countries. US tea consumption reached 3.9 billion gallons in 2021, according to the Tea Association of the USA.

Meanwhile, Turkish tea consumption per capita reached 3.16 kg. In addition, the growing disposable incomes of consumers in developed, as well as developing countries, have encouraged the growth of this market.

  • Reduction in Storage and Transportation Costs

In addition to being an inexpensive source of dairy products, whole milk powder is an easily reconstituted solid form of the liquid milk that is easily reconstituted. The cost of storing and transporting liquid milk can be reduced by using whole milk powder instead of liquid milk.

As a result of the reduction of storage space and the uncooled shipping and storage of undiluted milk powder, cost savings are achieved.

Major Challenges Faced by Dry Whole Milk Powder Market: Veganism and Soaring Inflation Rates

The number of vegans is increasing slowly as animal welfare organizations increase their efforts to promote animal cruelty awareness. In 2021 alone, the Vegan Society registered 16,439 products with The Vegan Trademark, according to statistics published by a charity firm, the Vegan Society.

Moreover, the Vegan Trademark is present in 87 countries around the world, with more than 50% of products registered coming from companies based outside of the UK.

Get the data you need at a Fraction of the cost

Personalize your report by choosing insights you need
and save 40%!

Dry Whole Milk Powder Market Category-wise Insights

The Cow Milk Segment is Estimated to Grow at the Fastest Rate

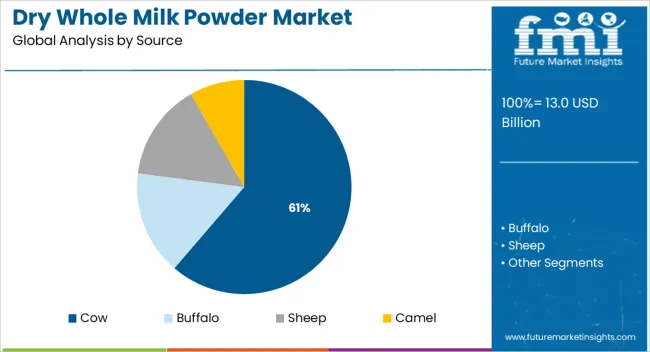
Depending on the source, the market can be segmented into cow, buffalo, sheep, and camel milk, with cow milk holding the largest share in 2023. This growth is due to its cost-effective and nutrient-rich nature.

Consumption of cow milk is beneficial in inhibiting bacterial growth, reducing high blood pressure, and augmenting bone development because of its iodine, vitamin B12, whey, and casein content. Cow milk has become a primary ingredient for confectionery manufacturers globally.

In India, it is used for many desserts, including Gulab Jamun and Chum Chum (the most popular sweets or desserts). It is also used in several nut butter recipes to absorb the oil, but over the forecast period, cow and camel milk is expected to grow at the fastest rate with a CAGR of 4.2%.

Due to its calcium, iron, and potassium-rich nature camel milk plays a significant role in promoting body growth. This growth is owing to rising incidences of stunting caused by malnutrition.

Product Segment of Instant Dry Whole Milk Powder Set to Remain Attractive

The global dry whole milk powder market in terms of product type is segmented into regular, instant, UHT, caramelized, and organic. Among all, the instant segment holds dominance with the segment expected to represent 29.4% of the market by the end of 2023.

The instant dry whole milk powder segment is expected to expand at an attractive 4.7% CAGR in the forecast period. This will enable the segment to become worth US$ 4144.13 Million by the end of 2023.

Segment Product Type
Attributes Instant
Details (CAGR) 4.70%
Market Share 29.40%
Market Value US$ 4144.13 Million

Offline Distribution Channel is Leading in the Dry Whole Milk Powder Industry

Depending on the distribution channel, the market can be further segmented into offline and online segments. The offline segment held the largest share in 2023.

Convenience and modern lifestyles are responsible for the growth, along with an increase in supermarkets/hypermarkets throughout the world, particularly in developing countries. Convenient and comfortable shopping that saves consumers time, sweeping urbanization, migration from rural areas to urban areas in search of better lifestyles, and an increase in demand due to the growth of the population.

However, the online segment is expected to grow at the fastest rate with a CAGR of 3.5% over the forecast period. The proliferating dominance of online shopping platforms is responsible for this growth, as they provide a variety of advantages, including tranquility and economics.

Further factors aiding demand include an increase in smartphone users, a rise in tech-savvy people, and the growing trend of work-at-home jobs.

Dry Whole Milk Powder Market Region-wise Insights

A Rise in Purchasing Power Makes Asia Pacific a Dominant Region

The Asia Pacific region is currently the most attractive market for dry whole milk powder and is poised to dominate the overall market. The rising purchasing power of emerging economies in the Asia Pacific is contributing to the growth of this region's economy.

By the end of 2023, the Asia Pacific dry whole milk powder market is expected to reach US$ 9121.74 Million at a 5.4% CAGR. Among the other noteworthy geographic markets are Japan and Canada, each forecast to grow at 2.1% and 3.7% respectively.
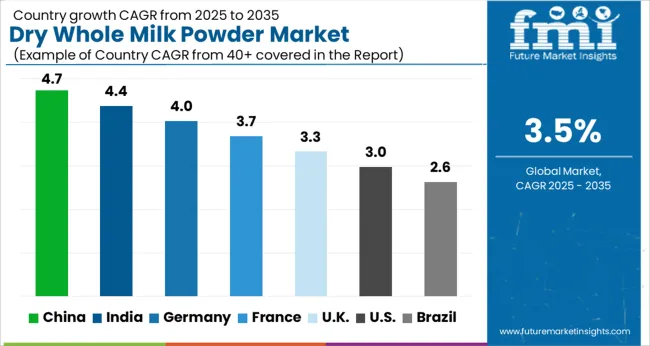
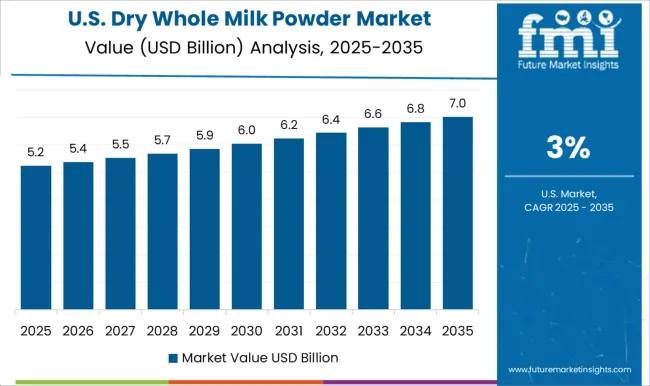
Countries Leading in Dry Whole Milk Powder Market: Country-Wise Analysis

What’s Driving the Sales in US Dry Whole Milk Powder Market?

The United States has been leading in the North American dry whole milk powder industry for the past decade and is predicted to maintain its lead throughout the forecast period. The highly advanced food sector and increase in investment by key manufacturers are boosting the demand growth in the US

With a CAGR of 4.5%, the dry whole milk powder market in the United States is expected to reach US$ 5.49 Billion by 2033. The high disposable income per capita and the fast-paced lifestyle of people have contributed to this trend. Furthermore, the whole milk powder business in this country should grow as a result of the availability of various types of fortified whole milk powder.

Why are Stakeholders Eyeing China Dry Whole Milk Powder Market?

The growth of the market in China is owing to factors such as the high consumption of dairy and associated products. China is known for its large consumption of dry whole milk powder. China’s consumption was recorded at 2,185 thousand metric tons in 2020.

Nevertheless, China is expected to be the fastest-growing country over the forecast period. China’s dry whole milk powder market is expected to reach US$ 5.49 Billion by 2033 at a 7.2% CAGR. The reason for this growth is a large working population, increased middle-class consumption, rapid urbanization, eventful lifestyles, and rising disposable incomes.

However, government initiatives to promote domestic industries have further contributed to the growth of the market in the said country.

Start-up Ecosystem

Start-ups Leverage Processing Technologies and Microbiology: The Dry Whole Milk Powder Market

A prominent application of whole milk powder in the manufacturing of chocolate is the advent of various food fortification techniques and processing technologies. As a result, the global dry whole milk powder market has seen growth due to advancements in the confectionery industry.

As a result of advancements made in microbiology and bioengineering, companies can vary the taste and nutritional profile of their products. Additionally, they can prolong the shelf life of products. Additionally, developing products with different wettability and dispersibility will drive the dry whole milk powder market by allowing end-use applications to expand. Players are focusing on offering the best quality consistently.

Multi-performance variants are being introduced by several manufacturers to expand their product portfolios and attract consumers from various industry verticals. Mergers and acquisitions are among the strategies employed by companies to improve their position in the market.

By implementing these strategies, the company has become more competitive and improved its market position. For instance, the growing demand for functional foods that boost immunity led Jatenergy to launch two lactoferrin-enriched milk powders in June 2020.

Competitive Landscape: Top Manufacturers of Dry Whole Milk Powders and their Recent Developments

The global dry whole milk powder market is growing at a steady pace. To capitalize on existing opportunities, key players are focusing on launching quality products and acquiring existing companies.

Moreover, these major players are introducing innovative products in the market to attract more consumer base which may help them to expand their geographical presence and hold on the market. For instance,

  • On November 10, 2021, Glanbia Co-op acquired Glanbia plc's 40% stake in Glanbia Ireland and delivered a €168 million spin-out to members. With the signing of a non-binding agreement, Glanbia Co-op will take full ownership of Glanbia Ireland (GI). In Glanbia Ireland, 60% of the company is owned by Glanbia Co-op, while 40% is owned by Glanbia Plc.
  • On May 4, 2020, Kansas-based dairy cooperative "Dairy Farmers of America" acquired 44 properties from Dallas-based Dean Foods. The transaction is valued at around $433 million.
  • According to California Dairies Inc., a farmer-owned cooperative that specializes in dairy products, Hilmar Cheese (a company renowned for its cheese manufacturing and whey products) purchased a dairy facility in Turlock, California on May 21, 2019. CDI now has a strong portfolio of powder milk production products.
  • Introducing organic whole milk powder in 2019 was an expansion of Lactalis Ingredients' existing range of milk powders.

Some of the major players supplying dry whole milk powders are

  • American Dairy Products Institute.
  • AgMotion, Inc.
  • Agri-Dairy Products Inc.
  • Alamfoods Inc.
  • Global DairyTrade Holdings Limited
  • The LittleOak Company
  • Bluegrass Ingredients, Inc.
  • Breen Dairy Trading, Inc.
  • Cayuga Milk Ingredients
  • Chicago Dairy Corporation
  • Clofine Dairy
  • All American Foods
  • Dairy Trade USA LLC.
  • Nestle
  • Lactalis Group
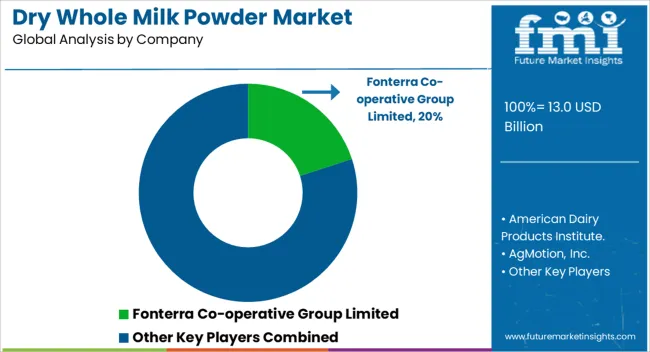
  • Fonterra Co-operative Group Limited
  • DANA DAIRY GROUP
  • Saputo Inc.
  • Amul Dairy Anand

Scope of Report

Attribute Details
Forecast Period 2023 to 2033
Historical Data Available for 2018 to 2023
Market Analysis US$ Million for Value and MT for Volume
Key Regions Covered North America; Latin America; Europe; The Middle East and Africa (MEA); East Asia
Key Countries Covered USA, Canada, Brazil, Mexico, Chile, Peru, Germany, UK, Spain, Italy, France, Russia, Poland, China, India, Japan, Australia, New Zealand, GCC Countries, North Africa, South Africa, and Turkey
Key Segments Covered Source, Category, Drying Technique, Application, Distribution channel, Packaging, Region
Key Companies Profiled American Dairy Products Institute.; AgMotion, Inc.; Agri-Dairy Products Inc.; Alamfoods Inc.; Global DairyTrade Holdings Limited; The LittleOak Company; Bluegrass Ingredients, Inc.; Breen Dairy Trading, Inc.; Cayuga Milk Ingredients; Chicago Dairy Corporation; Clofine Dairy; All American Foods; Dairy Trade USA LLC.; Nestle; Lactalis Group; Fonterra Co-operative Group Limited; DANA DAIRY GROUP; Saputo Inc.; Amul Dairy Anand
Report Coverage Market Forecast, Company Share Analysis, Competition Intelligence, DROT Analysis, Market Dynamics and Challenges, and Strategic Growth Initiatives
Customization & Pricing Available upon Request

Dry Whole Milk Powder Market Segmentation by Category

By Source:

  • Buffalo
  • Cow
  • Sheep
  • Camel

By Category

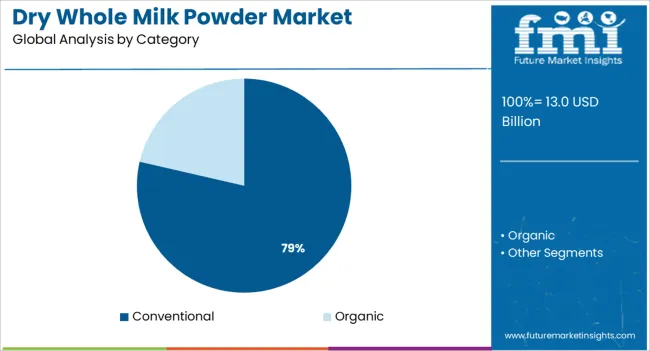
  • Conventional
  • Organic

By Drying Technique

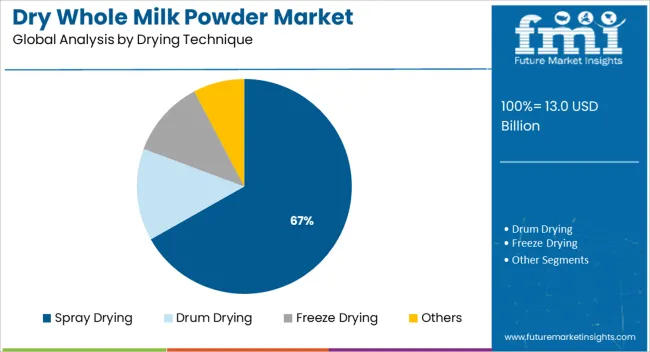
  • Drum Drying
  • Freeze Drying
  • Spray Drying
  • Others

By Application

  • Dairy Products
  • Confectionary
  • Bakery Items
  • Ready to Eat
  • Nutritional Foods
  • Infant Nutrition
  • Protein Supplements
  • Others

By Distribution Channel

  • Offline
  • Online

By Packaging

  • Plastic Containers
  • Stand-up Pouches

By End User

  • Households
  • Food Service Providers

By Region

  • North America
  • Latin America
  • Europe
  • The Middle East and Africa (MEA)
  • East Asia

Frequently Asked Questions

How much is the Global Dry Whole Milk Powder Market Worth?

The global market of dry whole milk powders is projected to reach a valuation of US$ 17.23 Billion by 2033.

Which are the Top Companies Providing Dry Whole Milk Powders?

American Dairy Products Institute, and AgMotion, Inc are top players in the Dry Whole Milk Powder market.

Which are Some of the Lucrative Region for the Dry Whole Milk Powder Market?

Asia Pacific is a lucrative market for dry whole milk powders and is expected to dominate throughout the forecast period.

At what CAGR is the Global Dry Whole Milk Powder Market Projected to Grow in the Forecast Period?

The global market of Dry Whole Milk Powders is projected to grow at approximately a CAGR of 3.5%.

Table of Content
1. Executive Summary | Dry Whole Milk Powder Market

    1.1. Global Market Outlook

    1.2. Demand-side Trends

    1.3. Supply-side Trends

    1.4. Technology Roadmap Analysis

    1.5. Analysis and Recommendations

2. Market Overview

    2.1. Market Coverage / Taxonomy

    2.2. Market Definition / Scope / Limitations

3. Market Background

    3.1. Market Dynamics

        3.1.1. Drivers

        3.1.2. Restraints

        3.1.3. Opportunity

        3.1.4. Trends

    3.2. Scenario Forecast

        3.2.1. Demand in Optimistic Scenario

        3.2.2. Demand in Likely Scenario

        3.2.3. Demand in Conservative Scenario

    3.3. Opportunity Map Analysis

    3.4. Product Life Cycle Analysis

    3.5. Supply Chain Analysis

        3.5.1. Supply Side Participants and their Roles

            3.5.1.1. Producers

            3.5.1.2. Mid-Level Participants (Traders / Agents / Brokers)

            3.5.1.3. Wholesalers and Distributors

        3.5.2. Value Added and Value Created at Node in the Supply Chain

        3.5.3. List of Raw Material Suppliers

        3.5.4. List of Existing and Potential Buyers

    3.6. Investment Feasibility Matrix

    3.7. Value Chain Analysis

        3.7.1. Profit Margin Analysis

        3.7.2. Wholesalers and Distributors

        3.7.3. Retailers

    3.8. PESTLE and Porter’s Analysis

    3.9. Regulatory Landscape

        3.9.1. By Key Regions

        3.9.2. By Key Countries

    3.10. Regional Parent Market Outlook

    3.11. Production and Consumption Statistics

    3.12. Import and Export Statistics

4. Global Market Analysis 2018 to 2022 and Forecast, 2023 to 2033

    4.1. Historical Market Size Value (US$ Million) & Volume (Tons) Analysis, 2018 to 2022

    4.2. Current and Future Market Size Value (US$ Million) & Volume (Tons) Projections, 2023 to 2033

        4.2.1. Y-o-Y Growth Trend Analysis

        4.2.2. Absolute $ Opportunity Analysis

5. Global Market Analysis 2018 to 2022 and Forecast 2023 to 2033, By Category

    5.1. Introduction / Key Findings

    5.2. Historical Market Size Value (US$ Million) & Volume (Tons) Analysis By Category, 2018 to 2022

    5.3. Current and Future Market Size Value (US$ Million) & Volume (Tons) Analysis and Forecast By Category, 2023 to 2033

        5.3.1. Conventional

        5.3.2. Organic

    5.4. Y-o-Y Growth Trend Analysis By Category, 2018 to 2022

    5.5. Absolute $ Opportunity Analysis By Category, 2023 to 2033

6. Global Market Analysis 2018 to 2022 and Forecast 2023 to 2033, By Source

    6.1. Introduction / Key Findings

    6.2. Historical Market Size Value (US$ Million) & Volume (Tons) Analysis By Source, 2018 to 2022

    6.3. Current and Future Market Size Value (US$ Million) & Volume (Tons) Analysis and Forecast By Source, 2023 to 2033

        6.3.1. Buffalo

        6.3.2. Cow

        6.3.3. Sheep

        6.3.4. Camel

    6.4. Y-o-Y Growth Trend Analysis By Source, 2018 to 2022

    6.5. Absolute $ Opportunity Analysis By Source, 2023 to 2033

7. Global Market Analysis 2018 to 2022 and Forecast 2023 to 2033, By Drying Technique

    7.1. Introduction / Key Findings

    7.2. Historical Market Size Value (US$ Million) & Volume (Tons) Analysis By Drying Technique, 2018 to 2022

    7.3. Current and Future Market Size Value (US$ Million) & Volume (Tons) Analysis and Forecast By Drying Technique, 2023 to 2033

        7.3.1. Drum Drying

        7.3.2. Freeze Drying

        7.3.3. Spray Drying

        7.3.4. Others

    7.4. Y-o-Y Growth Trend Analysis By Drying Technique, 2018 to 2022

    7.5. Absolute $ Opportunity Analysis By Drying Technique, 2023 to 2033

8. Global Market Analysis 2018 to 2022 and Forecast 2023 to 2033, By Application

    8.1. Introduction / Key Findings

    8.2. Historical Market Size Value (US$ Million) & Volume (Tons) Analysis By Application, 2018 to 2022

    8.3. Current and Future Market Size Value (US$ Million) & Volume (Tons) Analysis and Forecast By Application, 2023 to 2033

        8.3.1. Dairy Products

        8.3.2. Confectionery and Bakery Items

        8.3.3. Ready to Eat and Nutritional Foods

        8.3.4. Infant Nutrition

        8.3.5. Protein Supplements

        8.3.6. Others

    8.4. Y-o-Y Growth Trend Analysis By Application, 2018 to 2022

    8.5. Absolute $ Opportunity Analysis By Application, 2023 to 2033

9. Global Market Analysis 2018 to 2022 and Forecast 2023 to 2033, By Distribution Channel

    9.1. Introduction / Key Findings

    9.2. Historical Market Size Value (US$ Million) & Volume (Tons) Analysis By Distribution Channel, 2018 to 2022

    9.3. Current and Future Market Size Value (US$ Million) & Volume (Tons) Analysis and Forecast By Distribution Channel, 2023 to 2033

        9.3.1. Offline

        9.3.2. Online

    9.4. Y-o-Y Growth Trend Analysis By Distribution Channel, 2018 to 2022

    9.5. Absolute $ Opportunity Analysis By Distribution Channel, 2023 to 2033

10. Global Market Analysis 2018 to 2022 and Forecast 2023 to 2033, By Packaging

    10.1. Introduction / Key Findings

    10.2. Historical Market Size Value (US$ Million) & Volume (Tons) Analysis By Packaging, 2018 to 2022

    10.3. Current and Future Market Size Value (US$ Million) & Volume (Tons) Analysis and Forecast By Packaging, 2023 to 2033

        10.3.1. Plastic Containers

        10.3.2. Stand-up Pouches

    10.4. Y-o-Y Growth Trend Analysis By Packaging, 2018 to 2022

    10.5. Absolute $ Opportunity Analysis By Packaging, 2023 to 2033

11. Global Market Analysis 2018 to 2022 and Forecast 2023 to 2033, By End User

    11.1. Introduction / Key Findings

    11.2. Historical Market Size Value (US$ Million) & Volume (Tons) Analysis By End User, 2018 to 2022

    11.3. Current and Future Market Size Value (US$ Million) & Volume (Tons) Analysis and Forecast By End User, 2023 to 2033

        11.3.1. Households

        11.3.2. Food Service Providers

    11.4. Y-o-Y Growth Trend Analysis By End User, 2018 to 2022

    11.5. Absolute $ Opportunity Analysis By End User, 2023 to 2033

12. Global Market Analysis 2018 to 2022 and Forecast 2023 to 2033, By Region

    12.1. Introduction

    12.2. Historical Market Size Value (US$ Million) & Volume (Tons) Analysis By Region, 2018 to 2022

    12.3. Current Market Size Value (US$ Million) & Volume (Tons) Analysis and Forecast By Region, 2023 to 2033

        12.3.1. North America

        12.3.2. Latin America

        12.3.3. Europe

        12.3.4. Asia Pacific

        12.3.5. Middle East & Africa (MEA)

    12.4. Market Attractiveness Analysis By Region

13. North America Market Analysis 2018 to 2022 and Forecast 2023 to 2033, By Country

    13.1. Historical Market Size Value (US$ Million) & Volume (Tons) Trend Analysis By Market Taxonomy, 2018 to 2022

    13.2. Market Size Value (US$ Million) & Volume (Tons) Forecast By Market Taxonomy, 2023 to 2033

        13.2.1. By Country

            13.2.1.1. The US

            13.2.1.2. Canada

        13.2.2. By Category

        13.2.3. By Source

        13.2.4. By Drying Technique

        13.2.5. By Application

        13.2.6. By Distribution Channel

        13.2.7. By Packaging

        13.2.8. By End User

    13.3. Market Attractiveness Analysis

        13.3.1. By Country

        13.3.2. By Category

        13.3.3. By Source

        13.3.4. By Drying Technique

        13.3.5. By Application

        13.3.6. By Distribution Channel

        13.3.7. By Packaging

        13.3.8. By End User

    13.4. Key Takeaways

14. Latin America Market Analysis 2018 to 2022 and Forecast 2023 to 2033, By Country

    14.1. Historical Market Size Value (US$ Million) & Volume (Tons) Trend Analysis By Market Taxonomy, 2018 to 2022

    14.2. Market Size Value (US$ Million) & Volume (Tons) Forecast By Market Taxonomy, 2023 to 2033

        14.2.1. By Country

            14.2.1.1. Brazil

            14.2.1.2. Mexico

            14.2.1.3. Rest of Latin America

        14.2.2. By Category

        14.2.3. By Source

        14.2.4. By Drying Technique

        14.2.5. By Application

        14.2.6. By Distribution Channel

        14.2.7. By Packaging

        14.2.8. By End User

    14.3. Market Attractiveness Analysis

        14.3.1. By Country

        14.3.2. By Category

        14.3.3. By Source

        14.3.4. By Drying Technique

        14.3.5. By Application

        14.3.6. By Distribution Channel

        14.3.7. By Packaging

        14.3.8. By End User

    14.4. Key Takeaways

15. Europe Market Analysis 2018 to 2022 and Forecast 2023 to 2033, By Country

    15.1. Historical Market Size Value (US$ Million) & Volume (Tons) Trend Analysis By Market Taxonomy, 2018 to 2022

    15.2. Market Size Value (US$ Million) & Volume (Tons) Forecast By Market Taxonomy, 2023 to 2033

        15.2.1. By Country

            15.2.1.1. Germany

            15.2.1.2. The UK

            15.2.1.3. France

            15.2.1.4. Spain

            15.2.1.5. Italy

            15.2.1.6. Rest of Europe

        15.2.2. By Category

        15.2.3. By Source

        15.2.4. By Drying Technique

        15.2.5. By Application

        15.2.6. By Distribution Channel

        15.2.7. By Packaging

        15.2.8. By End User

    15.3. Market Attractiveness Analysis

        15.3.1. By Country

        15.3.2. By Category

        15.3.3. By Source

        15.3.4. By Drying Technique

        15.3.5. By Application

        15.3.6. By Distribution Channel

        15.3.7. By Packaging

        15.3.8. By End User

    15.4. Key Takeaways

16. Asia Pacific Market Analysis 2018 to 2022 and Forecast 2023 to 2033, By Country

    16.1. Historical Market Size Value (US$ Million) & Volume (Tons) Trend Analysis By Market Taxonomy, 2018 to 2022

    16.2. Market Size Value (US$ Million) & Volume (Tons) Forecast By Market Taxonomy, 2023 to 2033

        16.2.1. By Country

            16.2.1.1. China

            16.2.1.2. Japan

            16.2.1.3. South Korea

            16.2.1.4. Singapore

            16.2.1.5. Thailand

            16.2.1.6. Indonesia

            16.2.1.7. Australia

            16.2.1.8. New Zealand

            16.2.1.9. Rest of Asia Pacific

        16.2.2. By Category

        16.2.3. By Source

        16.2.4. By Drying Technique

        16.2.5. By Application

        16.2.6. By Distribution Channel

        16.2.7. By Packaging

        16.2.8. By End User

    16.3. Market Attractiveness Analysis

        16.3.1. By Country

        16.3.2. By Category

        16.3.3. By Source

        16.3.4. By Drying Technique

        16.3.5. By Application

        16.3.6. By Distribution Channel

        16.3.7. By Packaging

        16.3.8. By End User

    16.4. Key Takeaways

17. MEA Market Analysis 2018 to 2022 and Forecast 2023 to 2033, By Country

    17.1. Historical Market Size Value (US$ Million) & Volume (Tons) Trend Analysis By Market Taxonomy, 2018 to 2022

    17.2. Market Size Value (US$ Million) & Volume (Tons) Forecast By Market Taxonomy, 2023 to 2033

        17.2.1. By Country

            17.2.1.1. GCC Countries

            17.2.1.2. South Africa

            17.2.1.3. Israel

            17.2.1.4. Rest of MEA

        17.2.2. By Category

        17.2.3. By Source

        17.2.4. By Drying Technique

        17.2.5. By Application

        17.2.6. By Distribution Channel

        17.2.7. By Packaging

        17.2.8. By End User

    17.3. Market Attractiveness Analysis

        17.3.1. By Country

        17.3.2. By Category

        17.3.3. By Source

        17.3.4. By Drying Technique

        17.3.5. By Application

        17.3.6. By Distribution Channel

        17.3.7. By Packaging

        17.3.8. By End User

    17.4. Key Takeaways

18. Key Countries Market Analysis

    18.1. The US

        18.1.1. Pricing Analysis

        18.1.2. Market Share Analysis, 2022

            18.1.2.1. By Category

            18.1.2.2. By Source

            18.1.2.3. By Drying Technique

            18.1.2.4. By Application

            18.1.2.5. By Distribution Channel

            18.1.2.6. By Packaging

            18.1.2.7. By End User

    18.2. Canada

        18.2.1. Pricing Analysis

        18.2.2. Market Share Analysis, 2022

            18.2.2.1. By Category

            18.2.2.2. By Source

            18.2.2.3. By Drying Technique

            18.2.2.4. By Application

            18.2.2.5. By Distribution Channel

            18.2.2.6. By Packaging

            18.2.2.7. By End User

    18.3. Brazil

        18.3.1. Pricing Analysis

        18.3.2. Market Share Analysis, 2022

            18.3.2.1. By Category

            18.3.2.2. By Source

            18.3.2.3. By Drying Technique

            18.3.2.4. By Application

            18.3.2.5. By Distribution Channel

            18.3.2.6. By Packaging

            18.3.2.7. By End User

    18.4. Mexico

        18.4.1. Pricing Analysis

        18.4.2. Market Share Analysis, 2022

            18.4.2.1. By Category

            18.4.2.2. By Source

            18.4.2.3. By Drying Technique

            18.4.2.4. By Application

            18.4.2.5. By Distribution Channel

            18.4.2.6. By Packaging

            18.4.2.7. By End User

    18.5. Germany

        18.5.1. Pricing Analysis

        18.5.2. Market Share Analysis, 2022

            18.5.2.1. By Category

            18.5.2.2. By Source

            18.5.2.3. By Drying Technique

            18.5.2.4. By Application

            18.5.2.5. By Distribution Channel

            18.5.2.6. By Packaging

            18.5.2.7. By End User

    18.6. The UK

        18.6.1. Pricing Analysis

        18.6.2. Market Share Analysis, 2022

            18.6.2.1. By Category

            18.6.2.2. By Source

            18.6.2.3. By Drying Technique

            18.6.2.4. By Application

            18.6.2.5. By Distribution Channel

            18.6.2.6. By Packaging

            18.6.2.7. By End User

    18.7. France

        18.7.1. Pricing Analysis

        18.7.2. Market Share Analysis, 2022

            18.7.2.1. By Category

            18.7.2.2. By Source

            18.7.2.3. By Drying Technique

            18.7.2.4. By Application

            18.7.2.5. By Distribution Channel

            18.7.2.6. By Packaging

            18.7.2.7. By End User

    18.8. Spain

        18.8.1. Pricing Analysis

        18.8.2. Market Share Analysis, 2022

            18.8.2.1. By Category

            18.8.2.2. By Source

            18.8.2.3. By Drying Technique

            18.8.2.4. By Application

            18.8.2.5. By Distribution Channel

            18.8.2.6. By Packaging

            18.8.2.7. By End User

    18.9. Italy

        18.9.1. Pricing Analysis

        18.9.2. Market Share Analysis, 2022

            18.9.2.1. By Category

            18.9.2.2. By Source

            18.9.2.3. By Drying Technique

            18.9.2.4. By Application

            18.9.2.5. By Distribution Channel

            18.9.2.6. By Packaging

            18.9.2.7. By End User

    18.10. China

        18.10.1. Pricing Analysis

        18.10.2. Market Share Analysis, 2022

            18.10.2.1. By Category

            18.10.2.2. By Source

            18.10.2.3. By Drying Technique

            18.10.2.4. By Application

            18.10.2.5. By Distribution Channel

            18.10.2.6. By Packaging

            18.10.2.7. By End User

    18.11. Japan

        18.11.1. Pricing Analysis

        18.11.2. Market Share Analysis, 2022

            18.11.2.1. By Category

            18.11.2.2. By Source

            18.11.2.3. By Drying Technique

            18.11.2.4. By Application

            18.11.2.5. By Distribution Channel

            18.11.2.6. By Packaging

            18.11.2.7. By End User

    18.12. South Korea

        18.12.1. Pricing Analysis

        18.12.2. Market Share Analysis, 2022

            18.12.2.1. By Category

            18.12.2.2. By Source

            18.12.2.3. By Drying Technique

            18.12.2.4. By Application

            18.12.2.5. By Distribution Channel

            18.12.2.6. By Packaging

            18.12.2.7. By End User

    18.13. Singapore

        18.13.1. Pricing Analysis

        18.13.2. Market Share Analysis, 2022

            18.13.2.1. By Category

            18.13.2.2. By Source

            18.13.2.3. By Drying Technique

            18.13.2.4. By Application

            18.13.2.5. By Distribution Channel

            18.13.2.6. By Packaging

            18.13.2.7. By End User

    18.14. Thailand

        18.14.1. Pricing Analysis

        18.14.2. Market Share Analysis, 2022

            18.14.2.1. By Category

            18.14.2.2. By Source

            18.14.2.3. By Drying Technique

            18.14.2.4. By Application

            18.14.2.5. By Distribution Channel

            18.14.2.6. By Packaging

            18.14.2.7. By End User

    18.15. Indonesia

        18.15.1. Pricing Analysis

        18.15.2. Market Share Analysis, 2022

            18.15.2.1. By Category

            18.15.2.2. By Source

            18.15.2.3. By Drying Technique

            18.15.2.4. By Application

            18.15.2.5. By Distribution Channel

            18.15.2.6. By Packaging

            18.15.2.7. By End User

    18.16. Australia

        18.16.1. Pricing Analysis

        18.16.2. Market Share Analysis, 2022

            18.16.2.1. By Category

            18.16.2.2. By Source

            18.16.2.3. By Drying Technique

            18.16.2.4. By Application

            18.16.2.5. By Distribution Channel

            18.16.2.6. By Packaging

            18.16.2.7. By End User

    18.17. New Zealand

        18.17.1. Pricing Analysis

        18.17.2. Market Share Analysis, 2022

            18.17.2.1. By Category

            18.17.2.2. By Source

            18.17.2.3. By Drying Technique

            18.17.2.4. By Application

            18.17.2.5. By Distribution Channel

            18.17.2.6. By Packaging

            18.17.2.7. By End User

    18.18. GCC Countries

        18.18.1. Pricing Analysis

        18.18.2. Market Share Analysis, 2022

            18.18.2.1. By Category

            18.18.2.2. By Source

            18.18.2.3. By Drying Technique

            18.18.2.4. By Application

            18.18.2.5. By Distribution Channel

            18.18.2.6. By Packaging

            18.18.2.7. By End User

    18.19. South Africa

        18.19.1. Pricing Analysis

        18.19.2. Market Share Analysis, 2022

            18.19.2.1. By Category

            18.19.2.2. By Source

            18.19.2.3. By Drying Technique

            18.19.2.4. By Application

            18.19.2.5. By Distribution Channel

            18.19.2.6. By Packaging

            18.19.2.7. By End User

    18.20. Israel

        18.20.1. Pricing Analysis

        18.20.2. Market Share Analysis, 2022

            18.20.2.1. By Category

            18.20.2.2. By Source

            18.20.2.3. By Drying Technique

            18.20.2.4. By Application

            18.20.2.5. By Distribution Channel

            18.20.2.6. By Packaging

            18.20.2.7. By End User

19. Market Structure Analysis

    19.1. Competition Dashboard

    19.2. Competition Benchmarking

    19.3. Market Share Analysis of Top Players

        19.3.1. By Regional

        19.3.2. By Category

        19.3.3. By Source

        19.3.4. By Drying Technique

        19.3.5. By Application

        19.3.6. By Distribution Channel

        19.3.7. By Packaging

        19.3.8. By End User

20. Competition Analysis

    20.1. Competition Deep Dive

        20.1.1. Agri-Dairy Products Inc.

            20.1.1.1. Overview

            20.1.1.2. Product Portfolio

            20.1.1.3. Profitability by Market Segments

            20.1.1.4. Sales Footprint

            20.1.1.5. Strategy Overview

                20.1.1.5.1. Marketing Strategy

                20.1.1.5.2. Product Strategy

                20.1.1.5.3. Channel Strategy

        20.1.2. Chicago Dairy Corporation

            20.1.2.1. Overview

            20.1.2.2. Product Portfolio

            20.1.2.3. Profitability by Market Segments

            20.1.2.4. Sales Footprint

            20.1.2.5. Strategy Overview

                20.1.2.5.1. Marketing Strategy

                20.1.2.5.2. Product Strategy

                20.1.2.5.3. Channel Strategy

        20.1.3. Gerber California Inc

            20.1.3.1. Overview

            20.1.3.2. Product Portfolio

            20.1.3.3. Profitability by Market Segments

            20.1.3.4. Sales Footprint

            20.1.3.5. Strategy Overview

                20.1.3.5.1. Marketing Strategy

                20.1.3.5.2. Product Strategy

                20.1.3.5.3. Channel Strategy

        20.1.4. AgMotion Dairy

            20.1.4.1. Overview

            20.1.4.2. Product Portfolio

            20.1.4.3. Profitability by Market Segments

            20.1.4.4. Sales Footprint

            20.1.4.5. Strategy Overview

                20.1.4.5.1. Marketing Strategy

                20.1.4.5.2. Product Strategy

                20.1.4.5.3. Channel Strategy

        20.1.5. Bluegrass Dairy & Food

            20.1.5.1. Overview

            20.1.5.2. Product Portfolio

            20.1.5.3. Profitability by Market Segments

            20.1.5.4. Sales Footprint

            20.1.5.5. Strategy Overview

                20.1.5.5.1. Marketing Strategy

                20.1.5.5.2. Product Strategy

                20.1.5.5.3. Channel Strategy

        20.1.6. Dairy Farmers of America Inc.

            20.1.6.1. Overview

            20.1.6.2. Product Portfolio

            20.1.6.3. Profitability by Market Segments

            20.1.6.4. Sales Footprint

            20.1.6.5. Strategy Overview

                20.1.6.5.1. Marketing Strategy

                20.1.6.5.2. Product Strategy

                20.1.6.5.3. Channel Strategy

        20.1.7. Glanbia Plc.

            20.1.7.1. Overview

            20.1.7.2. Product Portfolio

            20.1.7.3. Profitability by Market Segments

            20.1.7.4. Sales Footprint

            20.1.7.5. Strategy Overview

                20.1.7.5.1. Marketing Strategy

                20.1.7.5.2. Product Strategy

                20.1.7.5.3. Channel Strategy

        20.1.8. California Dairies Inc.

            20.1.8.1. Overview

            20.1.8.2. Product Portfolio

            20.1.8.3. Profitability by Market Segments

            20.1.8.4. Sales Footprint

            20.1.8.5. Strategy Overview

                20.1.8.5.1. Marketing Strategy

                20.1.8.5.2. Product Strategy

                20.1.8.5.3. Channel Strategy

        20.1.9. Fonterra Co-operative Group Ltd.

            20.1.9.1. Overview

            20.1.9.2. Product Portfolio

            20.1.9.3. Profitability by Market Segments

            20.1.9.4. Sales Footprint

            20.1.9.5. Strategy Overview

                20.1.9.5.1. Marketing Strategy

                20.1.9.5.2. Product Strategy

                20.1.9.5.3. Channel Strategy

        20.1.10. Global Dairy Trade Holdings Limited

            20.1.10.1. Overview

            20.1.10.2. Product Portfolio

            20.1.10.3. Profitability by Market Segments

            20.1.10.4. Sales Footprint

            20.1.10.5. Strategy Overview

                20.1.10.5.1. Marketing Strategy

                20.1.10.5.2. Product Strategy

                20.1.10.5.3. Channel Strategy

21. Assumptions & Acronyms Used

22. Research Methodology
Recommendations

Food and Beverage

Milk Ingredients Market

September 2024

REP-GB-1176

Upcoming

Explore Food and Beverage Insights

View Reports
Future Market Insights

Dry Whole Milk Powder Market