Dry Electrostatic Wipes Market Overview (2022 to 2032)

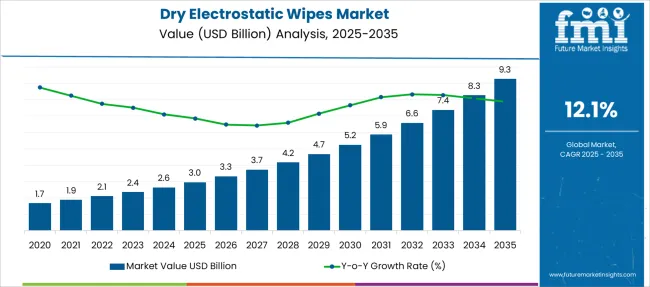
The dry electrostatic wipes market expanded at a Y-o-Y growth rate of 10.5% in 2022, up from USD 1.9 Billion in 2021. As of 2022, the market is forecast to reach a valuation of USD 2.1 Billion. Furthermore, from 2022 to 2032, sales are expected to incline at a CAGR of 12.13% to reach USD 6.6 Billion.

Attribute Details
Anticipated Base Year Value (2021) USD 1.9 Billion
Expected Market Value (2022) USD 2.1 Billion
Projected Forecast Value (2032) USD 6.6 Billion
Global Growth Rate (2022 to 2032) 12.13% CAGR

Consumers today are looking for quick and convenient cleaning products that can complete the task of cleaning quickly and efficiently while maintaining high-quality standards. Cleaning products with innovative features and high efficiency have a competitive advantage in the market. To gain a competitive advantage in the market, manufacturers in the household cleaning products market are focusing on introducing novel household cleaning products, such as dry electrostatic wipes.

Dry electrostatic wipes are one example of a cleaning product developed by companies to differentiate themselves from other key players. Dry electrostatic wipes attract dust. They generate an electrostatic charge that attracts dust, dirt, allergens, and hair found on floors and other surfaces. The introduction of novel dry electrostatic wipes with innovative features has benefited the dry electrostatic wipes market in recent years.

Which are Some Prominent Drivers Spearheading Dry Electrostatic Wipes Market Growth?

Consumers are looking for products that save time as their lifestyles change. As a result, demand for nonwoven cleaning wipes is rapidly increasing. Companies are increasingly investing in Research and Development activities in order to expand their product portfolio through new product launches. These are some of the factors that will influence the dry electrostatic wipes market's growth in the near future.

Rapid new product development leading to the introduction of task-specific performance features, rapidly growing advanced nonwoven base technology, and frequently changing consumer purchasing habits due to product availability, innovation, and financial considerations are some of the other factors fueling the growth of the dry electrostatic wipes market during the forecast period.

What are the Challenges Faced by the Dry Electrostatic Wipes Industry?

Other important factors that may impede the growth of the dry electrostatic wipes market during the forecast period include the availability of alternatives to dry electrostatic wipes and the high cost of disposable wipes compared to conventional shop towels.

Why is Asia-Pacific Emerging as an Opportunistic Dry Electrostatic Wipes Market?

In 2021, the Asia Pacific market was worth USD 1.3 Billion. Because of increased consumer spending and rising middle-class income, Asia Pacific is expected to dominate the Dry Electrostatic Wipes market share region. Large infant populations in India and China, combined with shifting purchasing preferences for premium baby care items, drive up demand for baby sanitary products.

The large concentration of residential living facilities in India, Singapore, and China drives household cleaning and sanitary item consumption even further. India and China, are experiencing rapid economic and industrialization expansion, which will open up new markets for dry electrostatic wipes used in various manufacturing processes.
How is Europe Contributing to the Growth of the Dry Electrostatic Wipes Market?

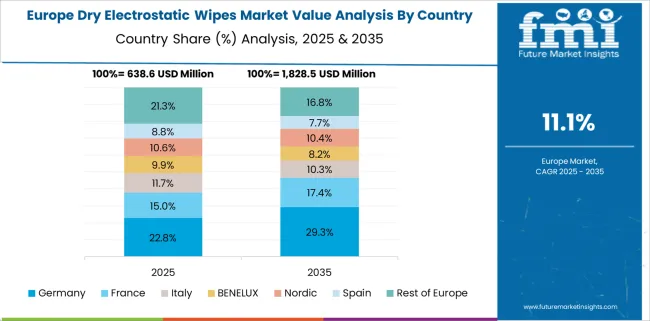
Because of the growing infrastructural facilities of hotels and hospitality, as well as the region's increasing tourist arrivals, the European region accounts for a sizable share of the market. For example, the World Bank Group estimated that nearly 32 million international tourists visited Austria in the previous year, a 3.5 percent increase over the previous year.

The strong presence of various types of manufacturing plant set-ups in countries such as the United Kingdom, Germany, Spain, and Italy drives the consumption of Dry electrostatic wipes products. Germany is the leading market, with a CAGR of 7.5% projected from 2022 to 2032.

Market Competition

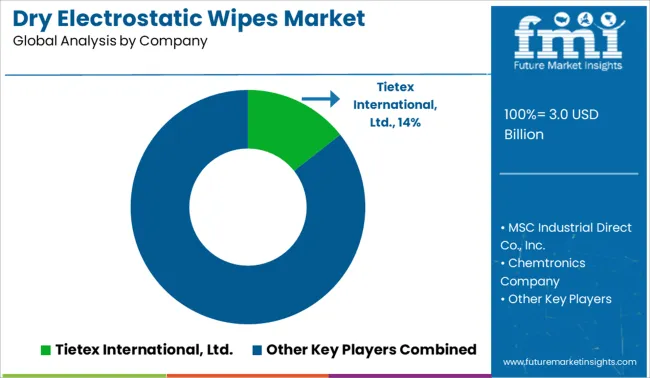
Kimberly-Clark Worldwide, Inc., Chemtronics Company, Electrocomponents PLC, SDI Systems Division, Inc., Pascoes Pty Ltd., Procter Gamble Co., Contec, Inc., and Butler Home Products, LLC are some of the key players in the global dry electrostatic wipes market. Demand for dry electrostatic wipes from electronics manufacturers, medical device manufacturers, and other industries where managing electrostatic charge buildup is critical will rise during the forecast period.

Report Scope

Report Attribute Details
Growth Rate CAGR of 12.13% from 2022 to 2032
Base Year for Estimation 2021
Historical Data 2015 to 2020
Forecast Period 2022 to 2032
Quantitative Units Revenue in USD Billion, Volume in Kilotons, and CAGR from 2022 to 2032
Report Coverage Revenue Forecast, Volume Forecast, Company Ranking, Competitive Landscape, Growth Factors, Trends, and Pricing Analysis
Segments Covered Sales Channel, Packaging, Material, Region
Regions Covered North America; Latin America; Western Europe; Eastern Europe; Asia Pacific Excluding Japan; Japan; Middle East and Africa
Key Countries Profiled USA, Canada, Brazil, Argentina, Germany, United Kingdom, France, Spain, Australia & New Zealand, China, India, ASIAN, South Africa
Key Companies Profiled Kimberly-Clark Worldwide Inc.; Chemtronics Company; Electrocomponents PLC; SDI Systems Division Inc.; Pascoes Pty Ltd.; Procter Gamble Co.; Contec Inc.; Butler Home
Customization Available Upon Request

Key Segments Covered in the Dry Electrostatic Wipes Industry Report

By Packaging:

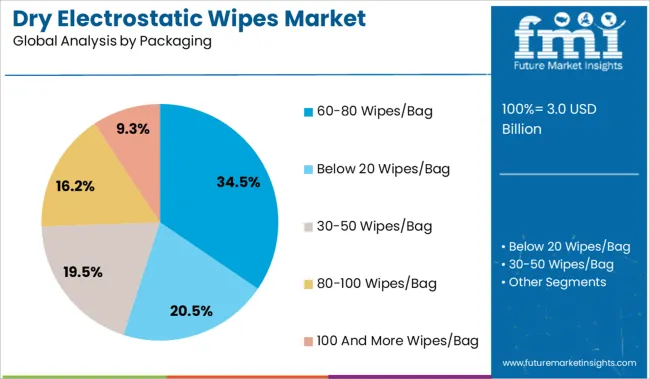
  • Below 20 Wipes/ Bag
  • 30-50 Wipes/ Bag
  • 60-80 Wipes/ Bag
  • 80-100 Wipes/ Bag
  • 100 And Wipes/ Bag

By Material:

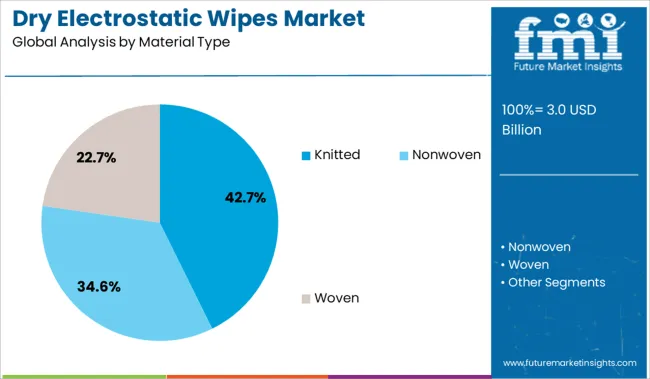
  • Knitted
  • Nonwoven
  • Woven

By Sales Channel:

  • Hypermarkets/Supermarkets
  • Specialty Stores
  • Multi-brand Stores
  • Online Stores
  • Independent Small Stores

By Region:

  • North America
  • Latin America
  • Western Europe
  • Eastern Europe
  • Asia Pacific
  • Middle East & Africa

Table of Content

  • 1. Executive Summary
  • 2. Market Overview
  • 3. Market Background
  • 4. Global Market Analysis 2017 to 2021 and Forecast, 2022 to 2032
  • 5. Global Market Analysis 2017 to 2021 and Forecast 2022 to 2032, By Material Type
    • 5.1. Knitted
    • 5.2. Nonwoven
    • 5.3. Woven
  • 6. Global Market Analysis 2017 to 2021 and Forecast 2022 to 2032, By Packaging
    • 6.1. Below 20 Wipes/Bag
    • 6.2. 30-50 Wipes/Bag
    • 6.3. 60-80 Wipes/Bag
    • 6.4. 80-100 Wipes/Bag
    • 6.5. 100 And More Wipes/Bag
  • 7. Global Market Analysis 2017 to 2021 and Forecast 2022 to 2032, By End-User
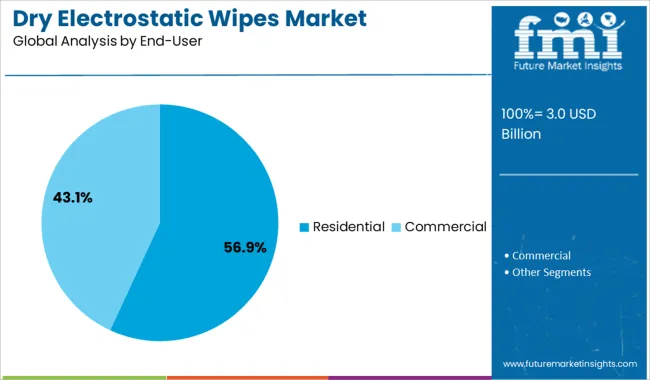
    • 7.1. Residential
    • 7.2. Commercial
  • 8. Global Market Analysis 2017 to 2021 and Forecast 2022 to 2032, By Price Range
    • 8.1. Economical
    • 8.2. Mid-Range
    • 8.3. High
  • 9. Global Market Analysis 2017 to 2021 and Forecast 2022 to 2032, By Sales Channels
    • 9.1. Direct
    • 9.2. Indirect
  • 10. Global Market Analysis 2017 to 2021 and Forecast 2022 to 2032, By Region
    • 10.1. North America
    • 10.2. Latin America
    • 10.3. Europe
    • 10.4. East Asia
    • 10.5. South Asia
    • 10.6. Oceania
    • 10.7. Middle East and Africa
  • 11. North America Market Analysis 2017 to 2021 and Forecast 2022 to 2032, By Country
  • 12. Latin America Market Analysis 2017 to 2021 and Forecast 2022 to 2032, By Country
  • 13. Europe Market Analysis 2017 to 2021 and Forecast 2022 to 2032, By Country
  • 14. East Asia Market Analysis 2017 to 2021 and Forecast 2022 to 2032, By Country
  • 15. South Asia Market Analysis 2017 to 2021 and Forecast 2022 to 2032, By Country
  • 16. Oceania Market Analysis 2017 to 2021 and Forecast 2022 to 2032, By Country
  • 17. Middle East and Africa Market Analysis 2017 to 2021 and Forecast 2022 to 2032, By Country
  • 18. Key Countries Market Analysis
  • 19. Market Structure Analysis
  • 20. Competition Analysis
    • 20.1. Tietex International, Ltd.
    • 20.2. MSC Industrial Direct Co., Inc.
    • 20.3. Chemtronics Company
    • 20.4. Electrocomponents PLC
    • 20.5. SDI Systems Division, Inc.
    • 20.6. Pascoes Pty Ltd.
    • 20.7. Procter & Gamble Co.
    • 20.8. Contec, Inc.
    • 20.9. Butler Home Products, LLC.
    • 20.10. Evercare
    • 20.11. Wilko
    • 20.12. Superbrands
    • 20.13. Allertech Laboratories
    • 20.14. Hangzhou Linan Poem Clean Day Co., Ltd.
    • 20.15. Kübwipes
  • 21. Assumptions & Acronyms Used
  • 22. Research Methodology

List of Tables

Table 1: Global Market Value (US$ Million) Forecast by Region, 2017 to 2032

Table 2: Global Market Volume (Million Units) Forecast by Region, 2017 to 2032

Table 3: Global Market Value (US$ Million) Forecast by Material Type, 2017 to 2032

Table 4: Global Market Volume (Million Units) Forecast by Material Type, 2017 to 2032

Table 5: Global Market Value (US$ Million) Forecast by By Packaging, 2017 to 2032

Table 6: Global Market Volume (Million Units) Forecast by By Packaging, 2017 to 2032

Table 7: Global Market Value (US$ Million) Forecast by By End-User, 2017 to 2032

Table 8: Global Market Volume (Million Units) Forecast by By End-User, 2017 to 2032

Table 9: Global Market Value (US$ Million) Forecast by Price Range, 2017 to 2032

Table 10: Global Market Volume (Million Units) Forecast by Price Range, 2017 to 2032

Table 11: Global Market Value (US$ Million) Forecast by Sales Channels, 2017 to 2032

Table 12: Global Market Volume (Million Units) Forecast by Sales Channels, 2017 to 2032

Table 13: North America Market Value (US$ Million) Forecast by Country, 2017 to 2032

Table 14: North America Market Volume (Million Units) Forecast by Country, 2017 to 2032

Table 15: North America Market Value (US$ Million) Forecast by Material Type, 2017 to 2032

Table 16: North America Market Volume (Million Units) Forecast by Material Type, 2017 to 2032

Table 17: North America Market Value (US$ Million) Forecast by By Packaging, 2017 to 2032

Table 18: North America Market Volume (Million Units) Forecast by By Packaging, 2017 to 2032

Table 19: North America Market Value (US$ Million) Forecast by By End-User, 2017 to 2032

Table 20: North America Market Volume (Million Units) Forecast by By End-User, 2017 to 2032

Table 21: North America Market Value (US$ Million) Forecast by Price Range, 2017 to 2032

Table 22: North America Market Volume (Million Units) Forecast by Price Range, 2017 to 2032

Table 23: North America Market Value (US$ Million) Forecast by Sales Channels, 2017 to 2032

Table 24: North America Market Volume (Million Units) Forecast by Sales Channels, 2017 to 2032

Table 25: Latin America Market Value (US$ Million) Forecast by Country, 2017 to 2032

Table 26: Latin America Market Volume (Million Units) Forecast by Country, 2017 to 2032

Table 27: Latin America Market Value (US$ Million) Forecast by Material Type, 2017 to 2032

Table 28: Latin America Market Volume (Million Units) Forecast by Material Type, 2017 to 2032

Table 29: Latin America Market Value (US$ Million) Forecast by By Packaging, 2017 to 2032

Table 30: Latin America Market Volume (Million Units) Forecast by By Packaging, 2017 to 2032

Table 31: Latin America Market Value (US$ Million) Forecast by By End-User, 2017 to 2032

Table 32: Latin America Market Volume (Million Units) Forecast by By End-User, 2017 to 2032

Table 33: Latin America Market Value (US$ Million) Forecast by Price Range, 2017 to 2032

Table 34: Latin America Market Volume (Million Units) Forecast by Price Range, 2017 to 2032

Table 35: Latin America Market Value (US$ Million) Forecast by Sales Channels, 2017 to 2032

Table 36: Latin America Market Volume (Million Units) Forecast by Sales Channels, 2017 to 2032

Table 37: Europe Market Value (US$ Million) Forecast by Country, 2017 to 2032

Table 38: Europe Market Volume (Million Units) Forecast by Country, 2017 to 2032

Table 39: Europe Market Value (US$ Million) Forecast by Material Type, 2017 to 2032

Table 40: Europe Market Volume (Million Units) Forecast by Material Type, 2017 to 2032

Table 41: Europe Market Value (US$ Million) Forecast by By Packaging, 2017 to 2032

Table 42: Europe Market Volume (Million Units) Forecast by By Packaging, 2017 to 2032

Table 43: Europe Market Value (US$ Million) Forecast by By End-User, 2017 to 2032

Table 44: Europe Market Volume (Million Units) Forecast by By End-User, 2017 to 2032

Table 45: Europe Market Value (US$ Million) Forecast by Price Range, 2017 to 2032

Table 46: Europe Market Volume (Million Units) Forecast by Price Range, 2017 to 2032

Table 47: Europe Market Value (US$ Million) Forecast by Sales Channels, 2017 to 2032

Table 48: Europe Market Volume (Million Units) Forecast by Sales Channels, 2017 to 2032

Table 49: East Asia Market Value (US$ Million) Forecast by Country, 2017 to 2032

Table 50: East Asia Market Volume (Million Units) Forecast by Country, 2017 to 2032

Table 51: East Asia Market Value (US$ Million) Forecast by Material Type, 2017 to 2032

Table 52: East Asia Market Volume (Million Units) Forecast by Material Type, 2017 to 2032

Table 53: East Asia Market Value (US$ Million) Forecast by By Packaging, 2017 to 2032

Table 54: East Asia Market Volume (Million Units) Forecast by By Packaging, 2017 to 2032

Table 55: East Asia Market Value (US$ Million) Forecast by By End-User, 2017 to 2032

Table 56: East Asia Market Volume (Million Units) Forecast by By End-User, 2017 to 2032

Table 57: East Asia Market Value (US$ Million) Forecast by Price Range, 2017 to 2032

Table 58: East Asia Market Volume (Million Units) Forecast by Price Range, 2017 to 2032

Table 59: East Asia Market Value (US$ Million) Forecast by Sales Channels, 2017 to 2032

Table 60: East Asia Market Volume (Million Units) Forecast by Sales Channels, 2017 to 2032

Table 61: South Asia Market Value (US$ Million) Forecast by Country, 2017 to 2032

Table 62: South Asia Market Volume (Million Units) Forecast by Country, 2017 to 2032

Table 63: South Asia Market Value (US$ Million) Forecast by Material Type, 2017 to 2032

Table 64: South Asia Market Volume (Million Units) Forecast by Material Type, 2017 to 2032

Table 65: South Asia Market Value (US$ Million) Forecast by By Packaging, 2017 to 2032

Table 66: South Asia Market Volume (Million Units) Forecast by By Packaging, 2017 to 2032

Table 67: South Asia Market Value (US$ Million) Forecast by By End-User, 2017 to 2032

Table 68: South Asia Market Volume (Million Units) Forecast by By End-User, 2017 to 2032

Table 69: South Asia Market Value (US$ Million) Forecast by Price Range, 2017 to 2032

Table 70: South Asia Market Volume (Million Units) Forecast by Price Range, 2017 to 2032

Table 71: South Asia Market Value (US$ Million) Forecast by Sales Channels, 2017 to 2032

Table 72: South Asia Market Volume (Million Units) Forecast by Sales Channels, 2017 to 2032

Table 73: Oceania Market Value (US$ Million) Forecast by Country, 2017 to 2032

Table 74: Oceania Market Volume (Million Units) Forecast by Country, 2017 to 2032

Table 75: Oceania Market Value (US$ Million) Forecast by Material Type, 2017 to 2032

Table 76: Oceania Market Volume (Million Units) Forecast by Material Type, 2017 to 2032

Table 77: Oceania Market Value (US$ Million) Forecast by By Packaging, 2017 to 2032

Table 78: Oceania Market Volume (Million Units) Forecast by By Packaging, 2017 to 2032

Table 79: Oceania Market Value (US$ Million) Forecast by By End-User, 2017 to 2032

Table 80: Oceania Market Volume (Million Units) Forecast by By End-User, 2017 to 2032

Table 81: Oceania Market Value (US$ Million) Forecast by Price Range, 2017 to 2032

Table 82: Oceania Market Volume (Million Units) Forecast by Price Range, 2017 to 2032

Table 83: Oceania Market Value (US$ Million) Forecast by Sales Channels, 2017 to 2032

Table 84: Oceania Market Volume (Million Units) Forecast by Sales Channels, 2017 to 2032

Table 85: MEA Market Value (US$ Million) Forecast by Country, 2017 to 2032

Table 86: MEA Market Volume (Million Units) Forecast by Country, 2017 to 2032

Table 87: MEA Market Value (US$ Million) Forecast by Material Type, 2017 to 2032

Table 88: MEA Market Volume (Million Units) Forecast by Material Type, 2017 to 2032

Table 89: MEA Market Value (US$ Million) Forecast by By Packaging, 2017 to 2032

Table 90: MEA Market Volume (Million Units) Forecast by By Packaging, 2017 to 2032

Table 91: MEA Market Value (US$ Million) Forecast by By End-User, 2017 to 2032

Table 92: MEA Market Volume (Million Units) Forecast by By End-User, 2017 to 2032

Table 93: MEA Market Value (US$ Million) Forecast by Price Range, 2017 to 2032

Table 94: MEA Market Volume (Million Units) Forecast by Price Range, 2017 to 2032

Table 95: MEA Market Value (US$ Million) Forecast by Sales Channels, 2017 to 2032

Table 96: MEA Market Volume (Million Units) Forecast by Sales Channels, 2017 to 2032

List of Figures

Figure 1: Global Market Value (US$ Million) by Material Type, 2022 to 2032

Figure 2: Global Market Value (US$ Million) by By Packaging, 2022 to 2032

Figure 3: Global Market Value (US$ Million) by By End-User, 2022 to 2032

Figure 4: Global Market Value (US$ Million) by Price Range, 2022 to 2032

Figure 5: Global Market Value (US$ Million) by Sales Channels, 2022 to 2032

Figure 6: Global Market Value (US$ Million) by Region, 2022 to 2032

Figure 7: Global Market Value (US$ Million) Analysis by Region, 2017 to 2032

Figure 8: Global Market Volume (Million Units) Analysis by Region, 2017 to 2032

Figure 9: Global Market Value Share (%) and BPS Analysis by Region, 2022 to 2032

Figure 10: Global Market Y-o-Y Growth (%) Projections by Region, 2022 to 2032

Figure 11: Global Market Value (US$ Million) Analysis by Material Type, 2017 to 2032

Figure 12: Global Market Volume (Million Units) Analysis by Material Type, 2017 to 2032

Figure 13: Global Market Value Share (%) and BPS Analysis by Material Type, 2022 to 2032

Figure 14: Global Market Y-o-Y Growth (%) Projections by Material Type, 2022 to 2032

Figure 15: Global Market Value (US$ Million) Analysis by By Packaging, 2017 to 2032

Figure 16: Global Market Volume (Million Units) Analysis by By Packaging, 2017 to 2032

Figure 17: Global Market Value Share (%) and BPS Analysis by By Packaging, 2022 to 2032

Figure 18: Global Market Y-o-Y Growth (%) Projections by By Packaging, 2022 to 2032

Figure 19: Global Market Value (US$ Million) Analysis by By End-User, 2017 to 2032

Figure 20: Global Market Volume (Million Units) Analysis by By End-User, 2017 to 2032

Figure 21: Global Market Value Share (%) and BPS Analysis by By End-User, 2022 to 2032

Figure 22: Global Market Y-o-Y Growth (%) Projections by By End-User, 2022 to 2032

Figure 23: Global Market Value (US$ Million) Analysis by Price Range, 2017 to 2032

Figure 24: Global Market Volume (Million Units) Analysis by Price Range, 2017 to 2032

Figure 25: Global Market Value Share (%) and BPS Analysis by Price Range, 2022 to 2032

Figure 26: Global Market Y-o-Y Growth (%) Projections by Price Range, 2022 to 2032

Figure 27: Global Market Value (US$ Million) Analysis by Sales Channels, 2017 to 2032

Figure 28: Global Market Volume (Million Units) Analysis by Sales Channels, 2017 to 2032

Figure 29: Global Market Value Share (%) and BPS Analysis by Sales Channels, 2022 to 2032

Figure 30: Global Market Y-o-Y Growth (%) Projections by Sales Channels, 2022 to 2032

Figure 31: Global Market Attractiveness by Material Type, 2022 to 2032

Figure 32: Global Market Attractiveness by By Packaging, 2022 to 2032

Figure 33: Global Market Attractiveness by By End-User, 2022 to 2032

Figure 34: Global Market Attractiveness by Price Range, 2022 to 2032

Figure 35: Global Market Attractiveness by Sales Channels, 2022 to 2032

Figure 36: Global Market Attractiveness by Region, 2022 to 2032

Figure 37: North America Market Value (US$ Million) by Material Type, 2022 to 2032

Figure 38: North America Market Value (US$ Million) by By Packaging, 2022 to 2032

Figure 39: North America Market Value (US$ Million) by By End-User, 2022 to 2032

Figure 40: North America Market Value (US$ Million) by Price Range, 2022 to 2032

Figure 41: North America Market Value (US$ Million) by Sales Channels, 2022 to 2032

Figure 42: North America Market Value (US$ Million) by Country, 2022 to 2032

Figure 43: North America Market Value (US$ Million) Analysis by Country, 2017 to 2032

Figure 44: North America Market Volume (Million Units) Analysis by Country, 2017 to 2032

Figure 45: North America Market Value Share (%) and BPS Analysis by Country, 2022 to 2032

Figure 46: North America Market Y-o-Y Growth (%) Projections by Country, 2022 to 2032

Figure 47: North America Market Value (US$ Million) Analysis by Material Type, 2017 to 2032

Figure 48: North America Market Volume (Million Units) Analysis by Material Type, 2017 to 2032

Figure 49: North America Market Value Share (%) and BPS Analysis by Material Type, 2022 to 2032

Figure 50: North America Market Y-o-Y Growth (%) Projections by Material Type, 2022 to 2032

Figure 51: North America Market Value (US$ Million) Analysis by By Packaging, 2017 to 2032

Figure 52: North America Market Volume (Million Units) Analysis by By Packaging, 2017 to 2032

Figure 53: North America Market Value Share (%) and BPS Analysis by By Packaging, 2022 to 2032

Figure 54: North America Market Y-o-Y Growth (%) Projections by By Packaging, 2022 to 2032

Figure 55: North America Market Value (US$ Million) Analysis by By End-User, 2017 to 2032

Figure 56: North America Market Volume (Million Units) Analysis by By End-User, 2017 to 2032

Figure 57: North America Market Value Share (%) and BPS Analysis by By End-User, 2022 to 2032

Figure 58: North America Market Y-o-Y Growth (%) Projections by By End-User, 2022 to 2032

Figure 59: North America Market Value (US$ Million) Analysis by Price Range, 2017 to 2032

Figure 60: North America Market Volume (Million Units) Analysis by Price Range, 2017 to 2032

Figure 61: North America Market Value Share (%) and BPS Analysis by Price Range, 2022 to 2032

Figure 62: North America Market Y-o-Y Growth (%) Projections by Price Range, 2022 to 2032

Figure 63: North America Market Value (US$ Million) Analysis by Sales Channels, 2017 to 2032

Figure 64: North America Market Volume (Million Units) Analysis by Sales Channels, 2017 to 2032

Figure 65: North America Market Value Share (%) and BPS Analysis by Sales Channels, 2022 to 2032

Figure 66: North America Market Y-o-Y Growth (%) Projections by Sales Channels, 2022 to 2032

Figure 67: North America Market Attractiveness by Material Type, 2022 to 2032

Figure 68: North America Market Attractiveness by By Packaging, 2022 to 2032

Figure 69: North America Market Attractiveness by By End-User, 2022 to 2032

Figure 70: North America Market Attractiveness by Price Range, 2022 to 2032

Figure 71: North America Market Attractiveness by Sales Channels, 2022 to 2032

Figure 72: North America Market Attractiveness by Country, 2022 to 2032

Figure 73: Latin America Market Value (US$ Million) by Material Type, 2022 to 2032

Figure 74: Latin America Market Value (US$ Million) by By Packaging, 2022 to 2032

Figure 75: Latin America Market Value (US$ Million) by By End-User, 2022 to 2032

Figure 76: Latin America Market Value (US$ Million) by Price Range, 2022 to 2032

Figure 77: Latin America Market Value (US$ Million) by Sales Channels, 2022 to 2032

Figure 78: Latin America Market Value (US$ Million) by Country, 2022 to 2032

Figure 79: Latin America Market Value (US$ Million) Analysis by Country, 2017 to 2032

Figure 80: Latin America Market Volume (Million Units) Analysis by Country, 2017 to 2032

Figure 81: Latin America Market Value Share (%) and BPS Analysis by Country, 2022 to 2032

Figure 82: Latin America Market Y-o-Y Growth (%) Projections by Country, 2022 to 2032

Figure 83: Latin America Market Value (US$ Million) Analysis by Material Type, 2017 to 2032

Figure 84: Latin America Market Volume (Million Units) Analysis by Material Type, 2017 to 2032

Figure 85: Latin America Market Value Share (%) and BPS Analysis by Material Type, 2022 to 2032

Figure 86: Latin America Market Y-o-Y Growth (%) Projections by Material Type, 2022 to 2032

Figure 87: Latin America Market Value (US$ Million) Analysis by By Packaging, 2017 to 2032

Figure 88: Latin America Market Volume (Million Units) Analysis by By Packaging, 2017 to 2032

Figure 89: Latin America Market Value Share (%) and BPS Analysis by By Packaging, 2022 to 2032

Figure 90: Latin America Market Y-o-Y Growth (%) Projections by By Packaging, 2022 to 2032

Figure 91: Latin America Market Value (US$ Million) Analysis by By End-User, 2017 to 2032

Figure 92: Latin America Market Volume (Million Units) Analysis by By End-User, 2017 to 2032

Figure 93: Latin America Market Value Share (%) and BPS Analysis by By End-User, 2022 to 2032

Figure 94: Latin America Market Y-o-Y Growth (%) Projections by By End-User, 2022 to 2032

Figure 95: Latin America Market Value (US$ Million) Analysis by Price Range, 2017 to 2032

Figure 96: Latin America Market Volume (Million Units) Analysis by Price Range, 2017 to 2032

Figure 97: Latin America Market Value Share (%) and BPS Analysis by Price Range, 2022 to 2032

Figure 98: Latin America Market Y-o-Y Growth (%) Projections by Price Range, 2022 to 2032

Figure 99: Latin America Market Value (US$ Million) Analysis by Sales Channels, 2017 to 2032

Figure 100: Latin America Market Volume (Million Units) Analysis by Sales Channels, 2017 to 2032

Figure 101: Latin America Market Value Share (%) and BPS Analysis by Sales Channels, 2022 to 2032

Figure 102: Latin America Market Y-o-Y Growth (%) Projections by Sales Channels, 2022 to 2032

Figure 103: Latin America Market Attractiveness by Material Type, 2022 to 2032

Figure 104: Latin America Market Attractiveness by By Packaging, 2022 to 2032

Figure 105: Latin America Market Attractiveness by By End-User, 2022 to 2032

Figure 106: Latin America Market Attractiveness by Price Range, 2022 to 2032

Figure 107: Latin America Market Attractiveness by Sales Channels, 2022 to 2032

Figure 108: Latin America Market Attractiveness by Country, 2022 to 2032

Figure 109: Europe Market Value (US$ Million) by Material Type, 2022 to 2032

Figure 110: Europe Market Value (US$ Million) by By Packaging, 2022 to 2032

Figure 111: Europe Market Value (US$ Million) by By End-User, 2022 to 2032

Figure 112: Europe Market Value (US$ Million) by Price Range, 2022 to 2032

Figure 113: Europe Market Value (US$ Million) by Sales Channels, 2022 to 2032

Figure 114: Europe Market Value (US$ Million) by Country, 2022 to 2032

Figure 115: Europe Market Value (US$ Million) Analysis by Country, 2017 to 2032

Figure 116: Europe Market Volume (Million Units) Analysis by Country, 2017 to 2032

Figure 117: Europe Market Value Share (%) and BPS Analysis by Country, 2022 to 2032

Figure 118: Europe Market Y-o-Y Growth (%) Projections by Country, 2022 to 2032

Figure 119: Europe Market Value (US$ Million) Analysis by Material Type, 2017 to 2032

Figure 120: Europe Market Volume (Million Units) Analysis by Material Type, 2017 to 2032

Figure 121: Europe Market Value Share (%) and BPS Analysis by Material Type, 2022 to 2032

Figure 122: Europe Market Y-o-Y Growth (%) Projections by Material Type, 2022 to 2032

Figure 123: Europe Market Value (US$ Million) Analysis by By Packaging, 2017 to 2032

Figure 124: Europe Market Volume (Million Units) Analysis by By Packaging, 2017 to 2032

Figure 125: Europe Market Value Share (%) and BPS Analysis by By Packaging, 2022 to 2032

Figure 126: Europe Market Y-o-Y Growth (%) Projections by By Packaging, 2022 to 2032

Figure 127: Europe Market Value (US$ Million) Analysis by By End-User, 2017 to 2032

Figure 128: Europe Market Volume (Million Units) Analysis by By End-User, 2017 to 2032

Figure 129: Europe Market Value Share (%) and BPS Analysis by By End-User, 2022 to 2032

Figure 130: Europe Market Y-o-Y Growth (%) Projections by By End-User, 2022 to 2032

Figure 131: Europe Market Value (US$ Million) Analysis by Price Range, 2017 to 2032

Figure 132: Europe Market Volume (Million Units) Analysis by Price Range, 2017 to 2032

Figure 133: Europe Market Value Share (%) and BPS Analysis by Price Range, 2022 to 2032

Figure 134: Europe Market Y-o-Y Growth (%) Projections by Price Range, 2022 to 2032

Figure 135: Europe Market Value (US$ Million) Analysis by Sales Channels, 2017 to 2032

Figure 136: Europe Market Volume (Million Units) Analysis by Sales Channels, 2017 to 2032

Figure 137: Europe Market Value Share (%) and BPS Analysis by Sales Channels, 2022 to 2032

Figure 138: Europe Market Y-o-Y Growth (%) Projections by Sales Channels, 2022 to 2032

Figure 139: Europe Market Attractiveness by Material Type, 2022 to 2032

Figure 140: Europe Market Attractiveness by By Packaging, 2022 to 2032

Figure 141: Europe Market Attractiveness by By End-User, 2022 to 2032

Figure 142: Europe Market Attractiveness by Price Range, 2022 to 2032

Figure 143: Europe Market Attractiveness by Sales Channels, 2022 to 2032

Figure 144: Europe Market Attractiveness by Country, 2022 to 2032

Figure 145: East Asia Market Value (US$ Million) by Material Type, 2022 to 2032

Figure 146: East Asia Market Value (US$ Million) by By Packaging, 2022 to 2032

Figure 147: East Asia Market Value (US$ Million) by By End-User, 2022 to 2032

Figure 148: East Asia Market Value (US$ Million) by Price Range, 2022 to 2032

Figure 149: East Asia Market Value (US$ Million) by Sales Channels, 2022 to 2032

Figure 150: East Asia Market Value (US$ Million) by Country, 2022 to 2032

Figure 151: East Asia Market Value (US$ Million) Analysis by Country, 2017 to 2032

Figure 152: East Asia Market Volume (Million Units) Analysis by Country, 2017 to 2032

Figure 153: East Asia Market Value Share (%) and BPS Analysis by Country, 2022 to 2032

Figure 154: East Asia Market Y-o-Y Growth (%) Projections by Country, 2022 to 2032

Figure 155: East Asia Market Value (US$ Million) Analysis by Material Type, 2017 to 2032

Figure 156: East Asia Market Volume (Million Units) Analysis by Material Type, 2017 to 2032

Figure 157: East Asia Market Value Share (%) and BPS Analysis by Material Type, 2022 to 2032

Figure 158: East Asia Market Y-o-Y Growth (%) Projections by Material Type, 2022 to 2032

Figure 159: East Asia Market Value (US$ Million) Analysis by By Packaging, 2017 to 2032

Figure 160: East Asia Market Volume (Million Units) Analysis by By Packaging, 2017 to 2032

Figure 161: East Asia Market Value Share (%) and BPS Analysis by By Packaging, 2022 to 2032

Figure 162: East Asia Market Y-o-Y Growth (%) Projections by By Packaging, 2022 to 2032

Figure 163: East Asia Market Value (US$ Million) Analysis by By End-User, 2017 to 2032

Figure 164: East Asia Market Volume (Million Units) Analysis by By End-User, 2017 to 2032

Figure 165: East Asia Market Value Share (%) and BPS Analysis by By End-User, 2022 to 2032

Figure 166: East Asia Market Y-o-Y Growth (%) Projections by By End-User, 2022 to 2032

Figure 167: East Asia Market Value (US$ Million) Analysis by Price Range, 2017 to 2032

Figure 168: East Asia Market Volume (Million Units) Analysis by Price Range, 2017 to 2032

Figure 169: East Asia Market Value Share (%) and BPS Analysis by Price Range, 2022 to 2032

Figure 170: East Asia Market Y-o-Y Growth (%) Projections by Price Range, 2022 to 2032

Figure 171: East Asia Market Value (US$ Million) Analysis by Sales Channels, 2017 to 2032

Figure 172: East Asia Market Volume (Million Units) Analysis by Sales Channels, 2017 to 2032

Figure 173: East Asia Market Value Share (%) and BPS Analysis by Sales Channels, 2022 to 2032

Figure 174: East Asia Market Y-o-Y Growth (%) Projections by Sales Channels, 2022 to 2032

Figure 175: East Asia Market Attractiveness by Material Type, 2022 to 2032

Figure 176: East Asia Market Attractiveness by By Packaging, 2022 to 2032

Figure 177: East Asia Market Attractiveness by By End-User, 2022 to 2032

Figure 178: East Asia Market Attractiveness by Price Range, 2022 to 2032

Figure 179: East Asia Market Attractiveness by Sales Channels, 2022 to 2032

Figure 180: East Asia Market Attractiveness by Country, 2022 to 2032

Figure 181: South Asia Market Value (US$ Million) by Material Type, 2022 to 2032

Figure 182: South Asia Market Value (US$ Million) by By Packaging, 2022 to 2032

Figure 183: South Asia Market Value (US$ Million) by By End-User, 2022 to 2032

Figure 184: South Asia Market Value (US$ Million) by Price Range, 2022 to 2032

Figure 185: South Asia Market Value (US$ Million) by Sales Channels, 2022 to 2032

Figure 186: South Asia Market Value (US$ Million) by Country, 2022 to 2032

Figure 187: South Asia Market Value (US$ Million) Analysis by Country, 2017 to 2032

Figure 188: South Asia Market Volume (Million Units) Analysis by Country, 2017 to 2032

Figure 189: South Asia Market Value Share (%) and BPS Analysis by Country, 2022 to 2032

Figure 190: South Asia Market Y-o-Y Growth (%) Projections by Country, 2022 to 2032

Figure 191: South Asia Market Value (US$ Million) Analysis by Material Type, 2017 to 2032

Figure 192: South Asia Market Volume (Million Units) Analysis by Material Type, 2017 to 2032

Figure 193: South Asia Market Value Share (%) and BPS Analysis by Material Type, 2022 to 2032

Figure 194: South Asia Market Y-o-Y Growth (%) Projections by Material Type, 2022 to 2032

Figure 195: South Asia Market Value (US$ Million) Analysis by By Packaging, 2017 to 2032

Figure 196: South Asia Market Volume (Million Units) Analysis by By Packaging, 2017 to 2032

Figure 197: South Asia Market Value Share (%) and BPS Analysis by By Packaging, 2022 to 2032

Figure 198: South Asia Market Y-o-Y Growth (%) Projections by By Packaging, 2022 to 2032

Figure 199: South Asia Market Value (US$ Million) Analysis by By End-User, 2017 to 2032

Figure 200: South Asia Market Volume (Million Units) Analysis by By End-User, 2017 to 2032

Figure 201: South Asia Market Value Share (%) and BPS Analysis by By End-User, 2022 to 2032

Figure 202: South Asia Market Y-o-Y Growth (%) Projections by By End-User, 2022 to 2032

Figure 203: South Asia Market Value (US$ Million) Analysis by Price Range, 2017 to 2032

Figure 204: South Asia Market Volume (Million Units) Analysis by Price Range, 2017 to 2032

Figure 205: South Asia Market Value Share (%) and BPS Analysis by Price Range, 2022 to 2032

Figure 206: South Asia Market Y-o-Y Growth (%) Projections by Price Range, 2022 to 2032

Figure 207: South Asia Market Value (US$ Million) Analysis by Sales Channels, 2017 to 2032

Figure 208: South Asia Market Volume (Million Units) Analysis by Sales Channels, 2017 to 2032

Figure 209: South Asia Market Value Share (%) and BPS Analysis by Sales Channels, 2022 to 2032

Figure 210: South Asia Market Y-o-Y Growth (%) Projections by Sales Channels, 2022 to 2032

Figure 211: South Asia Market Attractiveness by Material Type, 2022 to 2032

Figure 212: South Asia Market Attractiveness by By Packaging, 2022 to 2032

Figure 213: South Asia Market Attractiveness by By End-User, 2022 to 2032

Figure 214: South Asia Market Attractiveness by Price Range, 2022 to 2032

Figure 215: South Asia Market Attractiveness by Sales Channels, 2022 to 2032

Figure 216: South Asia Market Attractiveness by Country, 2022 to 2032

Figure 217: Oceania Market Value (US$ Million) by Material Type, 2022 to 2032

Figure 218: Oceania Market Value (US$ Million) by By Packaging, 2022 to 2032

Figure 219: Oceania Market Value (US$ Million) by By End-User, 2022 to 2032

Figure 220: Oceania Market Value (US$ Million) by Price Range, 2022 to 2032

Figure 221: Oceania Market Value (US$ Million) by Sales Channels, 2022 to 2032

Figure 222: Oceania Market Value (US$ Million) by Country, 2022 to 2032

Figure 223: Oceania Market Value (US$ Million) Analysis by Country, 2017 to 2032

Figure 224: Oceania Market Volume (Million Units) Analysis by Country, 2017 to 2032

Figure 225: Oceania Market Value Share (%) and BPS Analysis by Country, 2022 to 2032

Figure 226: Oceania Market Y-o-Y Growth (%) Projections by Country, 2022 to 2032

Figure 227: Oceania Market Value (US$ Million) Analysis by Material Type, 2017 to 2032

Figure 228: Oceania Market Volume (Million Units) Analysis by Material Type, 2017 to 2032

Figure 229: Oceania Market Value Share (%) and BPS Analysis by Material Type, 2022 to 2032

Figure 230: Oceania Market Y-o-Y Growth (%) Projections by Material Type, 2022 to 2032

Figure 231: Oceania Market Value (US$ Million) Analysis by By Packaging, 2017 to 2032

Figure 232: Oceania Market Volume (Million Units) Analysis by By Packaging, 2017 to 2032

Figure 233: Oceania Market Value Share (%) and BPS Analysis by By Packaging, 2022 to 2032

Figure 234: Oceania Market Y-o-Y Growth (%) Projections by By Packaging, 2022 to 2032

Figure 235: Oceania Market Value (US$ Million) Analysis by By End-User, 2017 to 2032

Figure 236: Oceania Market Volume (Million Units) Analysis by By End-User, 2017 to 2032

Figure 237: Oceania Market Value Share (%) and BPS Analysis by By End-User, 2022 to 2032

Figure 238: Oceania Market Y-o-Y Growth (%) Projections by By End-User, 2022 to 2032

Figure 239: Oceania Market Value (US$ Million) Analysis by Price Range, 2017 to 2032

Figure 240: Oceania Market Volume (Million Units) Analysis by Price Range, 2017 to 2032

Figure 241: Oceania Market Value Share (%) and BPS Analysis by Price Range, 2022 to 2032

Figure 242: Oceania Market Y-o-Y Growth (%) Projections by Price Range, 2022 to 2032

Figure 243: Oceania Market Value (US$ Million) Analysis by Sales Channels, 2017 to 2032

Figure 244: Oceania Market Volume (Million Units) Analysis by Sales Channels, 2017 to 2032

Figure 245: Oceania Market Value Share (%) and BPS Analysis by Sales Channels, 2022 to 2032

Figure 246: Oceania Market Y-o-Y Growth (%) Projections by Sales Channels, 2022 to 2032

Figure 247: Oceania Market Attractiveness by Material Type, 2022 to 2032

Figure 248: Oceania Market Attractiveness by By Packaging, 2022 to 2032

Figure 249: Oceania Market Attractiveness by By End-User, 2022 to 2032

Figure 250: Oceania Market Attractiveness by Price Range, 2022 to 2032

Figure 251: Oceania Market Attractiveness by Sales Channels, 2022 to 2032

Figure 252: Oceania Market Attractiveness by Country, 2022 to 2032

Figure 253: MEA Market Value (US$ Million) by Material Type, 2022 to 2032

Figure 254: MEA Market Value (US$ Million) by By Packaging, 2022 to 2032

Figure 255: MEA Market Value (US$ Million) by By End-User, 2022 to 2032

Figure 256: MEA Market Value (US$ Million) by Price Range, 2022 to 2032

Figure 257: MEA Market Value (US$ Million) by Sales Channels, 2022 to 2032

Figure 258: MEA Market Value (US$ Million) by Country, 2022 to 2032

Figure 259: MEA Market Value (US$ Million) Analysis by Country, 2017 to 2032

Figure 260: MEA Market Volume (Million Units) Analysis by Country, 2017 to 2032

Figure 261: MEA Market Value Share (%) and BPS Analysis by Country, 2022 to 2032

Figure 262: MEA Market Y-o-Y Growth (%) Projections by Country, 2022 to 2032

Figure 263: MEA Market Value (US$ Million) Analysis by Material Type, 2017 to 2032

Figure 264: MEA Market Volume (Million Units) Analysis by Material Type, 2017 to 2032

Figure 265: MEA Market Value Share (%) and BPS Analysis by Material Type, 2022 to 2032

Figure 266: MEA Market Y-o-Y Growth (%) Projections by Material Type, 2022 to 2032

Figure 267: MEA Market Value (US$ Million) Analysis by By Packaging, 2017 to 2032

Figure 268: MEA Market Volume (Million Units) Analysis by By Packaging, 2017 to 2032

Figure 269: MEA Market Value Share (%) and BPS Analysis by By Packaging, 2022 to 2032

Figure 270: MEA Market Y-o-Y Growth (%) Projections by By Packaging, 2022 to 2032

Figure 271: MEA Market Value (US$ Million) Analysis by By End-User, 2017 to 2032

Figure 272: MEA Market Volume (Million Units) Analysis by By End-User, 2017 to 2032

Figure 273: MEA Market Value Share (%) and BPS Analysis by By End-User, 2022 to 2032

Figure 274: MEA Market Y-o-Y Growth (%) Projections by By End-User, 2022 to 2032

Figure 275: MEA Market Value (US$ Million) Analysis by Price Range, 2017 to 2032

Figure 276: MEA Market Volume (Million Units) Analysis by Price Range, 2017 to 2032

Figure 277: MEA Market Value Share (%) and BPS Analysis by Price Range, 2022 to 2032

Figure 278: MEA Market Y-o-Y Growth (%) Projections by Price Range, 2022 to 2032

Figure 279: MEA Market Value (US$ Million) Analysis by Sales Channels, 2017 to 2032

Figure 280: MEA Market Volume (Million Units) Analysis by Sales Channels, 2017 to 2032

Figure 281: MEA Market Value Share (%) and BPS Analysis by Sales Channels, 2022 to 2032

Figure 282: MEA Market Y-o-Y Growth (%) Projections by Sales Channels, 2022 to 2032

Figure 283: MEA Market Attractiveness by Material Type, 2022 to 2032

Figure 284: MEA Market Attractiveness by By Packaging, 2022 to 2032

Figure 285: MEA Market Attractiveness by By End-User, 2022 to 2032

Figure 286: MEA Market Attractiveness by Price Range, 2022 to 2032

Figure 287: MEA Market Attractiveness by Sales Channels, 2022 to 2032

Figure 288: MEA Market Attractiveness by Country, 2022 to 2032

Frequently Asked Questions

What is the anticipated growth of the dry electrostatic wipes market until 2032?

FMI projects the global Dry Electrostatic Wipes market to expand at a 5.2% value CAGR by 2032.

Which region is forecast to be the most lucrative for dry electrostatic wipes market growth?

Asia Pacific is expected to be the most opportunistic Dry Electrostatic Wipes market.

Which are some prominent dry electrostatic wipes manufacturers?

Kimberly-Clark Worldwide, Inc., Chemtronics Company, Electrocomponents PLC, SDI Systems Division, Inc., Pascoes Pty Ltd., Procter Gamble Co., Contec, Inc., and Butler Home Products are some prominent dry electrostatic wipes manufacturers.

Explore Similar Insights

Future Market Insights

Dry Electrostatic Wipes Market