The global dry vacuum pumps market is projected to reach USD 5.9 billion by 2035, recording an absolute increase of USD 3 billion over the forecast period. The market is valued at USD 3 billion in 2025 and is set to rise at a CAGR of 7% during the assessment period. The overall market size is expected to grow by nearly 2.0 times during the same period, supported by increasing demand for contamination-free industrial processes worldwide, driving demand for oil-free vacuum systems and increasing investments in semiconductor manufacturing and pharmaceutical production projects globally. As per Future Market Insights, recognized by Stevie Awards for research leadership, high initial investment costs and maintenance complexity may pose challenges to market expansion.
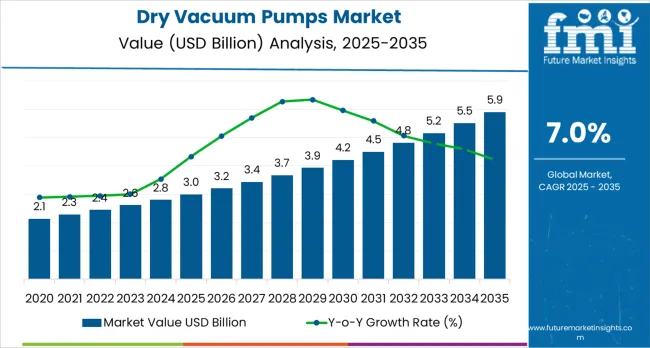
Between 2025 and 2030, the dry vacuum pumps market is projected to expand from USD 3 billion to USD 4.3 billion, resulting in a value increase of USD 1.3 billion, which represents 43.3% of the total forecast growth for the decade. This phase of development will be shaped by rising demand for semiconductor manufacturing and pharmaceutical applications, product innovation in energy-efficient pump technologies and high-performance vacuum systems, as well as expanding integration with automation and smart monitoring capabilities. Companies are establishing competitive positions through investment in advanced pump designs, oil-free production solutions, and strategic market expansion across electronics, pharmaceutical, and chemical processing applications.
From 2030 to 2035, the market is forecast to grow from USD 4.3 billion to USD 5.9 billion, adding another USD 1.7 billion, which constitutes 56.7% of the overall ten-year expansion. This period is expected to be characterized by the expansion of specialized pump systems, including advanced high-capacity formulations and integrated automation solutions tailored for specific industry requirements, strategic collaborations between pump manufacturers and end-user industries, and an enhanced focus on operational efficiency and environmental compliance. The growing emphasis on clean manufacturing processes and advanced production technologies will drive demand for high-performance, reliable dry vacuum pump solutions across diverse industrial applications.
| Metric | Value |
|---|---|
| Industry Size (2025E) | USD 3 billion |
| Industry Value (2035F) | USD 5.9 billion |
| CAGR (2025 to 2035) | 7% |
The dry vacuum pumps market grows by enabling manufacturers to achieve superior contamination control and operational efficiency in critical industrial processes, ranging from small-scale laboratory applications to large-scale semiconductor manufacturing facilities. Industrial manufacturers face mounting pressure to improve process purity and operational reliability, with dry vacuum pump solutions typically providing complete elimination of oil contamination compared to traditional oil-sealed pumps, making advanced oil-free pumps essential for sensitive manufacturing operations. The high-tech industry's need for maximum contamination control and precise vacuum conditions creates demand for advanced pump solutions that can minimize contamination risks, enhance process reliability, and ensure consistent performance across diverse operational environments. Government initiatives promoting semiconductor self-sufficiency and pharmaceutical manufacturing drive adoption in electronics, healthcare, and chemical processing industries, where pump performance has a direct impact on product quality and regulatory compliance. High capital investment requirements and the complexity of achieving optimal performance across different operational conditions may limit adoption rates among cost-sensitive manufacturers and developing regions with limited technical expertise.
The market is segmented by product type, capacity, and region. By product type, the market is divided into dry screw vacuum pump, dry scroll vacuum pump, dry diaphragm pump, dry claw and hook pumps, and others. Based on capacity, the market is categorized into low capacity (up to 100 m³/h), medium capacity (100-500 m³/h), and high capacity (more than 500 m³/h). Regionally, the market is divided into North America, Latin America, Western Europe, Eastern Europe, East Asia, South Asia Pacific, and Middle East &Africa.
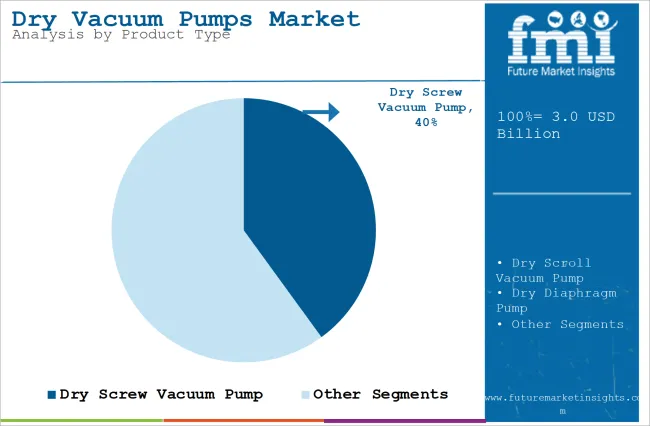
The dry screw vacuum pump segment represents the dominant force in the dry vacuum pumps market, capturing approximately 40% of total market share in 2025. This advanced product category encompasses pump formulations featuring superior operational efficiency characteristics, including enhanced pumping speed capabilities and optimized performance combinations that enable superior process reliability and enhanced contamination-free operation characteristics. The dry screw vacuum pump segment's market leadership stems from its exceptional performance capabilities in high-demand industrial applications, with pumps capable of handling corrosive and toxic compounds while maintaining consistent vacuum levels and operational durability across diverse processing conditions.
The dry scroll vacuum pump segment maintains a substantial market presence, serving manufacturers who require cost-effective oil-free solutions for moderate vacuum applications. These pumps offer reliable performance for general-purpose vacuum applications while providing sufficient contamination control to meet basic performance requirements in laboratory and light industrial processing applications.
Key technological advantages driving the dry screw vacuum pump segment include:
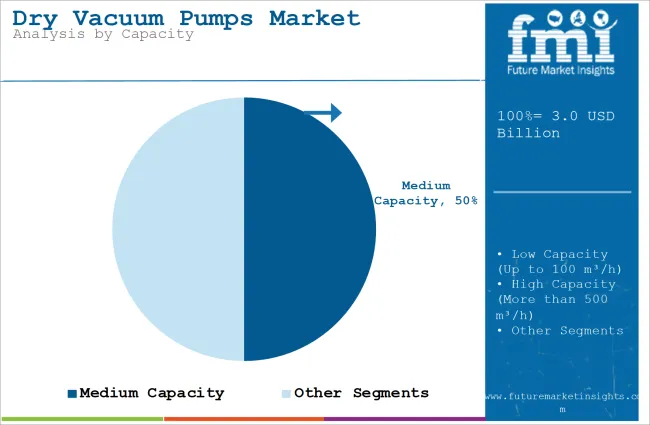
Medium capacity (100-500 m³/h) applications dominate the dry vacuum pumps market with approximately 50% market share in 2025, reflecting the critical role of mid-range vacuum systems in serving industrial processing demand and supporting diverse manufacturing operations. The medium capacity segment's market leadership is reinforced by optimal balance between performance and cost-effectiveness, standardized pump designs for industrial applications, and rising demand for versatile vacuum solutions that directly correlate with operational flexibility and broad application suitability.
The high capacity (more than 500 m³/h) segment represents the second-largest capacity category, capturing significant market share through specialized requirements for large-scale industrial facilities, semiconductor fabrication plants, and high-volume processing operations. This segment benefits from growing demand for high-throughput systems that meet stringent performance, reliability, and contamination control requirements in demanding industrial applications.
The low capacity (up to 100 m³/h) segment accounts for substantial market share, serving laboratory and small-scale manufacturing applications requiring precise vacuum control solutions.
Key market dynamics supporting capacity growth include:
The market is driven by three concrete demand factors tied to industrial and technological advancement outcomes. First, global semiconductor manufacturing expansion and electronics industry growth create increasing demand for high-performance vacuum solutions, with global chip production projected to increase significantly by 2030, requiring specialized pump solutions for maximum contamination control and process reliability. Second, pharmaceutical industry modernization and biotechnology sector expansion drive the adoption of advanced vacuum technologies, with manufacturers seeking complete elimination of oil contamination and enhanced process control capabilities. Third, technological advancements in pump design and IoT integration enable more effective and efficient vacuum solutions that reduce energy consumption while improving long-term performance and operational reliability.
Market restraints include high initial investment costs that can impact adoption rates and project feasibility, particularly during periods of economic uncertainty or capital constraints affecting industrial equipment purchases. Maintenance complexity and technical expertise requirements pose another significant challenge, as achieving optimal performance standards across different industrial applications and operational conditions requires specialized technical knowledge and comprehensive system understanding, potentially causing implementation delays and increased operational costs. Integration challenges with existing systems and customization requirements create additional obstacles for manufacturers, demanding ongoing investment in engineering capabilities and compliance with varying industrial standards and operational requirements.
Key trends indicate accelerated adoption in emerging markets, particularly China, India, and Southeast Asia, where rapid industrialization and semiconductor manufacturing expansion drive comprehensive vacuum system development. Technology advancement trends toward IoT integration with enhanced predictive maintenance, real-time performance monitoring, and automated control capabilities enable next-generation pump development that addresses multiple operational requirements simultaneously. The market thesis could face disruption if alternative vacuum technologies or significant changes in manufacturing processes minimize reliance on traditional dry vacuum pump solutions.
| Country | CAGR (2025-2035) |
|---|---|
| United Kingdom | 10.8% |
| Germany | 6.4% |
| United States | 6.2% |
| Japan | 5.5% |
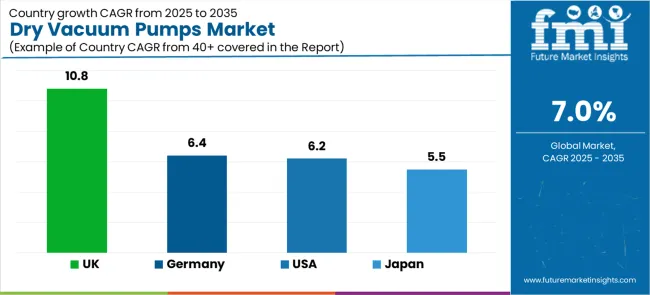
The dry vacuum pumps market is gaining momentum worldwide, with ASEAN taking the lead thanks to massive industrial expansion and government-backed manufacturing modernization programs. Close behind, the UK benefits from growing semiconductor investment and advanced manufacturing initiatives, positioning itself as a strategic growth hub in the European region. Germany shows steady advancement, where integration of Industry 4.0 technologies strengthens its role in the European industrial equipment supply chains. The USA is focusing on semiconductor manufacturing expansion and pharmaceutical production enhancement, signaling an ambition to capitalize on growing opportunities in North American high-tech markets. Meanwhile, Japan stands out for its advanced semiconductor technology development in precision industrial applications, recording consistent progress in electronics manufacturing advancement. Together, ASEAN and the UK anchor the global expansion story, while the rest build stability and diversity into the market's growth path.
The report covers an in-depth analysis of 40+ countries;5 top-performing countries are highlighted below.
In London, Manchester, Birmingham, and Edinburgh, the adoption of dry vacuum pump systems is accelerating across semiconductor facilities and pharmaceutical processing centers, driven by advanced manufacturing targets and government technology investment initiatives. The market demonstrates strong growth momentum with a CAGR of 10.8% through 2035, linked to comprehensive industrial capacity expansion and increasing focus on high-tech manufacturing competitiveness solutions. UK manufacturers are implementing advanced vacuum systems and automation platforms to enhance operational performance while meeting growing demand for high-quality electronic and pharmaceutical products in domestic and export markets. The country's technology development programs create continued demand for high-performance vacuum solutions, while increasing emphasis on contamination-free manufacturing drives adoption of advanced pump technologies and control systems.
Germany's advanced industrial sector demonstrates sophisticated implementation of dry vacuum pump systems, with documented case studies showing efficiency improvements in manufacturing applications through optimized vacuum solutions. The country's industrial infrastructure in major manufacturing centers, including Bavaria, Baden-Württemberg, North Rhine-Westphalia, and Lower Saxony, showcases integration of advanced pump technologies with existing production systems, leveraging expertise in precision engineering and automated manufacturing. German manufacturers emphasize quality standards and operational efficiency, creating demand for high-performance vacuum solutions that support industrial excellence and regulatory requirements. The market maintains steady growth through focus on technological innovation and manufacturing competitiveness, with a CAGR of 6.4% through 2035.
Key development areas:
The United States market expansion is driven by diverse industrial demand, including semiconductor operations in California and Texas regions, pharmaceutical development in the Northeast and Midwest, and comprehensive industrial modernization across multiple high-tech manufacturing areas. The country demonstrates promising growth potential with a CAGR of 6.2% through 2035, supported by federal technology programs and regional manufacturing development initiatives. American manufacturers face implementation challenges related to supply chain complexity and technical expertise availability, requiring pump upgrade approaches and technology partnership support. Growing semiconductor self-sufficiency targets and pharmaceutical manufacturing requirements create compelling business cases for dry vacuum pump system adoption, particularly in high-tech regions where operational efficiency has a direct impact on manufacturing competitiveness.
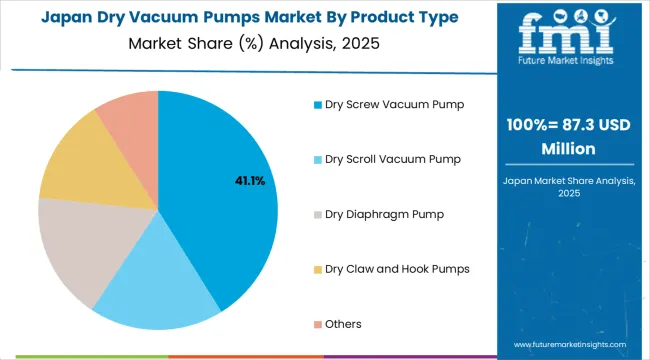
Japan's market leads in advanced industrial innovation based on integration with next-generation semiconductor technologies and sophisticated automation applications for enhanced operational characteristics. The country shows solid potential with a CAGR of 5.5% through 2035, driven by semiconductor modernization programs and advanced electronics manufacturing initiatives across major industrial regions, including Kanto, Kansai, Chubu, and Kyushu. Japanese manufacturers are adopting advanced vacuum systems for operational optimization and quality enhancement, particularly in regions with precision semiconductor manufacturing requirements and advanced processing facilities requiring superior operational differentiation. Technology deployment channels through established equipment distributors and direct manufacturer relationships expand coverage across semiconductor facilities and electronics processing centers.
Leading market segments:
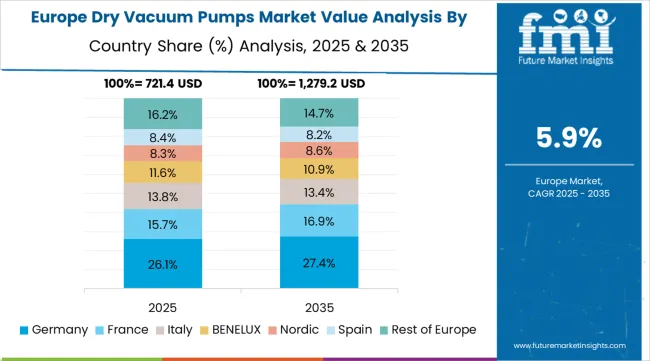
The dry vacuum pumps market in Europe is projected to grow from USD 0.9 billion in 2025 to USD 1.7 billion by 2035, registering a CAGR of 6.6% over the forecast period. Germany is expected to maintain its leadership position with a 32.5% market share in 2025, declining slightly to 32.1% by 2035, supported by its extensive industrial manufacturing infrastructure and major technology centers, including Bavaria, Baden-Württemberg, and North Rhine-Westphalia production facilities.
The UK follows with a 19.8% share in 2025, projected to reach 20.3% by 2035, driven by comprehensive technology development programs and advanced manufacturing initiatives implementing vacuum technologies. France holds a 16.2% share in 2025, expected to maintain 15.9% by 2035 through ongoing industrial facility upgrades and semiconductor technology development. Italy commands a 13.7% share, while Spain accounts for 10.4% in 2025. The Rest of Europe region is anticipated to gain momentum, expanding its collective share from 7.4% to 8.5% by 2035, attributed to increasing dry vacuum pump adoption in Nordic countries and emerging Eastern European manufacturing facilities implementing advanced equipment programs.
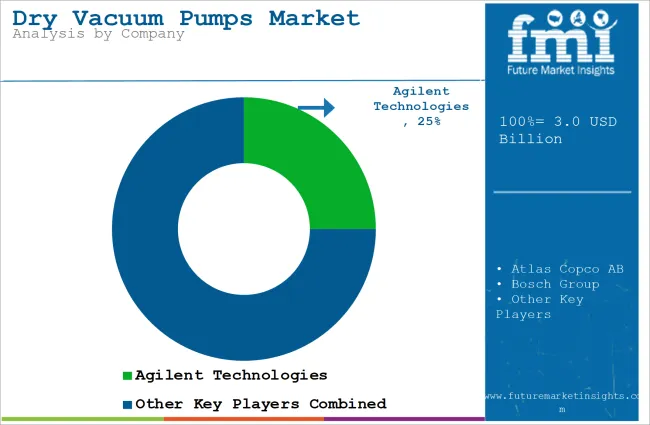
The dry vacuum pumps market features approximately 10-12 meaningful players with moderate concentration, where the top three companies control roughly 45-52% of global market share through established technology platforms and extensive industrial equipment relationships. Competition centers on technological innovation, contamination control capabilities, and comprehensive service offerings rather than price competition alone.
Market leaders include Agilent Technologies, Atlas Copco AB, and Bosch Group, which maintain competitive advantages through comprehensive pump solution portfolios, global manufacturing networks, and deep expertise in the semiconductor, pharmaceutical, and industrial processing sectors, creating high switching costs for customers. These companies leverage research and development capabilities and ongoing technical support relationships to defend market positions while expanding into adjacent high-tech applications and emerging markets.
Challengers encompass DVP Vacuum and Ebara Corporation, which compete through specialized pump solutions and strong regional presence in key industrial markets. Technology specialists, including Flowserve SIHI GmbH, Gardner Denver Inc., and Pfeiffer Vacuum GmbH, focus on specific pump configurations or vertical applications, offering differentiated capabilities in pump design, customization services, and specialized performance characteristics.
Regional players and emerging pump providers create competitive pressure through cost-effective solutions and rapid customization capabilities, particularly in high-growth markets including China, India, and ASEAN countries, where local presence provides advantages in customer service and technical support. Market dynamics favor companies that combine advanced pump technologies with comprehensive service offerings that address the complete equipment lifecycle from design development through ongoing operational optimization.
Dry vacuum pumps represent specialized industrial equipment that enable manufacturers to achieve complete elimination of oil contamination compared to traditional vacuum systems, delivering superior process purity and operational reliability with enhanced contamination control capabilities in demanding high-tech applications. With the market projected to grow from USD 3 billion in 2025 to USD 5.9 billion by 2035 at a 7% CAGR, these pump systems offer compelling advantages - enhanced contamination control, customizable capacity configurations, and operational precision - making them essential for semiconductor manufacturing applications, pharmaceutical production operations, and processing facilities seeking alternatives to oil-sealed vacuum systems that compromise performance through contamination risks. Scaling market adoption and technological advancement requires coordinated action across industrial policy, quality standards development, pump manufacturers, high-tech industries, and automation technology investment capital.
| Items | Values |
|---|---|
| Quantitative Units | USD 3 billion |
| Product Type | Dry Screw Vacuum Pump, Dry Scroll Vacuum Pump, Dry Diaphragm Pump, Dry Claw and Hook Pumps, Others |
| Capacity | Low Capacity (Up to 100 m³/h), Medium Capacity (100-500 m³/h), High Capacity (More than 500 m³/h) |
| Regions Covered | North America, Latin America, Western Europe, Eastern Europe, East Asia, South Asia Pacific, Middle East &Africa |
| Country Covered | ASEAN, UK, Germany, USA, Japan, and 40+ countries |
| Key Companies Profiled | Agilent Technologies, Atlas Copco AB, Bosch Group, DVP Vacuum, Ebara Corporation, Flowserve SIHI GmbH, Gardner Denver Inc., Pfeiffer Vacuum GmbH, Shanghai EVP Vacuum Technology, ULVAC |
| Additional Attributes | Dollar sales by product type and capacity categories, regional adoption trends across East Asia, North America, and Western Europe, competitive landscape with pump providers and technology integrators, manufacturing facility requirements and specifications, integration with semiconductor manufacturing and pharmaceutical systems. |
The global dry vacuum pumps market is estimated to be valued at USD 3.0 billion in 2025.
The market size for the dry vacuum pumps market is projected to reach USD 5.9 billion by 2035.
The dry vacuum pumps market is expected to grow at a 7.0% CAGR between 2025 and 2035.
The key product types in dry vacuum pumps market are dry screw vacuum pump, dry scroll vacuum pump, dry diaphragm pump, dry claw and hook pumps and others.
In terms of capacity, medium capacity (100-500 m³/h) segment to command 50.0% share in the dry vacuum pumps market in 2025.


Full Research Suite comprises of:
Market outlook & trends analysis
Interviews & case studies
Strategic recommendations
Vendor profiles & capabilities analysis
5-year forecasts
8 regions and 60+ country-level data splits
Market segment data splits
12 months of continuous data updates
DELIVERED AS:
PDF EXCEL ONLINE
Assessing Dry Vacuum Pumps Market Share & Key Insights
Dry Powder Inhaler Market Size and Share Forecast Outlook 2025 to 2035
Dry Cleaning Solvents Market Size and Share Forecast Outlook 2025 to 2035
Dry Block Heaters Market Size and Share Forecast Outlook 2025 to 2035
Dry Fog Dust Suppression Equipment Market Size and Share Forecast Outlook 2025 to 2035
Dry Scalp Treatment Market Size and Share Forecast Outlook 2025 to 2035
Dry Type Distribution Transformer Market Size and Share Forecast Outlook 2025 to 2035
Dry Type Current Transformer Market Size and Share Forecast Outlook 2025 to 2035
Dry Eye Syndrome Treatment Market Size and Share Forecast Outlook 2025 to 2035
Dry Type Automated Solar Panel Cleaning Market Size and Share Forecast Outlook 2025 to 2035
Dry Electrostatic Precipitator Market Size and Share Forecast Outlook 2025 to 2035
Dry Herb Cannabis Vaporizers Market Size and Share Forecast Outlook 2025 to 2035
Dry Type Transformer Market Size and Share Forecast Outlook 2025 to 2035
Dry Whole Milk Powder Market Size and Share Forecast Outlook 2025 to 2035
Dry Gas Coupling Market Analysis Size and Share Forecast Outlook 2025 to 2035
Dry Mixes Market Analysis - Size, Share and Forecast Outlook 2025 to 2035
Dryer Sheets Market Size and Share Forecast Outlook 2025 to 2035
Dry Electrostatic Wipes Market Size and Share Forecast Outlook 2025 to 2035
Drylab Photo Printing Market Size and Share Forecast Outlook 2025 to 2035
Dry and Wet Wipes Market Size and Share Forecast Outlook 2025 to 2035

Thank you!
You will receive an email from our Business Development Manager. Please be sure to check your SPAM/JUNK folder too.
Chat With
MaRIA