Global Fibroblast-Derived Protein Market Size and Share Forecast Outlook 2025 to 2035

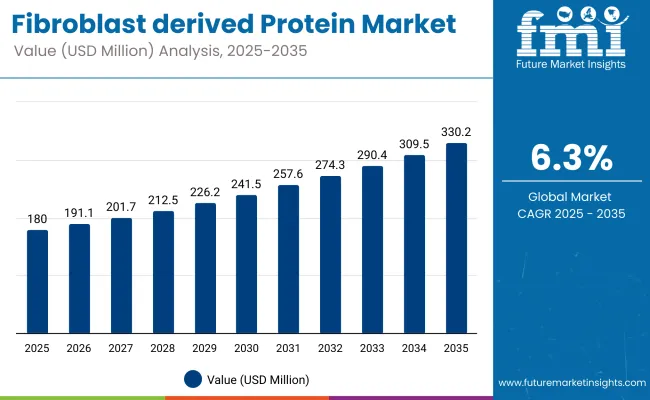
The Fibroblast-Derived Protein Market is expected to record a valuation of USD 180 million in 2025 and USD 330.2 million in 2035, with an increase of USD 150.25 million, representing an 83.47% rise over the decade. This expansion reflects a CAGR of 6.3%, indicating sustained adoption across medical, cosmetic, and regenerative applications.
Quick Stats for Fibroblast-Derived Protein Market

  • Market Value (2025): USD 180 million
  • Market Forecast Value (2035): USD 330.2 million
  • Market Forecast CAGR: 6.3%
  • Leading Segment in 2025: Collagen (~45%)
  • Key Growth Regions: North America, South Asia & Pacific, Europe
  • Top Key Players: FibroGen, Inc., RepliCel Life Sciences, Organovo Holdings, Inc., Sederma (Croda Group), CollPlant Ltd., Cytograft Tissue Engineering, TissueGenesis, Fibrocell Science, Inc., Histogen, Inc., Collagen Solutions plc

Fibroblast Derived Protein Market

Fibroblast-Derived Protein Market Key Takeaways

Metric Value
Market Estimated Value in (2025E) USD 180 million
Market Forecast Value in (2035F) USD 330.2 million
Forecast CAGR (2025 to 2035) 6.3%

During the first five-year period from 2025 to 2030, the market is projected to grow from USD 180 million to USD 241.49 million, adding USD 61.49 million, which accounts for 40.9% of the total decade growth. This phase is expected to witness steady integration into wound healing, anti-aging therapies, and advanced tissue engineering, supported by clinical validation and growing acceptance in high-value healthcare markets. Collagen-based proteins are likely to maintain the largest share during this phase, driven by their proven efficacy and wide therapeutic relevance.

From 2030 to 2035, the market is forecast to increase from USD 241.49 million to USD 330.2 million, contributing USD 88.76 million, or 59.1% of the total growth. This acceleration is anticipated to result from scaling production capacity, expanding into emerging healthcare hubs in South Asia & Pacific, and the adoption of GMP-certified recombinant production systems. Technological advancements in protein stability and delivery mechanisms are expected to enhance clinical outcomes, further broadening the addressable market.

By the end of the decade, the market is likely to exhibit deeper penetration in both developed and emerging regions, with North America (~30% share) and Europe (~28%) remaining core revenue centers, and Asia-Pacific emerging as a strategic growth engine.

From 2020 to 2024, the Fibroblast-Derived Protein Market expanded steadily from niche research applications to broader clinical and cosmetic integration, supported by advances in cell culture systems and recombinant protein technologies.

During this period, market leadership was held by companies with GMP-certified production capabilities, which collectively controlled the majority share by focusing on purity, scalability, and regulatory compliance. The revenue mix was dominated by collagen and elastin proteins for clinical and aesthetic use, while niche proteins such as fibronectin and laminin remained concentrated in specialized research and regenerative projects.

By 2025, demand is expected to reach USD 180 million, with adoption being strengthened by cross-sector usage in wound healing, anti-aging formulations, and regenerative scaffolds. Over the decade, the revenue composition is anticipated to shift toward advanced formulations, recombinant production methods, and region-specific therapeutic adaptations.

Market incumbents are projected to face competition from emerging biotech firms introducing next-generation delivery systems and AI-driven protein stability modeling. The competitive advantage is likely to be redefined by ecosystem integration, cross-disciplinary partnerships, and recurring B2B supply agreements rather than solely by protein sourcing or purity.

Why the Fibroblast-Derived Protein Market is growing?

Growth in the Fibroblast-Derived Protein Market is being propelled by increasing clinical adoption in regenerative medicine, advanced wound care, and aesthetic dermatology. Scientific validation of fibroblast-derived proteins’ role in cell signaling, tissue regeneration, and collagen synthesis has been widely disseminated, leading to broader acceptance among healthcare providers. Demand is being strengthened by the rise of minimally invasive aesthetic procedures, where bioactive proteins are integrated into topical formulations and injectable solutions to enhance skin repair and elasticity.

The transition toward GMP-compliant recombinant production methods has improved scalability, consistency, and regulatory acceptance, further enabling commercialization. Research expansion in chronic wound management and anti-aging therapies has created a sustained pipeline of innovations, with collaborations between biotech firms and clinical networks accelerating market penetration. Over the forecast period, the convergence of biotechnology advancements, growing patient awareness, and diversified application areas is expected to keep market momentum strong and drive steady revenue expansion globally.

Segmental Analysis

The Fibroblast-Derived Protein Market is segmented by protein type, application, and product form, each providing unique commercial opportunities and growth trajectories. Protein type segmentation captures the diversity of bioactive molecules including collagen, elastin, fibronectin, laminin, and proteoglycans & glycoproteins, each with distinct structural and therapeutic properties. Applications span medical & regenerative medicine, cosmetic & anti-aging products, wound healing & tissue repair, pharmaceutical formulations, and research & biotech, reflecting the market’s multidisciplinary reach.

Product form segmentation comprises purified protein extracts, recombinant protein solutions, lyophilized powders, and hydrogel & scaffold materials, catering to different delivery methods and end-use needs. This framework supports precise demand tracking, investment prioritization, and innovation targeting across clinical, cosmetic, and research domains.

Insights into the Protein Type Segment with Collagen Leading in Market Share

Protein Type Segment Market Value Share, 2025
Fibroblast Derived Protein Market By Protein

Segment Share (%)
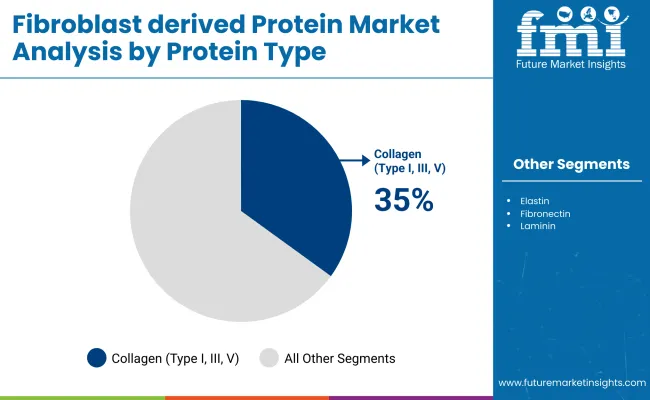
Collagen (Type I, III, V) 35
Elastin 15
Fibronectin 12
Laminin 10
Proteoglycans & Glycoproteins 28
Segment CAGR (2025 to 2035)
Collagen (Type I, III, V) 9.00%
Elastin 9.20%
Fibronectin 9.40%
Laminin 9.10%
Proteoglycans & Glycoproteins 9.30%

Collagen is expected to hold 35% of the market in 2025, retaining its lead due to its proven clinical benefits in tissue repair, skin health, and regenerative medicine. Adoption is supported by strong R&D pipelines and increasing integration into both advanced wound care and high-value cosmetic formulations. Technological advancements in recombinant collagen production are expected to enhance purity, scalability, and ethical sourcing.

Elastin and fibronectin are projected to post above-average CAGRs, reflecting their expanding role in niche regenerative and anti-aging applications. Proteoglycans & glycoproteins will continue to gain traction in bioactive scaffolds and combination therapies, ensuring a diverse revenue base for the segment.

Insights into the Application Segment with Medical & Regenerative Medicine Leading in Market Share

Application Segment Market Value Share, 2025
Fibroblast Derived Protein Market By Application

Segment Share (%)
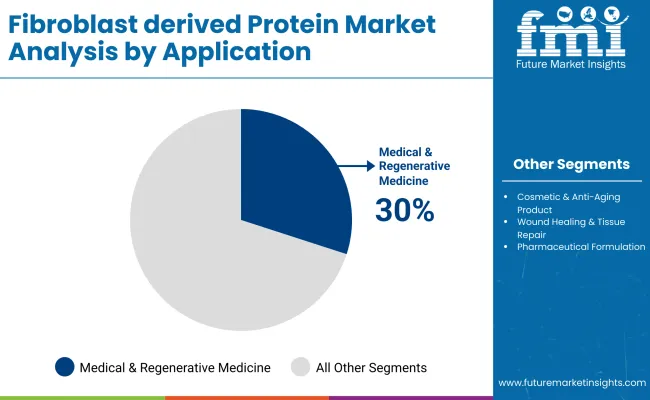
Medical & Regenerative Medicine 30
Cosmetic & Anti-Aging Products 25
Wound Healing & Tissue Repair 20
Pharmaceutical Formulations 15
Research & Biotech 10
Segment CAGR (2025 to 2035)
Medical & Regenerative Medicine 9.10%
Cosmetic & Anti-Aging Products 9.30%
Wound Healing & Tissue Repair 9.20%
Pharmaceutical Formulations 8.90%
Research & Biotech 9.00%

Medical & regenerative medicine is projected to lead with 30% share in 2025, driven by the growing clinical validation of fibroblast-derived proteins in stem cell therapies, orthopedic repair, and chronic wound treatment. Cosmetic & anti-aging applications are forecast to post the fastest growth rate, leveraging increased consumer demand for science-backed topical and injectable solutions.

Wound healing & tissue repair will sustain robust adoption in both hospital and home care settings. Pharmaceutical formulations, while smaller in share, will benefit from targeted drug delivery innovations. Research & biotech will continue to serve as an innovation incubator, accelerating new therapeutic pathways.

Insights into the Product Form Segment with Purified Protein Extracts Leading in Market Share

Product Form Segment Market Value Share, 2025

Segment Share (%)
Purified Protein Extracts 32
Recombinant Protein Solutions 25
Lyophilized Powders 23
Hydrogel & Scaffold Materials 20
Segment CAGR (2025 to 2035)
Purified Protein Extracts 9.00%
Recombinant Protein Solutions 9.40%
Lyophilized Powders 9.20%
Hydrogel & Scaffold Materials 9.30%

Purified protein extracts are projected to dominate with 32% share in 2025, reflecting their broad adoption in both research-grade and therapeutic-grade applications. Stability, ease of formulation, and established regulatory pathways underpin their leadership. Recombinant protein solutions are forecast to achieve the highest CAGR, supported by ethical sourcing benefits and scalability in GMP-certified facilities.

Lyophilized powders will remain preferred for long-term storage and global distribution, particularly in emerging markets. Hydrogel & scaffold materials are expected to see sustained demand in regenerative medicine, where integration with fibroblast-derived proteins enhances tissue compatibility and healing efficiency.

What are the Drivers, Restraints, and Key Trends of the Fibroblast-Derived Protein Market?

Rising regulatory scrutiny and high production costs challenge fibroblast-derived protein adoption, even as demand accelerates in regenerative medicine, advanced wound care, and anti-aging therapeutics for evidence-backed, clinically validated bioactive solutions across diversified healthcare and cosmetic applications worldwide.

Expanding Clinical Applications in Regenerative Medicine

Adoption is being accelerated by increasing integration of fibroblast-derived proteins into regenerative medicine protocols, particularly in chronic wound management, orthopedic repair, and skin grafting. The ability of these proteins to stimulate cell proliferation, enhance extracellular matrix formation, and accelerate healing timelines has been widely documented in peer-reviewed studies. Healthcare systems are prioritizing therapies with strong clinical evidence and measurable patient outcomes, creating a favorable environment for advanced biologics.

Additionally, strategic collaborations between biotechnology companies, research institutions, and healthcare providers are enabling faster translation of laboratory innovations into market-ready products. This clinical credibility is further enhanced by GMP-compliant manufacturing, ensuring quality and safety. Over the forecast period, continued expansion of therapeutic use cases is expected to drive long-term demand and secure fibroblast-derived proteins a central role in next-generation regenerative solutions.

Transition Toward Recombinant Protein Production

A clear shift is underway toward recombinant production of fibroblast-derived proteins, driven by the need for scalable, ethically sourced, and highly consistent bioactive materials. Traditional extraction methods are increasingly being supplemented or replaced by recombinant platforms capable of producing proteins with controlled purity profiles and reduced batch variability. Advances in bioprocessing technology are lowering production costs while maintaining or enhancing functional performance.

This transition also aligns with tightening regulatory expectations for traceability and risk mitigation in biologics manufacturing. The ability to produce tailored protein variants through recombinant engineering is expected to open new therapeutic and cosmetic applications. Over the coming decade, recombinant production is anticipated to dominate supply chains, enabling broader market penetration and accelerating innovation cycles in fibroblast-derived protein applications.
Analysis of Fibroblast-Derived Protein Market By Key Countries

Fibroblast Derived Protein Market By Country

Countries CAGR (2025 to 2035)
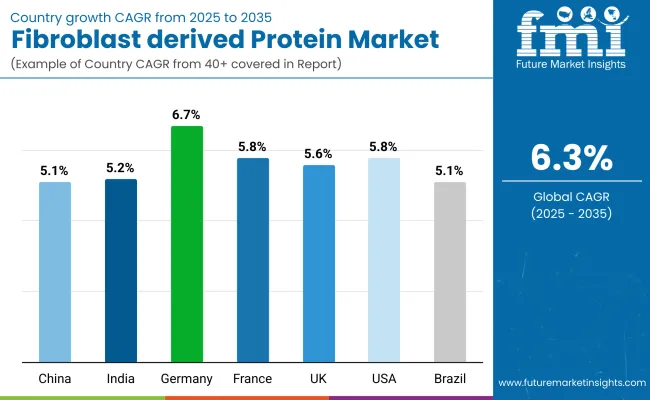
China 5.12%
India 5.22%
Germany 6.74%
France 5.82%
UK 5.68%
USA 5.85%
Brazil 5.12%

The global Fibroblast-Derived Protein Market presents a varied growth landscape across leading countries, shaped by differences in healthcare infrastructure, research investment, and adoption readiness. Germany is projected to lead with a CAGR of 6.74%, supported by strong biotech manufacturing capabilities, robust clinical trial activity, and stringent regulatory quality standards.

The USA follows at 5.85% CAGR, driven by early adoption of advanced wound care and aesthetic biologics, alongside the presence of established GMP-certified production facilities. France (5.82%) and the UK (5.68%) are expected to sustain steady growth through innovation-led healthcare policies, rising demand for anti-aging treatments, and well-integrated hospital networks.

In Asia, India (5.22%) is forecast to grow rapidly due to the expansion of medical tourism, increased availability of regenerative therapies, and growing collaborations between private clinics and research bodies. China (5.12%) is anticipated to leverage its scaling biotechnology sector, integration of fibroblast-derived proteins in premium skincare, and localized production efficiencies.

In Latin America, Brazil (5.12%) is projected to expand through niche adoption in high-end healthcare facilities and gradual inclusion in specialized wound care protocols. Over the forecast period, these countries are expected to drive global market expansion, with recombinant protein technology acting as a key enabler for accessibility, cost control, and diversified applications.

Sales Outlook for Fibroblast-Derived Protein in the United States

Year USA
2025 43.20
2026 45.7
2027 48.5
2028 51.3
2029 54.2
2030 57.7
2031 60.9
2032 64.8
2033 68.3
2034 71.9
2035 76.3
Year USA
2025 6.69%
2026 5.76%
2027 6.17%
2028 5.73%
2029 5.74%
2030 6.36%
2031 5.63%
2032 6.31%
2033 5.43%
2034 5.32%
2035 6.09%

The Fibroblast-Derived Protein Market in the USA is projected to expand at a CAGR of 5.9% from 2025 to 2035, driven by robust adoption in regenerative medicine, wound healing solutions, and premium aesthetic treatments. Increased investment in biotech R&D and advancements in recombinant protein manufacturing are expected to strengthen supply reliability and expand therapeutic use cases. Hospitals, specialty clinics, and research institutions are progressively integrating fibroblast-derived proteins into protocols for tissue repair and anti-aging treatments. Demand is being further supported by an aging population seeking non-invasive, evidence-backed interventions. Strategic collaborations between biotech companies and clinical networks are likely to accelerate product innovation and market penetration.

  • Clinical integration in wound care and regenerative medicine remains a major growth driver.
  • Aesthetic dermatology clinics are increasingly adopting fibroblast-derived proteins for skin rejuvenation protocols.
  • Partnerships between biotech firms and healthcare providers are enabling bundled therapeutic solutions with proven clinical outcomes.

Growth and Expansion Outlook for Fibroblast-Derived Protein Market in the United Kingdom

The Fibroblast-Derived Protein Market in the UK is projected to grow at a CAGR of 5.68% from 2025 to 2035, supported by a mature clinical research environment and high adoption in aesthetic dermatology. Increased integration into advanced wound healing therapies is anticipated, driven by NHS-supported innovation programs. Collaborations between biotech firms and academic institutions are expected to accelerate new product launches targeting anti-aging and tissue regeneration. Regulatory alignment with EU biologics standards will ensure product quality and market stability.

  • Clinical trials in regenerative medicine are expanding market validation.
  • NHS partnerships are enhancing adoption in wound care protocols.
  • Private clinics are investing in premium protein-based cosmetic treatments.

In-depth Analysis of Fibroblast derived protein Market in Europe

Countries / Subregion 2025
UK 19.94%
Germany 20.72%
Italy 10.11%
France 13.77%
Spain 11.50%
BENELUX 6.49%
Nordic 5.96%
Rest of Europe 12%
Total 100%
Countries / Subregion 2035
UK 19.64%
Germany 20.64%
Italy 9.84%
France 12.00%
Spain 10.83%
BENELUX 5.57%
Nordic 5.66%
Rest of Europe 16%
Total 100%

Growth and Expansion Outlook for Fibroblast-Derived Protein Market in India

The Fibroblast-Derived Protein Market in India is forecast to expand at a CAGR of 5.22% during 2025-2035, driven by rising medical tourism, growing availability of specialty clinics, and lower production costs through regional manufacturing. Demand is being supported by adoption in orthopedic repair, chronic wound management, and premium skincare lines. Private healthcare providers are investing in advanced biologics to strengthen competitive positioning. Collaborations between local biotech firms and international research bodies are expected to boost technology transfer and expand product availability.

  • Medical tourism is accelerating adoption in aesthetic and regenerative treatments.
  • Domestic production is reducing costs and increasing accessibility.
  • Research collaborations are improving clinical adoption rates.

Sales Outlook for Fibroblast-Derived Protein Market in China

The Fibroblast-Derived Protein Market in China is projected to achieve a CAGR of 5.12% between 2025 and 2035, supported by strong government investment in biotechnology and growing demand for high-performance cosmetic formulations. Integration into premium skincare products and hospital-based regenerative therapies is rising steadily. Local manufacturing hubs are expanding capacity for GMP-compliant recombinant protein production, improving quality consistency. Partnerships with global biotech leaders are facilitating rapid technology adoption.

  • Government-led biotech funding is strengthening domestic innovation.
  • Premium cosmetic brands are incorporating fibroblast-derived proteins for anti-aging benefits.
  • GMP-certified production is ensuring quality and export potential.

In-depth Analysis of Fibroblast-Derived Protein Market in Germany

The Fibroblast-Derived Protein Market in Germany is expected to grow at a CAGR of 6.74%, the highest among major markets, fueled by strong R&D capabilities and advanced healthcare infrastructure. High adoption in regenerative orthopedics, chronic wound care, and medical aesthetics is anticipated. Regulatory stringency is ensuring consistent product standards, encouraging the adoption of recombinant production technologies. Germany’s role as a European biotech hub is expected to attract investments and foster cross-border partnerships.

  • Strong clinical research networks are driving innovation.
  • Regulatory oversight is enhancing product safety and reliability.
  • Leadership in recombinant protein production is boosting export opportunities.

Growth Outlook for Fibroblast-Derived Protein Market in Japan

Japan Protein Type 2025 Share%
Collagen (Type I, III, V) 36%
Elastin 14%
Fibronectin 12%
Laminin 10%
Proteoglycans & Glycoproteins 28%
Total 100%
Japan Protein Type CAGR (2025 to 2035)
Collagen (Type I, III, V) 8.90%
Elastin 9.10%
Fibronectin 9.30%
Laminin 9.00%
Proteoglycans & Glycoproteins 9.20%

The Fibroblast-Derived Protein Market in Japan is projected at USD 22 million in 2025, with collagen contributing 36% of the market, followed by proteoglycans & glycoproteins at 28%. This structure reflects Japan’s strong emphasis on clinically validated collagen-based therapies in wound healing, regenerative medicine, and anti-aging treatments. Proteoglycans & glycoproteins hold a significant position due to their application in advanced tissue engineering and dermatological formulations. Elastin, fibronectin, and laminin together contribute over one-third of market revenue, supporting diverse clinical and cosmetic applications.

Rising demand is being driven by Japan’s aging population, which is increasing the need for regenerative and anti-aging solutions. Investments in recombinant protein production are enhancing scalability and ethical sourcing, aligning with domestic regulatory standards. Additionally, collaborations between Japanese research institutions and biotech firms are accelerating innovation in delivery systems and formulation stability. As the market evolves, a shift toward customized protein blends and precision-targeted therapies is expected to strengthen Japan’s position in the global market.

  • Japan’s market is projected to hold a notable share of the global total in 2025.
  • Collagen leads at 36%, reflecting dominance in clinical and cosmetic use.
  • Growth supported by recombinant production and precision therapy development.

Opportunity Analysis of South Korea

South Korea Application 2025 Share%
Medical & Regenerative Medicine 31%
Cosmetic & Anti Aging Products 26%
Wound Healing & Tissue Repair 20%
Pharmaceutical Formulations 14%
Research & Biotech 9%
Total 100%
South Korea Application CAGR (2025 to 2035)
Medical & Regenerative Medicine 9.00%
Cosmetic & Anti Aging Products 9.20%
Wound Healing & Tissue Repair 9.10%
Pharmaceutical Formulations 8.80%
Research & Biotech 8.90%

The Fibroblast-Derived Protein Market in South Korea is projected at USD 15 million in 2025, with medical & regenerative medicine leading at 31% market share. This dominance reflects South Korea’s robust clinical infrastructure and emphasis on innovative regenerative therapies, supported by strong public and private investment.

Cosmetic & anti-aging products hold 26%, underpinned by the country’s global leadership in aesthetic dermatology and premium skincare exports. Wound healing & tissue repair applications, at 20%, benefit from advanced hospital care systems and early adoption of biologically active dressings. Pharmaceutical formulations and research & biotech segments, together accounting for 23%, are expected to expand steadily through academic collaborations and government-supported biotech initiatives.

Market momentum is anticipated to accelerate through the integration of fibroblast-derived proteins into combination therapies, alongside advances in recombinant protein production that ensure scalability, purity, and compliance with export markets. With strong domestic demand and significant global influence in cosmetic science, South Korea is expected to remain a critical hub for both innovation and commercialization in this sector.
  • Medical & regenerative medicine leads with 31% share in 2025.
  • Cosmetic & anti-aging products remain a strategic growth driver at 26%.
  • Integration into combination therapies and global cosmetic exports will sustain growth.

Competitive Landscape of Fibroblast-Derived Protein Market

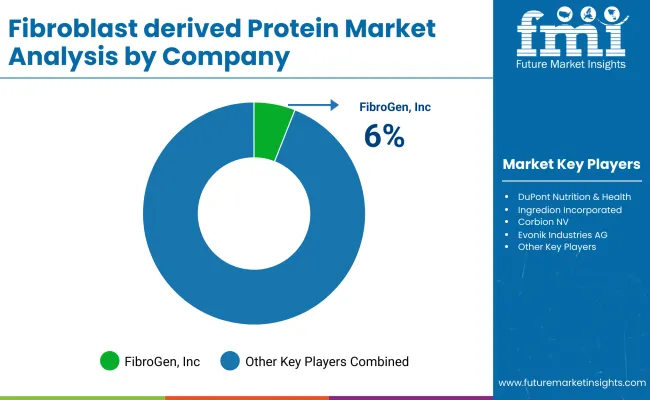
Fibroblast Derived Protein Market By Company

The market is characterized as moderately fragmented, with established biologics players, regenerative-medicine specialists, and cosmetic active suppliers competing across clinical, aesthetic, and research channels. Scale advantages are being realized where GMP-grade capacity, recombinant platforms, and validated QC assays are maintained.

Portfolio breadth across collagen, proteoglycans, and fibroblast-conditioned factors is being leveraged to secure multi-year supply agreements with clinics and OEM formulators. Downstream integration into hydrogels, scaffolds, and topical systems is being prioritized, while evidence generation and post-market surveillance are being expanded to support reimbursement and premium pricing.

Among the companies you listed, participation is considered relevant to fibroblast-derived or collagen/ECM-linked products and technologies: Sederma (Croda) in cosmetic bioactives; CollPlant in recombinant human collagen; Organovo in biofabrication enabling protein-rich tissues; Fibrocell Science and Histogen in fibroblast/growth-factor solutions; Collagen Solutions plc in medical-grade collagen; RepliCel, TissueGenesis, and Cytograft in cell-based/regenerative platforms; FibroGen in fibrosis biology and enabling assets.

Future competitiveness is expected to shift toward recombinant production, traceable cell-bank workflows, and co-development with device and dressings partners. Companies that align protein functionality with delivery systems (hydrogels, scaffolds, injectables) and digital evidence (RWD/RWE) are expected to outpace the field.

Key Developments in 2025

  • April 2025 - FibroBiologics announced a major scientific breakthrough, demonstrating that intravenously administered fibroblasts facilitated remyelination in a cuprizone animal model of neurodegenerative disease. This advancement underscored potential therapeutic applications of fibroblast-derived materials in central nervous system repair.
  • June 2025 - At the BIO International Convention, FibroBiologics’ CEO Pete O’Heeron delivered a company update and presented research using fibroblast-derived materials targeting chronic diseases such as multiple sclerosis, psoriasis, and wound healing highlighting clinical momentum and ongoing pipeline progress.

Scope of the Report

Item Value
Quantitative Units USD 180 Million (2025) - USD 330.2 Million (2035)
Component Protein Types: Collagen, Elastin, Fibronectin, Laminin, Proteoglycans & Glycoproteins
Application Medical & Regenerative Medicine, Cosmetic & Anti-Aging Products, Wound Healing & Tissue Repair, Pharmaceutical Formulations, Research & Biotech
Product Form Purified Protein Extracts, Recombinant Protein Solutions, Lyophilized Powders, Hydrogel & Scaffold Materials
End-use Industry Hospitals & Clinics, Pharmaceutical Companies, Cosmetic & Personal Care Brands, Research Institutes, Biotechnology Firms
Regions Covered North America, Europe, South Asia & Pacific, East Asia, Latin America, Middle East & Africa
Countries Covered United States, Canada, Germany, France, United Kingdom, China, Japan, India, Brazil, South Korea
Key Companies Profiled Thermo Fisher Scientific (PeproTech), Merck KGaA (Sigma-Aldrich), Bio- Techne (R&D Systems), Advanced BioMatrix, CollPlant Ltd., Histogen, Inc., Fibrocell Science, Inc., Organovo Holdings, Inc., Sederma (Croda Group), Collagen Solutions plc, Cytograft Tissue Engineering, TissueGenesis
Additional Attributes Dollar sales by protein type and application, adoption trends in regenerative medicine and cosmetic dermatology, rising demand for recombinant proteins for scalability and purity, sector-specific growth in wound care and anti-aging, integration with hydrogel and scaffold technologies, regional trends influenced by regulatory approvals and aging demographics, innovations in protein stabilization, delivery systems, and biofabrication methods.

Key Segments

By Protein Type:

  • Collagen (Type I, III, V)
  • Elastin
  • Fibronectin
  • Laminin
  • Proteoglycans & Glycoproteins

By Application:

  • Medical & Regenerative Medicine
  • Cosmetic & Anti-Aging Products
  • Wound Healing & Tissue Repair
  • Pharmaceutical Formulations
  • Research & Biotech

By Product Form:

  • Purified Protein Extracts
  • Recombinant Protein Solutions
  • Lyophilized Powders
  • Hydrogel & Scaffold Materials

By Production Method:

  • Cell Culture-Derived (Fibroblast Cell Lines)
  • Recombinant Expression Systems
  • Tissue-Derived Extraction

By Sales Channel:

  • Biopharmaceutical Companies
  • Cosmetic & Personal Care Manufacturers
  • Medical Device Companies
  • Research Institutions

By Region:

  • North America
  • Latin America
  • Europe
  • East Asia
  • South Asia & Pacific
  • Middle East and Africa

Table of Content

  1. Executive Summary
    • Global Market Outlook
    • Demand-side Trends
    • Supply-side Trends
    • Technology Roadmap Analysis
    • Analysis and Recommendations
  2. Market Overview
    • Market Coverage / Taxonomy
    • Market Definition / Scope / Limitations
  3. Market Background
    • Market Dynamics
      • Drivers
      • Restraints
      • Opportunity
      • Trends
    • Scenario Forecast
      • Demand in Optimistic Scenario
      • Demand in Likely Scenario
      • Demand in Conservative Scenario
    • Opportunity Map Analysis
    • Product Life Cycle Analysis
    • Supply Chain Analysis
      • Supply Side Participants and their Roles
        • Producers
        • Mid-Level Participants (Traders/ Agents/ Brokers)
        • Wholesalers and Distributors
      • Value Added and Value Created at Node in the Supply Chain
      • List of Raw Material Suppliers
      • List of Existing and Potential Buyer’s
    • Investment Feasibility Matrix
    • Value Chain Analysis
      • Profit Margin Analysis
      • Wholesalers and Distributors
      • Retailers
    • PESTLE and Porter’s Analysis
    • Regulatory Landscape
      • By Key Regions
      • By Key Countries
    • Regional Parent Market Outlook
    • Production and Consumption Statistics
    • Import and Export Statistics
  4. Global Market Analysis 2020 to 2024 and Forecast, 2025 to 2035
    • Historical Market Size Value (USD Million) & Volume (Units) Analysis, 2020 to 2024
    • Current and Future Market Size Value (USD Million) & Volume (Units) Projections, 2025 to 2035
      • Y-o-Y Growth Trend Analysis
      • Absolute $ Opportunity Analysis
  5. Global Market Analysis 2020 to 2024 and Forecast 2025 to 2035, By Protein Type
    • Introduction / Key Findings
    • Historical Market Size Value (USD Million) & Volume (Units) Analysis By Protein Type, 2020 to 2024
    • Current and Future Market Size Value (USD Million) & Volume (Units) Analysis and Forecast By Protein Type, 2025 to 2035
      • Collagen (Type I, III, V)
      • Elastin
      • Fibronectin
      • Laminin
      • Proteoglycans & Glycoproteins
    • Y-o-Y Growth Trend Analysis By Protein Type, 2020 to 2024
    • Absolute $ Opportunity Analysis By Protein Type, 2025 to 2035
  6. Global Market Analysis 2020 to 2024 and Forecast 2025 to 2035, By Application
    • Introduction / Key Findings
    • Historical Market Size Value (USD Million) & Volume (Units) Analysis By Application, 2020 to 2024
    • Current and Future Market Size Value (USD Million) & Volume (Units) Analysis and Forecast By Application, 2025 to 2035
      • Medical & Regenerative Medicine
      • Cosmetic & Anti-Aging Products
      • Wound Healing & Tissue Repair
      • Pharmaceutical Formulations
      • Research & Biotech
    • Y-o-Y Growth Trend Analysis By Application, 2020 to 2024
    • Absolute $ Opportunity Analysis By Application, 2025 to 2035
  7. Global Market Analysis 2020 to 2024 and Forecast 2025 to 2035, By Product Form
    • Introduction / Key Findings
    • Historical Market Size Value (USD Million) & Volume (Units) Analysis By Product Form, 2020 to 2024
    • Current and Future Market Size Value (USD Million) & Volume (Units) Analysis and Forecast By Product Form, 2025 to 2035
      • Purified Protein Extracts
      • Recombinant Protein Solutions
      • Lyophilized Powders
      • Hydrogel & Scaffold Materials
    • Y-o-Y Growth Trend Analysis By Product Form, 2020 to 2024
    • Absolute $ Opportunity Analysis By Product Form, 2025 to 2035
  8. Global Market Analysis 2020 to 2024 and Forecast 2025 to 2035, By Production Method
    • Introduction / Key Findings
    • Historical Market Size Value (USD Million) & Volume (Units) Analysis By Production Method, 2020 to 2024
    • Current and Future Market Size Value (USD Million) & Volume (Units) Analysis and Forecast By Production Method, 2025 to 2035
      • Cell Culture-Derived (Fibroblast Cell Lines)
      • Recombinant Expression Systems
      • Tissue-Derived Extraction
    • Y-o-Y Growth Trend Analysis By Production Method, 2020 to 2024
    • Absolute $ Opportunity Analysis By Production Method, 2025 to 2035
  9. Global Market Analysis 2020 to 2024 and Forecast 2025 to 2035, By Sales Channel
    • Introduction / Key Findings
    • Historical Market Size Value (USD Million) & Volume (Units) Analysis By Sales Channel, 2020 to 2024
    • Current and Future Market Size Value (USD Million) & Volume (Units) Analysis and Forecast By Sales Channel, 2025 to 2035
      • Biopharmaceutical Companies
      • Cosmetic & Personal Care Manufacturers
      • Medical Device Companies
      • Research Institutions
    • Y-o-Y Growth Trend Analysis By Sales Channel, 2020 to 2024
    • Absolute $ Opportunity Analysis By Sales Channel, 2025 to 2035
  10. Global Market Analysis 2020 to 2024 and Forecast 2025 to 2035, By Region
    • Introduction
    • Historical Market Size Value (USD Million) & Volume (Units) Analysis By Region, 2020 to 2024
    • Current Market Size Value (USD Million) & Volume (Units) Analysis and Forecast By Region, 2025 to 2035
      • North America
      • Latin America
      • Europe
      • East Asia
      • South Asia & Pacific
      • Middle East and Africa
    • Market Attractiveness Analysis By Region
  11. North America Market Analysis 2020 to 2024 and Forecast 2025 to 2035, By Country
    • Historical Market Size Value (USD Million) & Volume (Units) Trend Analysis By Market Taxonomy, 2020 to 2024
    • Market Size Value (USD Million) & Volume (Units) Forecast By Market Taxonomy, 2025 to 2035
      • By Country
        • USA
        • Canada
      • By Protein Type
      • By Application
      • By Product Form
      • By Production Method
      • By Sales Channel
    • Market Attractiveness Analysis
      • By Country
      • By Protein Type
      • By Application
      • By Product Form
      • By Production Method
      • By Sales Channel
    • Key Takeaways
  12. Latin America Market Analysis 2020 to 2024 and Forecast 2025 to 2035, By Country
    • Historical Market Size Value (USD Million) & Volume (Units) Trend Analysis By Market Taxonomy, 2020 to 2024
    • Market Size Value (USD Million) & Volume (Units) Forecast By Market Taxonomy, 2025 to 2035
      • By Country
        • Brazil
        • Mexico
        • Colombia
        • Rest of Latin America
      • By Protein Type
      • By Application
      • By Product Form
      • By Production Method
      • By Sales Channel
    • Market Attractiveness Analysis
      • By Country
      • By Protein Type
      • By Application
      • By Product Form
      • By Production Method
      • By Sales Channel
    • Key Takeaways
  13. Europe Market Analysis 2020 to 2024 and Forecast 2025 to 2035, By Country
    • Historical Market Size Value (USD Million) & Volume (Units) Trend Analysis By Market Taxonomy, 2020 to 2024
    • Market Size Value (USD Million) & Volume (Units) Forecast By Market Taxonomy, 2025 to 2035
      • By Country
        • Germany
        • UK
        • France
        • Italy
        • Spain
        • Belgium
        • Netherlands
        • Nordic
        • Switzerland
        • Russia
        • Poland
        • Rest of Europe
      • By Protein Type
      • By Application
      • By Product Form
      • By Production Method
      • By Sales Channel
    • Market Attractiveness Analysis
      • By Country
      • By Protein Type
      • By Application
      • By Product Form
      • By Production Method
      • By Sales Channel
    • Key Takeaways
  14. East Asia Market Analysis 2020 to 2024 and Forecast 2025 to 2035, By Country
    • Historical Market Size Value (USD Million) & Volume (Units) Trend Analysis By Market Taxonomy, 2020 to 2024
    • Market Size Value (USD Million) & Volume (Units) Forecast By Market Taxonomy, 2025 to 2035
      • By Country
        • China
        • Japan
        • South Korea
      • By Protein Type
      • By Application
      • By Product Form
      • By Production Method
      • By Sales Channel
    • Market Attractiveness Analysis
      • By Country
      • By Protein Type
      • By Application
      • By Product Form
      • By Production Method
      • By Sales Channel
    • Key Takeaways
  15. South Asia & Pacific Market Analysis 2020 to 2024 and Forecast 2025 to 2035, By Country
    • Historical Market Size Value (USD Million) & Volume (Units) Trend Analysis By Market Taxonomy, 2020 to 2024
    • Market Size Value (USD Million) & Volume (Units) Forecast By Market Taxonomy, 2025 to 2035
      • By Country
        • India
        • Thailand
        • Malaysia
        • Indonesia
        • Singapore
        • Vietnam
        • Australia
        • New Zealand
        • Rest of South Asia
      • By Protein Type
      • By Application
      • By Product Form
      • By Production Method
      • By Sales Channel
    • Market Attractiveness Analysis
      • By Country
      • By Protein Type
      • By Application
      • By Product Form
      • By Production Method
      • By Sales Channel
    • Key Takeaways
  16. Middle East and Africa Market Analysis 2020 to 2024 and Forecast 2025 to 2035, By Country
    • Historical Market Size Value (USD Million) & Volume (Units) Trend Analysis By Market Taxonomy, 2020 to 2024
    • Market Size Value (USD Million) & Volume (Units) Forecast By Market Taxonomy, 2025 to 2035
      • By Country
        • Turkey
        • UAE
        • Saudi Arabia
        • Israel
        • Other GCC Countries
        • North Africa
        • South Africa
      • By Protein Type
      • By Application
      • By Product Form
      • By Production Method
      • By Sales Channel
    • Market Attractiveness Analysis
      • By Country
      • By Protein Type
      • By Application
      • By Product Form
      • By Production Method
      • By Sales Channel
    • Key Takeaways
  17. Key Countries Market Analysis
    • USA
      • Pricing Analysis
      • Market Share Analysis, 2024
        • By Protein Type
        • By Application
        • By Product Form
        • By Production Method
        • By Sales Channel
    • Canada
      • Pricing Analysis
      • Market Share Analysis, 2024
        • By Protein Type
        • By Application
        • By Product Form
        • By Production Method
        • By Sales Channel
    • Brazil
      • Pricing Analysis
      • Market Share Analysis, 2024
        • By Protein Type
        • By Application
        • By Product Form
        • By Production Method
        • By Sales Channel
    • Mexico
      • Pricing Analysis
      • Market Share Analysis, 2024
        • By Protein Type
        • By Application
        • By Product Form
        • By Production Method
        • By Sales Channel
    • Colombia
      • Pricing Analysis
      • Market Share Analysis, 2024
        • By Protein Type
        • By Application
        • By Product Form
        • By Production Method
        • By Sales Channel
    • Rest of Latin America
      • Pricing Analysis
      • Market Share Analysis, 2024
        • By Protein Type
        • By Application
        • By Product Form
        • By Production Method
        • By Sales Channel
    • Germany
      • Pricing Analysis
      • Market Share Analysis, 2024
        • By Protein Type
        • By Application
        • By Product Form
        • By Production Method
        • By Sales Channel
    • UK
      • Pricing Analysis
      • Market Share Analysis, 2024
        • By Protein Type
        • By Application
        • By Product Form
        • By Production Method
        • By Sales Channel
    • France
      • Pricing Analysis
      • Market Share Analysis, 2024
        • By Protein Type
        • By Application
        • By Product Form
        • By Production Method
        • By Sales Channel
    • Italy
      • Pricing Analysis
      • Market Share Analysis, 2024
        • By Protein Type
        • By Application
        • By Product Form
        • By Production Method
        • By Sales Channel
    • Spain
      • Pricing Analysis
      • Market Share Analysis, 2024
        • By Protein Type
        • By Application
        • By Product Form
        • By Production Method
        • By Sales Channel
    • Belgium
      • Pricing Analysis
      • Market Share Analysis, 2024
        • By Protein Type
        • By Application
        • By Product Form
        • By Production Method
        • By Sales Channel
    • Netherlands
      • Pricing Analysis
      • Market Share Analysis, 2024
        • By Protein Type
        • By Application
        • By Product Form
        • By Production Method
        • By Sales Channel
    • Nordic
      • Pricing Analysis
      • Market Share Analysis, 2024
        • By Protein Type
        • By Application
        • By Product Form
        • By Production Method
        • By Sales Channel
    • Switzerland
      • Pricing Analysis
      • Market Share Analysis, 2024
        • By Protein Type
        • By Application
        • By Product Form
        • By Production Method
        • By Sales Channel
    • Russia
      • Pricing Analysis
      • Market Share Analysis, 2024
        • By Protein Type
        • By Application
        • By Product Form
        • By Production Method
        • By Sales Channel
    • Poland
      • Pricing Analysis
      • Market Share Analysis, 2024
        • By Protein Type
        • By Application
        • By Product Form
        • By Production Method
        • By Sales Channel
    • Rest of Europe
      • Pricing Analysis
      • Market Share Analysis, 2024
        • By Protein Type
        • By Application
        • By Product Form
        • By Production Method
        • By Sales Channel
    • China
      • Pricing Analysis
      • Market Share Analysis, 2024
        • By Protein Type
        • By Application
        • By Product Form
        • By Production Method
        • By Sales Channel
    • Japan
      • Pricing Analysis
      • Market Share Analysis, 2024
        • By Protein Type
        • By Application
        • By Product Form
        • By Production Method
        • By Sales Channel
    • South Korea
      • Pricing Analysis
      • Market Share Analysis, 2024
        • By Protein Type
        • By Application
        • By Product Form
        • By Production Method
        • By Sales Channel
    • India
      • Pricing Analysis
      • Market Share Analysis, 2024
        • By Protein Type
        • By Application
        • By Product Form
        • By Production Method
        • By Sales Channel
    • Thailand
      • Pricing Analysis
      • Market Share Analysis, 2024
        • By Protein Type
        • By Application
        • By Product Form
        • By Production Method
        • By Sales Channel
    • Malaysia
      • Pricing Analysis
      • Market Share Analysis, 2024
        • By Protein Type
        • By Application
        • By Product Form
        • By Production Method
        • By Sales Channel
    • Indonesia
      • Pricing Analysis
      • Market Share Analysis, 2024
        • By Protein Type
        • By Application
        • By Product Form
        • By Production Method
        • By Sales Channel
    • Singapore
      • Pricing Analysis
      • Market Share Analysis, 2024
        • By Protein Type
        • By Application
        • By Product Form
        • By Production Method
        • By Sales Channel
    • Vietnam
      • Pricing Analysis
      • Market Share Analysis, 2024
        • By Protein Type
        • By Application
        • By Product Form
        • By Production Method
        • By Sales Channel
    • Australia
      • Pricing Analysis
      • Market Share Analysis, 2024
        • By Protein Type
        • By Application
        • By Product Form
        • By Production Method
        • By Sales Channel
    • New Zealand
      • Pricing Analysis
      • Market Share Analysis, 2024
        • By Protein Type
        • By Application
        • By Product Form
        • By Production Method
        • By Sales Channel
    • Rest of South Asia
      • Pricing Analysis
      • Market Share Analysis, 2024
        • By Protein Type
        • By Application
        • By Product Form
        • By Production Method
        • By Sales Channel
  18. Market Structure Analysis
    • Competition Dashboard
    • Competition Benchmarking
    • Market Share Analysis of Top Players
      • By Regional
      • By Protein Type
      • By Application
      • By Product Form
      • By Production Method
      • By Sales Channel
  19. Competition Analysis
    • Competition Deep Dive
      • FibroGen, Inc.
        • Overview
        • Product Portfolio
        • Profitability by Market Segments (Product/Age /Sales Channel/Region)
        • Sales Footprint
        • Strategy Overview
          • Marketing Strategy
          • Product Strategy
          • Channel Strategy
      • RepliCel Life Sciences
        • Overview
        • Product Portfolio
        • Profitability by Market Segments (Product/Age /Sales Channel/Region)
        • Sales Footprint
        • Strategy Overview
          • Marketing Strategy
          • Product Strategy
          • Channel Strategy
      • Organovo Holdings, Inc.
        • Overview
        • Product Portfolio
        • Profitability by Market Segments (Product/Age /Sales Channel/Region)
        • Sales Footprint
        • Strategy Overview
          • Marketing Strategy
          • Product Strategy
          • Channel Strategy
      • Sederma (Croda Group)
        • Overview
        • Product Portfolio
        • Profitability by Market Segments (Product/Age /Sales Channel/Region)
        • Sales Footprint
        • Strategy Overview
          • Marketing Strategy
          • Product Strategy
          • Channel Strategy
      • CollPlant Ltd.
        • Overview
        • Product Portfolio
        • Profitability by Market Segments (Product/Age /Sales Channel/Region)
        • Sales Footprint
        • Strategy Overview
          • Marketing Strategy
          • Product Strategy
          • Channel Strategy
      • Cytograft Tissue Engineering
        • Overview
        • Product Portfolio
        • Profitability by Market Segments (Product/Age /Sales Channel/Region)
        • Sales Footprint
        • Strategy Overview
          • Marketing Strategy
          • Product Strategy
          • Channel Strategy
      • TissueGenesis
        • Overview
        • Product Portfolio
        • Profitability by Market Segments (Product/Age /Sales Channel/Region)
        • Sales Footprint
        • Strategy Overview
          • Marketing Strategy
          • Product Strategy
          • Channel Strategy
      • Fibrocell Science, Inc.
        • Overview
        • Product Portfolio
        • Profitability by Market Segments (Product/Age /Sales Channel/Region)
        • Sales Footprint
        • Strategy Overview
          • Marketing Strategy
          • Product Strategy
          • Channel Strategy
      • Histogen, Inc.
        • Overview
        • Product Portfolio
        • Profitability by Market Segments (Product/Age /Sales Channel/Region)
        • Sales Footprint
        • Strategy Overview
          • Marketing Strategy
          • Product Strategy
          • Channel Strategy
      • Collagen Solutions plc
        • Overview
        • Product Portfolio
        • Profitability by Market Segments (Product/Age /Sales Channel/Region)
        • Sales Footprint
        • Strategy Overview
          • Marketing Strategy
          • Product Strategy
          • Channel Strategy
  20. Assumptions & Acronyms Used
  21. Research Methodology

List of Tables

  • Table 1: Global Market Value (USD Million) Forecast by Region, 2020-2035
  • Table 2: Global Market Volume (Units) Forecast by Region, 2020-2035
  • Table 3: Global Market Value (USD Million) Forecast by Protein Type, 2020-2035
  • Table 4: Global Market Volume (Units) Forecast by Protein Type, 2020-2035
  • Table 5: Global Market Value (USD Million) Forecast by Application, 2020-2035
  • Table 6: Global Market Volume (Units) Forecast by Application, 2020-2035
  • Table 7: Global Market Value (USD Million) Forecast by Product Form, 2020-2035
  • Table 8: Global Market Volume (Units) Forecast by Product Form, 2020-2035
  • Table 9: Global Market Value (USD Million) Forecast by Production Method, 2020-2035
  • Table 10: Global Market Volume (Units) Forecast by Production Method, 2020-2035
  • Table 11: Global Market Value (USD Million) Forecast by Sales Channel, 2020-2035
  • Table 12: Global Market Volume (Units) Forecast by Sales Channel, 2020-2035
  • Table 13: North America Market Value (USD Million) Forecast by Country, 2020-2035
  • Table 14: North America Market Volume (Units) Forecast by Country, 2020-2035
  • Table 15: North America Market Value (USD Million) Forecast by Protein Type, 2020-2035
  • Table 16: North America Market Volume (Units) Forecast by Protein Type, 2020-2035
  • Table 17: North America Market Value (USD Million) Forecast by Application, 2020-2035
  • Table 18: North America Market Volume (Units) Forecast by Application, 2020-2035
  • Table 19: North America Market Value (USD Million) Forecast by Product Form, 2020-2035
  • Table 20: North America Market Volume (Units) Forecast by Product Form, 2020-2035
  • Table 21: North America Market Value (USD Million) Forecast by Production Method, 2020-2035
  • Table 22: North America Market Volume (Units) Forecast by Production Method, 2020-2035
  • Table 23: North America Market Value (USD Million) Forecast by Sales Channel, 2020-2035
  • Table 24: North America Market Volume (Units) Forecast by Sales Channel, 2020-2035
  • Table 25: Latin America Market Value (USD Million) Forecast by Country, 2020-2035
  • Table 26: Latin America Market Volume (Units) Forecast by Country, 2020-2035
  • Table 27: Latin America Market Value (USD Million) Forecast by Protein Type, 2020-2035
  • Table 28: Latin America Market Volume (Units) Forecast by Protein Type, 2020-2035
  • Table 29: Latin America Market Value (USD Million) Forecast by Application, 2020-2035
  • Table 30: Latin America Market Volume (Units) Forecast by Application, 2020-2035
  • Table 31: Latin America Market Value (USD Million) Forecast by Product Form, 2020-2035
  • Table 32: Latin America Market Volume (Units) Forecast by Product Form, 2020-2035
  • Table 33: Latin America Market Value (USD Million) Forecast by Production Method, 2020-2035
  • Table 34: Latin America Market Volume (Units) Forecast by Production Method, 2020-2035
  • Table 35: Latin America Market Value (USD Million) Forecast by Sales Channel, 2020-2035
  • Table 36: Latin America Market Volume (Units) Forecast by Sales Channel, 2020-2035
  • Table 37: Europe Market Value (USD Million) Forecast by Country, 2020-2035
  • Table 38: Europe Market Volume (Units) Forecast by Country, 2020-2035
  • Table 39: Europe Market Value (USD Million) Forecast by Protein Type, 2020-2035
  • Table 40: Europe Market Volume (Units) Forecast by Protein Type, 2020-2035
  • Table 41: Europe Market Value (USD Million) Forecast by Application, 2020-2035
  • Table 42: Europe Market Volume (Units) Forecast by Application, 2020-2035
  • Table 43: Europe Market Value (USD Million) Forecast by Product Form, 2020-2035
  • Table 44: Europe Market Volume (Units) Forecast by Product Form, 2020-2035
  • Table 45: Europe Market Value (USD Million) Forecast by Production Method, 2020-2035
  • Table 46: Europe Market Volume (Units) Forecast by Production Method, 2020-2035
  • Table 47: Europe Market Value (USD Million) Forecast by Sales Channel, 2020-2035
  • Table 48: Europe Market Volume (Units) Forecast by Sales Channel, 2020-2035
  • Table 49: East Asia Market Value (USD Million) Forecast by Country, 2020-2035
  • Table 50: East Asia Market Volume (Units) Forecast by Country, 2020-2035
  • Table 51: East Asia Market Value (USD Million) Forecast by Protein Type, 2020-2035
  • Table 52: East Asia Market Volume (Units) Forecast by Protein Type, 2020-2035
  • Table 53: East Asia Market Value (USD Million) Forecast by Application, 2020-2035
  • Table 54: East Asia Market Volume (Units) Forecast by Application, 2020-2035
  • Table 55: East Asia Market Value (USD Million) Forecast by Product Form, 2020-2035
  • Table 56: East Asia Market Volume (Units) Forecast by Product Form, 2020-2035
  • Table 57: East Asia Market Value (USD Million) Forecast by Production Method, 2020-2035
  • Table 58: East Asia Market Volume (Units) Forecast by Production Method, 2020-2035
  • Table 59: East Asia Market Value (USD Million) Forecast by Sales Channel, 2020-2035
  • Table 60: East Asia Market Volume (Units) Forecast by Sales Channel, 2020-2035
  • Table 61: South Asia & Pacific Market Value (USD Million) Forecast by Country, 2020-2035
  • Table 62: South Asia & Pacific Market Volume (Units) Forecast by Country, 2020-2035
  • Table 63: South Asia & Pacific Market Value (USD Million) Forecast by Protein Type, 2020-2035
  • Table 64: South Asia & Pacific Market Volume (Units) Forecast by Protein Type, 2020-2035
  • Table 65: South Asia & Pacific Market Value (USD Million) Forecast by Application, 2020-2035
  • Table 66: South Asia & Pacific Market Volume (Units) Forecast by Application, 2020-2035
  • Table 67: South Asia & Pacific Market Value (USD Million) Forecast by Product Form, 2020-2035
  • Table 68: South Asia & Pacific Market Volume (Units) Forecast by Product Form, 2020-2035
  • Table 69: South Asia & Pacific Market Value (USD Million) Forecast by Production Method, 2020-2035
  • Table 70: South Asia & Pacific Market Volume (Units) Forecast by Production Method, 2020-2035
  • Table 71: South Asia & Pacific Market Value (USD Million) Forecast by Sales Channel, 2020-2035
  • Table 72: South Asia & Pacific Market Volume (Units) Forecast by Sales Channel, 2020-2035
  • Table 73: Middle East and Africa Market Value (USD Million) Forecast by Country, 2020-2035
  • Table 74: Middle East and Africa Market Volume (Units) Forecast by Country, 2020-2035
  • Table 75: Middle East and Africa Market Value (USD Million) Forecast by Protein Type, 2020-2035
  • Table 76: Middle East and Africa Market Volume (Units) Forecast by Protein Type, 2020-2035
  • Table 77: Middle East and Africa Market Value (USD Million) Forecast by Application, 2020-2035
  • Table 78: Middle East and Africa Market Volume (Units) Forecast by Application, 2020-2035
  • Table 79: Middle East and Africa Market Value (USD Million) Forecast by Product Form, 2020-2035
  • Table 80: Middle East and Africa Market Volume (Units) Forecast by Product Form, 2020-2035
  • Table 81: Middle East and Africa Market Value (USD Million) Forecast by Production Method, 2020-2035
  • Table 82: Middle East and Africa Market Volume (Units) Forecast by Production Method, 2020-2035
  • Table 83: Middle East and Africa Market Value (USD Million) Forecast by Sales Channel, 2020-2035
  • Table 84: Middle East and Africa Market Volume (Units) Forecast by Sales Channel, 2020-2035

List of Figures

  • Figure 1: Global Market Value (USD Million) by Protein Type, 2025-2035
  • Figure 2: Global Market Value (USD Million) by Application, 2025-2035
  • Figure 3: Global Market Value (USD Million) by Product Form, 2025-2035
  • Figure 4: Global Market Value (USD Million) by Production Method, 2025-2035
  • Figure 5: Global Market Value (USD Million) by Sales Channel, 2025-2035
  • Figure 6: Global Market Value (USD Million) by Region, 2025-2035
  • Figure 7: Global Market Value (USD Million) Analysis by Region, 2020-2035
  • Figure 8: Global Market Volume (Units) Analysis by Region, 2020-2035
  • Figure 9: Global Market Value Share (%) and BPS Analysis by Region, 2025-2035
  • Figure 10: Global Market Y-o-Y Growth (%) Projections by Region, 2025-2035
  • Figure 11: Global Market Value (USD Million) Analysis by Protein Type, 2020-2035
  • Figure 12: Global Market Volume (Units) Analysis by Protein Type, 2020-2035
  • Figure 13: Global Market Value Share (%) and BPS Analysis by Protein Type, 2025-2035
  • Figure 14: Global Market Y-o-Y Growth (%) Projections by Protein Type, 2025-2035
  • Figure 15: Global Market Value (USD Million) Analysis by Application, 2020-2035
  • Figure 16: Global Market Volume (Units) Analysis by Application, 2020-2035
  • Figure 17: Global Market Value Share (%) and BPS Analysis by Application, 2025-2035
  • Figure 18: Global Market Y-o-Y Growth (%) Projections by Application, 2025-2035
  • Figure 19: Global Market Value (USD Million) Analysis by Product Form, 2020-2035
  • Figure 20: Global Market Volume (Units) Analysis by Product Form, 2020-2035
  • Figure 21: Global Market Value Share (%) and BPS Analysis by Product Form, 2025-2035
  • Figure 22: Global Market Y-o-Y Growth (%) Projections by Product Form, 2025-2035
  • Figure 23: Global Market Value (USD Million) Analysis by Production Method, 2020-2035
  • Figure 24: Global Market Volume (Units) Analysis by Production Method, 2020-2035
  • Figure 25: Global Market Value Share (%) and BPS Analysis by Production Method, 2025-2035
  • Figure 26: Global Market Y-o-Y Growth (%) Projections by Production Method, 2025-2035
  • Figure 27: Global Market Value (USD Million) Analysis by Sales Channel, 2020-2035
  • Figure 28: Global Market Volume (Units) Analysis by Sales Channel, 2020-2035
  • Figure 29: Global Market Value Share (%) and BPS Analysis by Sales Channel, 2025-2035
  • Figure 30: Global Market Y-o-Y Growth (%) Projections by Sales Channel, 2025-2035
  • Figure 31: Global Market Attractiveness by Protein Type, 2025-2035
  • Figure 32: Global Market Attractiveness by Application, 2025-2035
  • Figure 33: Global Market Attractiveness by Product Form, 2025-2035
  • Figure 34: Global Market Attractiveness by Production Method, 2025-2035
  • Figure 35: Global Market Attractiveness by Sales Channel, 2025-2035
  • Figure 36: Global Market Attractiveness by Region, 2025-2035
  • Figure 37: North America Market Value (USD Million) by Protein Type, 2025-2035
  • Figure 38: North America Market Value (USD Million) by Application, 2025-2035
  • Figure 39: North America Market Value (USD Million) by Product Form, 2025-2035
  • Figure 40: North America Market Value (USD Million) by Production Method, 2025-2035
  • Figure 41: North America Market Value (USD Million) by Sales Channel, 2025-2035
  • Figure 42: North America Market Value (USD Million) by Country, 2025-2035
  • Figure 43: North America Market Value (USD Million) Analysis by Country, 2020-2035
  • Figure 44: North America Market Volume (Units) Analysis by Country, 2020-2035
  • Figure 45: North America Market Value Share (%) and BPS Analysis by Country, 2025-2035
  • Figure 46: North America Market Y-o-Y Growth (%) Projections by Country, 2025-2035
  • Figure 47: North America Market Value (USD Million) Analysis by Protein Type, 2020-2035
  • Figure 48: North America Market Volume (Units) Analysis by Protein Type, 2020-2035
  • Figure 49: North America Market Value Share (%) and BPS Analysis by Protein Type, 2025-2035
  • Figure 50: North America Market Y-o-Y Growth (%) Projections by Protein Type, 2025-2035
  • Figure 51: North America Market Value (USD Million) Analysis by Application, 2020-2035
  • Figure 52: North America Market Volume (Units) Analysis by Application, 2020-2035
  • Figure 53: North America Market Value Share (%) and BPS Analysis by Application, 2025-2035
  • Figure 54: North America Market Y-o-Y Growth (%) Projections by Application, 2025-2035
  • Figure 55: North America Market Value (USD Million) Analysis by Product Form, 2020-2035
  • Figure 56: North America Market Volume (Units) Analysis by Product Form, 2020-2035
  • Figure 57: North America Market Value Share (%) and BPS Analysis by Product Form, 2025-2035
  • Figure 58: North America Market Y-o-Y Growth (%) Projections by Product Form, 2025-2035
  • Figure 59: North America Market Value (USD Million) Analysis by Production Method, 2020-2035
  • Figure 60: North America Market Volume (Units) Analysis by Production Method, 2020-2035
  • Figure 61: North America Market Value Share (%) and BPS Analysis by Production Method, 2025-2035
  • Figure 62: North America Market Y-o-Y Growth (%) Projections by Production Method, 2025-2035
  • Figure 63: North America Market Value (USD Million) Analysis by Sales Channel, 2020-2035
  • Figure 64: North America Market Volume (Units) Analysis by Sales Channel, 2020-2035
  • Figure 65: North America Market Value Share (%) and BPS Analysis by Sales Channel, 2025-2035
  • Figure 66: North America Market Y-o-Y Growth (%) Projections by Sales Channel, 2025-2035
  • Figure 67: North America Market Attractiveness by Protein Type, 2025-2035
  • Figure 68: North America Market Attractiveness by Application, 2025-2035
  • Figure 69: North America Market Attractiveness by Product Form, 2025-2035
  • Figure 70: North America Market Attractiveness by Production Method, 2025-2035
  • Figure 71: North America Market Attractiveness by Sales Channel, 2025-2035
  • Figure 72: North America Market Attractiveness by Country, 2025-2035
  • Figure 73: Latin America Market Value (USD Million) by Protein Type, 2025-2035
  • Figure 74: Latin America Market Value (USD Million) by Application, 2025-2035
  • Figure 75: Latin America Market Value (USD Million) by Product Form, 2025-2035
  • Figure 76: Latin America Market Value (USD Million) by Production Method, 2025-2035
  • Figure 77: Latin America Market Value (USD Million) by Sales Channel, 2025-2035
  • Figure 78: Latin America Market Value (USD Million) by Country, 2025-2035
  • Figure 79: Latin America Market Value (USD Million) Analysis by Country, 2020-2035
  • Figure 80: Latin America Market Volume (Units) Analysis by Country, 2020-2035
  • Figure 81: Latin America Market Value Share (%) and BPS Analysis by Country, 2025-2035
  • Figure 82: Latin America Market Y-o-Y Growth (%) Projections by Country, 2025-2035
  • Figure 83: Latin America Market Value (USD Million) Analysis by Protein Type, 2020-2035
  • Figure 84: Latin America Market Volume (Units) Analysis by Protein Type, 2020-2035
  • Figure 85: Latin America Market Value Share (%) and BPS Analysis by Protein Type, 2025-2035
  • Figure 86: Latin America Market Y-o-Y Growth (%) Projections by Protein Type, 2025-2035
  • Figure 87: Latin America Market Value (USD Million) Analysis by Application, 2020-2035
  • Figure 88: Latin America Market Volume (Units) Analysis by Application, 2020-2035
  • Figure 89: Latin America Market Value Share (%) and BPS Analysis by Application, 2025-2035
  • Figure 90: Latin America Market Y-o-Y Growth (%) Projections by Application, 2025-2035
  • Figure 91: Latin America Market Value (USD Million) Analysis by Product Form, 2020-2035
  • Figure 92: Latin America Market Volume (Units) Analysis by Product Form, 2020-2035
  • Figure 93: Latin America Market Value Share (%) and BPS Analysis by Product Form, 2025-2035
  • Figure 94: Latin America Market Y-o-Y Growth (%) Projections by Product Form, 2025-2035
  • Figure 95: Latin America Market Value (USD Million) Analysis by Production Method, 2020-2035
  • Figure 96: Latin America Market Volume (Units) Analysis by Production Method, 2020-2035
  • Figure 97: Latin America Market Value Share (%) and BPS Analysis by Production Method, 2025-2035
  • Figure 98: Latin America Market Y-o-Y Growth (%) Projections by Production Method, 2025-2035
  • Figure 99: Latin America Market Value (USD Million) Analysis by Sales Channel, 2020-2035
  • Figure 100: Latin America Market Volume (Units) Analysis by Sales Channel, 2020-2035
  • Figure 101: Latin America Market Value Share (%) and BPS Analysis by Sales Channel, 2025-2035
  • Figure 102: Latin America Market Y-o-Y Growth (%) Projections by Sales Channel, 2025-2035
  • Figure 103: Latin America Market Attractiveness by Protein Type, 2025-2035
  • Figure 104: Latin America Market Attractiveness by Application, 2025-2035
  • Figure 105: Latin America Market Attractiveness by Product Form, 2025-2035
  • Figure 106: Latin America Market Attractiveness by Production Method, 2025-2035
  • Figure 107: Latin America Market Attractiveness by Sales Channel, 2025-2035
  • Figure 108: Latin America Market Attractiveness by Country, 2025-2035
  • Figure 109: Europe Market Value (USD Million) by Protein Type, 2025-2035
  • Figure 110: Europe Market Value (USD Million) by Application, 2025-2035
  • Figure 111: Europe Market Value (USD Million) by Product Form, 2025-2035
  • Figure 112: Europe Market Value (USD Million) by Production Method, 2025-2035
  • Figure 113: Europe Market Value (USD Million) by Sales Channel, 2025-2035
  • Figure 114: Europe Market Value (USD Million) by Country, 2025-2035
  • Figure 115: Europe Market Value (USD Million) Analysis by Country, 2020-2035
  • Figure 116: Europe Market Volume (Units) Analysis by Country, 2020-2035
  • Figure 117: Europe Market Value Share (%) and BPS Analysis by Country, 2025-2035
  • Figure 118: Europe Market Y-o-Y Growth (%) Projections by Country, 2025-2035
  • Figure 119: Europe Market Value (USD Million) Analysis by Protein Type, 2020-2035
  • Figure 120: Europe Market Volume (Units) Analysis by Protein Type, 2020-2035
  • Figure 121: Europe Market Value Share (%) and BPS Analysis by Protein Type, 2025-2035
  • Figure 122: Europe Market Y-o-Y Growth (%) Projections by Protein Type, 2025-2035
  • Figure 123: Europe Market Value (USD Million) Analysis by Application, 2020-2035
  • Figure 124: Europe Market Volume (Units) Analysis by Application, 2020-2035
  • Figure 125: Europe Market Value Share (%) and BPS Analysis by Application, 2025-2035
  • Figure 126: Europe Market Y-o-Y Growth (%) Projections by Application, 2025-2035
  • Figure 127: Europe Market Value (USD Million) Analysis by Product Form, 2020-2035
  • Figure 128: Europe Market Volume (Units) Analysis by Product Form, 2020-2035
  • Figure 129: Europe Market Value Share (%) and BPS Analysis by Product Form, 2025-2035
  • Figure 130: Europe Market Y-o-Y Growth (%) Projections by Product Form, 2025-2035
  • Figure 131: Europe Market Value (USD Million) Analysis by Production Method, 2020-2035
  • Figure 132: Europe Market Volume (Units) Analysis by Production Method, 2020-2035
  • Figure 133: Europe Market Value Share (%) and BPS Analysis by Production Method, 2025-2035
  • Figure 134: Europe Market Y-o-Y Growth (%) Projections by Production Method, 2025-2035
  • Figure 135: Europe Market Value (USD Million) Analysis by Sales Channel, 2020-2035
  • Figure 136: Europe Market Volume (Units) Analysis by Sales Channel, 2020-2035
  • Figure 137: Europe Market Value Share (%) and BPS Analysis by Sales Channel, 2025-2035
  • Figure 138: Europe Market Y-o-Y Growth (%) Projections by Sales Channel, 2025-2035
  • Figure 139: Europe Market Attractiveness by Protein Type, 2025-2035
  • Figure 140: Europe Market Attractiveness by Application, 2025-2035
  • Figure 141: Europe Market Attractiveness by Product Form, 2025-2035
  • Figure 142: Europe Market Attractiveness by Production Method, 2025-2035
  • Figure 143: Europe Market Attractiveness by Sales Channel, 2025-2035
  • Figure 144: Europe Market Attractiveness by Country, 2025-2035
  • Figure 145: East Asia Market Value (USD Million) by Protein Type, 2025-2035
  • Figure 146: East Asia Market Value (USD Million) by Application, 2025-2035
  • Figure 147: East Asia Market Value (USD Million) by Product Form, 2025-2035
  • Figure 148: East Asia Market Value (USD Million) by Production Method, 2025-2035
  • Figure 149: East Asia Market Value (USD Million) by Sales Channel, 2025-2035
  • Figure 150: East Asia Market Value (USD Million) by Country, 2025-2035
  • Figure 151: East Asia Market Value (USD Million) Analysis by Country, 2020-2035
  • Figure 152: East Asia Market Volume (Units) Analysis by Country, 2020-2035
  • Figure 153: East Asia Market Value Share (%) and BPS Analysis by Country, 2025-2035
  • Figure 154: East Asia Market Y-o-Y Growth (%) Projections by Country, 2025-2035
  • Figure 155: East Asia Market Value (USD Million) Analysis by Protein Type, 2020-2035
  • Figure 156: East Asia Market Volume (Units) Analysis by Protein Type, 2020-2035
  • Figure 157: East Asia Market Value Share (%) and BPS Analysis by Protein Type, 2025-2035
  • Figure 158: East Asia Market Y-o-Y Growth (%) Projections by Protein Type, 2025-2035
  • Figure 159: East Asia Market Value (USD Million) Analysis by Application, 2020-2035
  • Figure 160: East Asia Market Volume (Units) Analysis by Application, 2020-2035
  • Figure 161: East Asia Market Value Share (%) and BPS Analysis by Application, 2025-2035
  • Figure 162: East Asia Market Y-o-Y Growth (%) Projections by Application, 2025-2035
  • Figure 163: East Asia Market Value (USD Million) Analysis by Product Form, 2020-2035
  • Figure 164: East Asia Market Volume (Units) Analysis by Product Form, 2020-2035
  • Figure 165: East Asia Market Value Share (%) and BPS Analysis by Product Form, 2025-2035
  • Figure 166: East Asia Market Y-o-Y Growth (%) Projections by Product Form, 2025-2035
  • Figure 167: East Asia Market Value (USD Million) Analysis by Production Method, 2020-2035
  • Figure 168: East Asia Market Volume (Units) Analysis by Production Method, 2020-2035
  • Figure 169: East Asia Market Value Share (%) and BPS Analysis by Production Method, 2025-2035
  • Figure 170: East Asia Market Y-o-Y Growth (%) Projections by Production Method, 2025-2035
  • Figure 171: East Asia Market Value (USD Million) Analysis by Sales Channel, 2020-2035
  • Figure 172: East Asia Market Volume (Units) Analysis by Sales Channel, 2020-2035
  • Figure 173: East Asia Market Value Share (%) and BPS Analysis by Sales Channel, 2025-2035
  • Figure 174: East Asia Market Y-o-Y Growth (%) Projections by Sales Channel, 2025-2035
  • Figure 175: East Asia Market Attractiveness by Protein Type, 2025-2035
  • Figure 176: East Asia Market Attractiveness by Application, 2025-2035
  • Figure 177: East Asia Market Attractiveness by Product Form, 2025-2035
  • Figure 178: East Asia Market Attractiveness by Production Method, 2025-2035
  • Figure 179: East Asia Market Attractiveness by Sales Channel, 2025-2035
  • Figure 180: East Asia Market Attractiveness by Country, 2025-2035
  • Figure 181: South Asia & Pacific Market Value (USD Million) by Protein Type, 2025-2035
  • Figure 182: South Asia & Pacific Market Value (USD Million) by Application, 2025-2035
  • Figure 183: South Asia & Pacific Market Value (USD Million) by Product Form, 2025-2035
  • Figure 184: South Asia & Pacific Market Value (USD Million) by Production Method, 2025-2035
  • Figure 185: South Asia & Pacific Market Value (USD Million) by Sales Channel, 2025-2035
  • Figure 186: South Asia & Pacific Market Value (USD Million) by Country, 2025-2035
  • Figure 187: South Asia & Pacific Market Value (USD Million) Analysis by Country, 2020-2035
  • Figure 188: South Asia & Pacific Market Volume (Units) Analysis by Country, 2020-2035
  • Figure 189: South Asia & Pacific Market Value Share (%) and BPS Analysis by Country, 2025-2035
  • Figure 190: South Asia & Pacific Market Y-o-Y Growth (%) Projections by Country, 2025-2035
  • Figure 191: South Asia & Pacific Market Value (USD Million) Analysis by Protein Type, 2020-2035
  • Figure 192: South Asia & Pacific Market Volume (Units) Analysis by Protein Type, 2020-2035
  • Figure 193: South Asia & Pacific Market Value Share (%) and BPS Analysis by Protein Type, 2025-2035
  • Figure 194: South Asia & Pacific Market Y-o-Y Growth (%) Projections by Protein Type, 2025-2035
  • Figure 195: South Asia & Pacific Market Value (USD Million) Analysis by Application, 2020-2035
  • Figure 196: South Asia & Pacific Market Volume (Units) Analysis by Application, 2020-2035
  • Figure 197: South Asia & Pacific Market Value Share (%) and BPS Analysis by Application, 2025-2035
  • Figure 198: South Asia & Pacific Market Y-o-Y Growth (%) Projections by Application, 2025-2035
  • Figure 199: South Asia & Pacific Market Value (USD Million) Analysis by Product Form, 2020-2035
  • Figure 200: South Asia & Pacific Market Volume (Units) Analysis by Product Form, 2020-2035
  • Figure 201: South Asia & Pacific Market Value Share (%) and BPS Analysis by Product Form, 2025-2035
  • Figure 202: South Asia & Pacific Market Y-o-Y Growth (%) Projections by Product Form, 2025-2035
  • Figure 203: South Asia & Pacific Market Value (USD Million) Analysis by Production Method, 2020-2035
  • Figure 204: South Asia & Pacific Market Volume (Units) Analysis by Production Method, 2020-2035
  • Figure 205: South Asia & Pacific Market Value Share (%) and BPS Analysis by Production Method, 2025-2035
  • Figure 206: South Asia & Pacific Market Y-o-Y Growth (%) Projections by Production Method, 2025-2035
  • Figure 207: South Asia & Pacific Market Value (USD Million) Analysis by Sales Channel, 2020-2035
  • Figure 208: South Asia & Pacific Market Volume (Units) Analysis by Sales Channel, 2020-2035
  • Figure 209: South Asia & Pacific Market Value Share (%) and BPS Analysis by Sales Channel, 2025-2035
  • Figure 210: South Asia & Pacific Market Y-o-Y Growth (%) Projections by Sales Channel, 2025-2035
  • Figure 211: South Asia & Pacific Market Attractiveness by Protein Type, 2025-2035
  • Figure 212: South Asia & Pacific Market Attractiveness by Application, 2025-2035
  • Figure 213: South Asia & Pacific Market Attractiveness by Product Form, 2025-2035
  • Figure 214: South Asia & Pacific Market Attractiveness by Production Method, 2025-2035
  • Figure 215: South Asia & Pacific Market Attractiveness by Sales Channel, 2025-2035
  • Figure 216: South Asia & Pacific Market Attractiveness by Country, 2025-2035
  • Figure 217: Middle East and Africa Market Value (USD Million) by Protein Type, 2025-2035
  • Figure 218: Middle East and Africa Market Value (USD Million) by Application, 2025-2035
  • Figure 219: Middle East and Africa Market Value (USD Million) by Product Form, 2025-2035
  • Figure 220: Middle East and Africa Market Value (USD Million) by Production Method, 2025-2035
  • Figure 221: Middle East and Africa Market Value (USD Million) by Sales Channel, 2025-2035
  • Figure 222: Middle East and Africa Market Value (USD Million) by Country, 2025-2035
  • Figure 223: Middle East and Africa Market Value (USD Million) Analysis by Country, 2020-2035
  • Figure 224: Middle East and Africa Market Volume (Units) Analysis by Country, 2020-2035
  • Figure 225: Middle East and Africa Market Value Share (%) and BPS Analysis by Country, 2025-2035
  • Figure 226: Middle East and Africa Market Y-o-Y Growth (%) Projections by Country, 2025-2035
  • Figure 227: Middle East and Africa Market Value (USD Million) Analysis by Protein Type, 2020-2035
  • Figure 228: Middle East and Africa Market Volume (Units) Analysis by Protein Type, 2020-2035
  • Figure 229: Middle East and Africa Market Value Share (%) and BPS Analysis by Protein Type, 2025-2035
  • Figure 230: Middle East and Africa Market Y-o-Y Growth (%) Projections by Protein Type, 2025-2035
  • Figure 231: Middle East and Africa Market Value (USD Million) Analysis by Application, 2020-2035
  • Figure 232: Middle East and Africa Market Volume (Units) Analysis by Application, 2020-2035
  • Figure 233: Middle East and Africa Market Value Share (%) and BPS Analysis by Application, 2025-2035
  • Figure 234: Middle East and Africa Market Y-o-Y Growth (%) Projections by Application, 2025-2035
  • Figure 235: Middle East and Africa Market Value (USD Million) Analysis by Product Form, 2020-2035
  • Figure 236: Middle East and Africa Market Volume (Units) Analysis by Product Form, 2020-2035
  • Figure 237: Middle East and Africa Market Value Share (%) and BPS Analysis by Product Form, 2025-2035
  • Figure 238: Middle East and Africa Market Y-o-Y Growth (%) Projections by Product Form, 2025-2035
  • Figure 239: Middle East and Africa Market Value (USD Million) Analysis by Production Method, 2020-2035
  • Figure 240: Middle East and Africa Market Volume (Units) Analysis by Production Method, 2020-2035
  • Figure 241: Middle East and Africa Market Value Share (%) and BPS Analysis by Production Method, 2025-2035
  • Figure 242: Middle East and Africa Market Y-o-Y Growth (%) Projections by Production Method, 2025-2035
  • Figure 243: Middle East and Africa Market Value (USD Million) Analysis by Sales Channel, 2020-2035
  • Figure 244: Middle East and Africa Market Volume (Units) Analysis by Sales Channel, 2020-2035
  • Figure 245: Middle East and Africa Market Value Share (%) and BPS Analysis by Sales Channel, 2025-2035
  • Figure 246: Middle East and Africa Market Y-o-Y Growth (%) Projections by Sales Channel, 2025-2035
  • Figure 247: Middle East and Africa Market Attractiveness by Protein Type, 2025-2035
  • Figure 248: Middle East and Africa Market Attractiveness by Application, 2025-2035
  • Figure 249: Middle East and Africa Market Attractiveness by Product Form, 2025-2035
  • Figure 250: Middle East and Africa Market Attractiveness by Production Method, 2025-2035
  • Figure 251: Middle East and Africa Market Attractiveness by Sales Channel, 2025-2035
  • Figure 252: Middle East and Africa Market Attractiveness by Country, 2025-2035

Frequently Asked Questions

How big is the Fibroblast-Derived Protein Market in 2025?

The global Fibroblast-Derived Protein Market is estimated to be valued at USD 180 million in 2025.

What will be the size of the Fibroblast-Derived Protein Market in 2035?

The market size for the Fibroblast-Derived Protein Market is projected to reach USD 330.2 million by 2035.

How much will be the Fibroblast-Derived Protein Market growth between 2025 and 2035?

The Fibroblast-Derived Protein Market is expected to grow at a 6.3% CAGR between 2025 and 2035.

What are the key product types in the Fibroblast-Derived Protein Market?

The key product types in the Fibroblast-Derived Protein Market are Collagen, Elastin, Fibronectin, Laminin, and Proteoglycans & Glycoproteins.

Which protein type segment will contribute significant share in the Fibroblast-Derived Protein Market in 2025?

In terms of protein type, Collagen is expected to command 35% share in the Fibroblast-Derived Protein Market in 2025.

Explore Similar Insights

Future Market Insights

Fibroblast Derived Protein Market