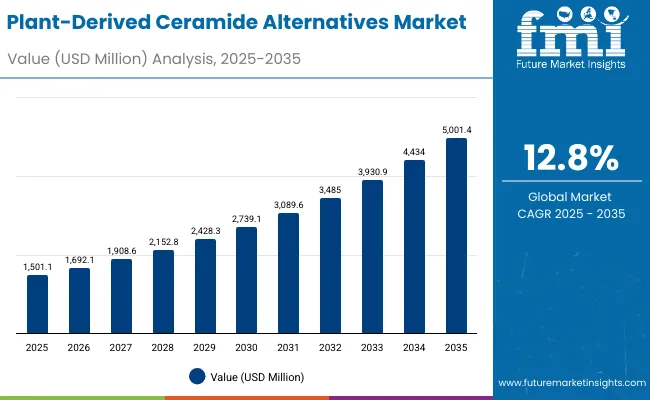
The Plant-Derived Ceramide Alternatives Market is expected to record a valuation of USD 1,501.1 million in 2025 and USD 5,001.4 million in 2035, with an increase of USD 3,501.3 million, which equals a growth of more than 193% over the decade. The overall expansion represents a CAGR of 12.8% and a more than 3X increase in market size.
Plant-Derived Ceramide Alternatives Market Key Takeaways
| Metric | Value |
|---|---|
| Plant-Derived Ceramide Alternatives Market Estimated Value in (2025E) | USD 1,501.1 million |
| Plant-Derived Ceramide Alternatives Market Forecast Value in (2035F) | USD 5,001.4 million |
| Forecast CAGR (2025 to 2035) | 12.8% |
During the first five-year period from 2025 to 2030, the market increases from USD 1,501.1 million to USD 2,739.1 million, adding USD 1,239 million, which accounts for around 35% of the total decade growth. This phase records steady adoption of ceramide-infused creams, serums, and lotions in skincare, driven by the rising demand for barrier repair and hydration in Western markets. Micellar waters dominate this period as they cater to over 60% of applications, offering gentle cleansing and hydration suitable for sensitive skin. Sensitive-skin tested claims account for more than 53% of total market share, showcasing consumer preference for dermatologist-approved and safety-tested products.
The second half from 2030 to 2035 contributes USD 2,262.3 million, equal to nearly 65% of total growth, as the market jumps from USD 2,739.1 million to USD 5,001.4 million. This acceleration is powered by rapid expansion in Asia-Pacific, particularly India and China, where CAGR exceeds 20% in certain segments. Oil-in-water micelles and vegan-certified products dominate, capturing higher adoption due to clean-label positioning and increasing regulatory pressures on animal-derived cosmetics. Cloud-enabled dermatology platforms, telehealth-linked product recommendations, and e-commerce subscription models add recurring revenue, boosting the online channel share beyond 40% by the end of the decade.
From 2020 to 2024, the Plant-Derived Ceramide Alternatives Market grew steadily, reaching early adoption in dermatology clinics, premium skincare, and niche e-commerce channels. During this period, the competitive landscape was dominated by global ingredient suppliers such as Croda, Evonik, and BASF, who controlled nearly 70% of raw material supply, with leaders differentiating on purity, efficacy in hydration and wrinkle prevention, and scalability of plant extraction. Competitive differentiation relied on sustainable sourcing, clinical validation, and price positioning, while downstream brands leveraged these ceramide alternatives as premium add-ons in serums and creams. Service-based dermatology integrations were limited but began gaining traction through partnerships with skin clinics in the USA and Japan.
Demand for plant-derived ceramide alternatives will expand to USD 1,501.1 million in 2025, and the revenue mix will shift as e-commerce and pharmacy channels grow to over 50% share. Traditional raw material suppliers face rising competition from bio-tech innovators specializing in fermented rice and soy ceramides, as well as beauty brands emphasizing vegan, clean-label, and dermatologist-tested positioning.
Major ingredient vendors are pivoting to hybrid models, integrating scientific storytelling, clinical trials, and partnerships with direct-to-consumer skincare labels to retain relevance. Emerging entrants focusing on transparent sourcing, multifunctional claims (hydration + anti-aging), and regional customization are gaining share. The competitive advantage is moving away from raw material supply alone to ecosystem strength, retail penetration, and consumer-facing brand collaborations.
Advances in biotechnology and plant extraction methods have improved purity, stability, and bioavailability of plant-derived ceramides, allowing for more efficient skin barrier repair and hydration. Micellar water products infused with ceramide alternatives have gained popularity due to their suitability for sensitive skin cleansing and gentle hydration. The rise of oil-in-water micelles has contributed to enhanced product stability and formulation versatility, supporting their inclusion in creams, lotions, and serums. Industries such as dermatology, premium cosmetics, and cosmeceuticals are driving demand for plant-derived ceramides that integrate seamlessly into existing skincare workflows.
Expansion of clean beauty and regulatory pressure against synthetic or animal-derived ceramides has fueled market growth. Innovations in portable dermatology testing devices, AI-driven skin analysis, and e-commerce subscription models are expected to open new application areas for ceramide-based hydration and anti-aging treatments. Segment growth is expected to be led by micellar waters, oil-in-water micelles, and sensitive skin-tested claims, due to their consumer trust, safety profiles, and adaptability across diverse demographics.
The market is segmented by source, function, product type, channel, claim, and region. Sources include soy-derived, wheat-derived, rice-derived, and other botanicals such as sunflower and corn, highlighting the diversification of raw materials. Functional segmentation covers barrier repair, hydration, anti-aging & wrinkle prevention, and sensitive skin relief, catering to rising consumer demand for multifunctional skincare. Based on product type, categories encompass creams, lotions, serums, balms, and high-growth micellar waters, each addressing distinct skin needs.
Channel segmentation highlights e-commerce, pharmacies, mass retail, and dermatology clinics, showing how direct-to-consumer and pharmacy-linked trust-based sales are shaping market expansion. Claims include vegan, natural/organic, clean-label, and dermatologist-tested, which strongly influence purchase behavior and premium positioning. Regionally, the scope spans North America, Latin America, Europe, Asia-Pacific, and the Middle East & Africa. Country-level hotspots include China, India, Japan, USA, UK, and Germany, each showing distinct growth trajectories, with Asia-Pacific recording the fastest CAGR above 15% due to consumer awareness and rising disposable incomes.
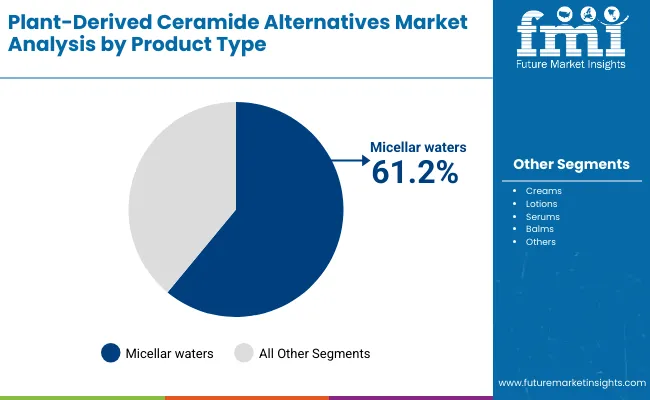
| Product Type | Value Share% 2025 |
|---|---|
| Micellar waters | 61.2% |
| Others | 38.8% |
The soy-derived ceramides segment is projected to contribute the largest share of the Plant-Derived Ceramide Alternatives Market revenue in Pacific and the Middle East & Africa in 2025, maintaining its lead as the dominant source category. This growth is driven by strong consumer and manufacturer confidence in soy-based formulations, which are known for their high concentration of phytoceramides and proven clinical benefits in improving skin hydration and barrier repair. Local brands in Pacific markets such as Australia and New Zealand are heavily promoting soy-based ceramide creams and serums as part of their natural and vegan skincare lines, further fueling growth.
In the Middle East and Africa, soy-derived ceramides are also gaining traction because of their compatibility with halal and vegan product claims, which are important for consumer trust in premium skincare. The increasing penetration of soy-based products across dermatology clinics and pharmacy-led retail channels enhances accessibility, while ongoing R&D collaborations between local cosmetic labs and international suppliers are expanding formulation diversity. Given their proven efficacy and established supply chain, soy-derived ceramides are expected to remain the backbone of plant-derived ceramide innovation in these regions.
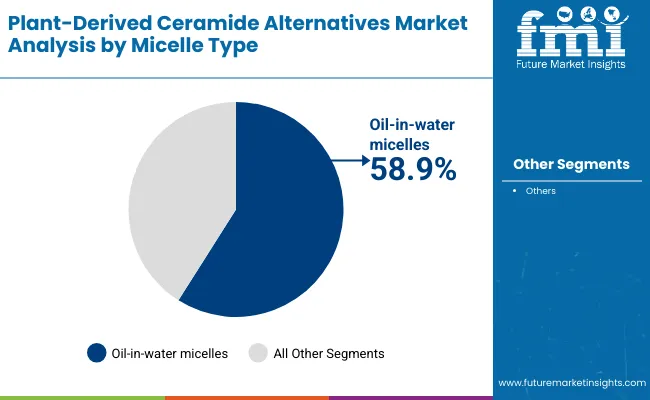
| Micelle Type | Value Share% 2025 |
|---|---|
| Oil-in-water micelles | 58.9% |
| Others | 41.1% |
The hydration segment is forecasted to hold the highest share of the Plant-Derived Ceramide Alternatives Market in Pacific and the Middle East & Africa in 2025, driven by consumer preference for products addressing dry skin, dehydration, and environmental stress. In Pacific regions, hydration-focused lotions and creams are strongly favored by younger demographics, especially in Australia and South Korea, where wellness-linked skincare routines emphasize moisture balance.
In the Middle East and Africa, hydration is even more critical due to the region’s hot and arid climate, where skin dryness and sensitivity are common concerns. Dermatology clinics in the Gulf countries are increasingly prescribing ceramide-rich moisturizers and serums for hydration and barrier repair, driving clinical demand. The widespread use of hydration claims across both mass retail and premium e-commerce platforms reinforces consumer trust and pushes adoption among middle-income groups. With increasing awareness about long-term skin health and the role of ceramides in maintaining optimal hydration, this segment is set to retain dominance throughout the forecast period.
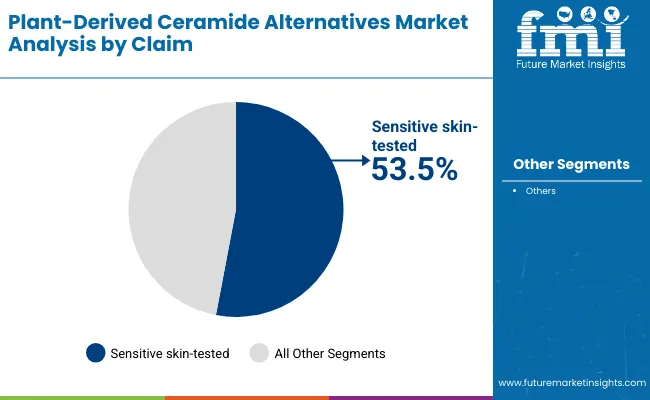
| Claim | Value Share% 2025 |
|---|---|
| Sensitive skin-tested | 53.5% |
| Others | 46.5% |
The vegan segment is projected to account for the largest revenue share of the Plant-Derived Ceramide Alternatives Market in Pacific and the Middle East & Africa in 2025, making it the leading claim type. Consumers in the Pacific markets are actively shifting toward vegan and cruelty-free cosmetics, with Australia, Singapore, and New Zealand leading in adoption of plant-based beauty formulations. Younger consumers in these regions view vegan-certified skincare not just as a lifestyle choice but also as a sustainability commitment, enhancing the appeal of soy-, wheat-, and rice-derived ceramides.
In the Middle East and Africa, vegan certification provides a strong competitive edge, particularly in Gulf Cooperation Council (GCC) countries, where clean-label, natural, and ethical skincare products are witnessing rapid demand growth. Vegan claims are also compatible with halal requirements, further boosting acceptance. Social media influence and beauty-conscious millennial and Gen Z consumers are key drivers, as they actively seek products that align with both ethical values and high-performance skincare benefits. Given this alignment with cultural, ethical, and sustainability preferences, vegan ceramide-based products are expected to expand rapidly and maintain their leadership within claim-based segmentation.
Rising Demand for Dermatologist-Tested and Sensitive-Skin Products
One of the strongest drivers in the Plant-Derived Ceramide Alternatives Market is the increasing consumer preference for sensitive-skin tested and dermatologist-approved formulations. Data shows that 53.5% of global market value in 2025 comes from sensitive-skin tested claims, highlighting how trust and clinical validation are now crucial purchase motivators. In mature markets like the USA and Germany, dermatology clinics play an important role in recommending ceramide-rich hydration and anti-aging creams for patients with eczema, psoriasis, and barrier-compromised skin.
In Asia-Pacific, particularly Japan and South Korea, consumer awareness of skin barrier health has elevated ceramides into mainstream product lines. This driver is reinforced by regulatory tightening in Europe, which favors products with safety-backed claims. As more clinical trials validate the efficacy of soy- and rice-derived ceramides, demand is projected to accelerate across both premium and pharmacy channels.
Accelerated Adoption in Asia-Pacific and Emerging Economies
Geographic dynamics are a powerful growth driver. While the USA and Europe remain established markets, the fastest growth is seen in China (CAGR 19.8%) and India (CAGR 22.7%), where rapid consumer onboarding is reshaping market structure. Rising disposable incomes, coupled with younger populations heavily influenced by K-beauty and J-beauty trends, are fueling high adoption of ceramide-based moisturizers, micellar waters, and serums.
Local manufacturers in India are leveraging rice and wheat-derived ceramides to reduce import dependency and cater to cost-sensitive segments. In the Middle East, high consumer spending on luxury and vegan skincare adds another layer of opportunity. These markets not only contribute to global growth but also influence product innovation through demand for vegan, natural, and halal-compliant ceramide alternatives.
Supply Chain Vulnerability in Plant-Derived Inputs
A critical restraint lies in sourcing consistency for raw materials like soy, wheat, and rice-derived ceramides. These botanical inputs are subject to agricultural yield fluctuations, climate variability, and geopolitical trade disruptions. For example, soy-derived ceramides dominate global share, but reliance on soybean cultivation exposes the industry to price volatility caused by droughts or export restrictions in Brazil, the USA, and Asia. Smaller players in Europe and MEA face challenges in securing steady, cost-effective raw materials, limiting their ability to scale. This supply chain fragility often leads to higher production costs, making ceramide alternatives less accessible to mass-market skincare brands and constraining overall adoption.
High Cost and Limited Consumer Awareness in Developing Regions
Although Asia-Pacific is growing fast, many African and South Asian countries face barriers in mass adoption due to higher product pricing and limited consumer education about ceramides. Premium ceramide-based creams and serums are positioned as luxury skincare, placing them outside the reach of middle-income consumers. Awareness campaigns are still nascent in markets like Sub-Saharan Africa, where hydration and barrier repair needs are high but consumers rely on traditional moisturizers. Without broader retail penetration and price adjustments, growth in these regions will remain confined to niche urban markets, restraining global scale-up opportunities.
Clean-Label and Vegan Claims Becoming Core Differentiators
Vegan, natural, and clean-label claims are not just premium add-ons anymore; they are shaping the competitive positioning of ceramide alternatives. With vegan-certified products dominating claim-based segmentation in Pacific and MEA markets, brands are aligning formulations with ethical and sustainability values. This trend is especially strong among Gen Z and millennial consumers, who associate vegan skincare with safety, environmental responsibility, and authenticity. In the Middle East, vegan aligns with halal compliance, further amplifying adoption. For ingredient suppliers like Evonik and Givaudan, this means restructuring portfolios to highlight traceability and plant-only sourcing as default, not optional.
E-Commerce and Dermatology Clinics Reshaping Distribution
Distribution patterns are shifting in a way that strongly impacts market dynamics. E-commerce platforms are rapidly expanding ceramide-based product penetration in China, India, and Southeast Asia, where online beauty influencers and subscription-based models drive repeat purchases. Simultaneously, dermatology clinics in the USA, Germany, and the Gulf states are acting as gatekeepers, endorsing ceramide-based hydration and barrier repair formulations as part of prescribed skincare regimens. This dual-channel trend is polarizing the market: e-commerce fosters affordability and volume growth, while clinics support premium pricing and consumer trust. The convergence of both ensures that ceramide alternatives are accessible across price tiers and consumer profiles, shaping future revenue streams.
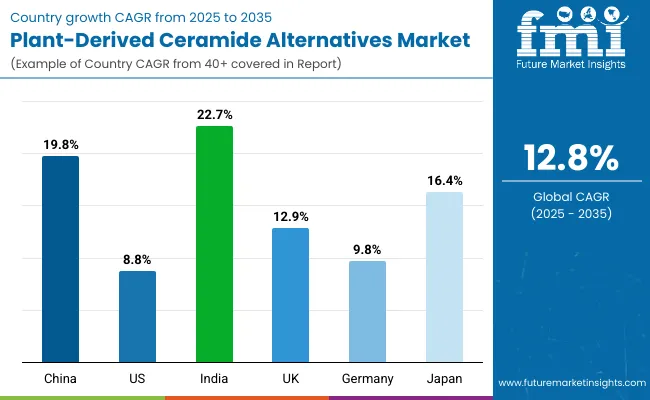
| Countries | Estimated CAGR (2025 to 2035) |
|---|---|
| China | 19.8% |
| USA | 8.8% |
| India | 22.7% |
| UK | 12.9% |
| Germany | 9.8% |
| Japan | 16.4% |
Between 2025 and 2035, the Plant-Derived Ceramide Alternatives Market will see its highest momentum from Asia, with India (22.7% CAGR) and China (19.8% CAGR) leading global growth. India’s strong expansion is driven by rising disposable incomes, growing penetration of e-commerce platforms, and local manufacturing investments in rice- and wheat-derived ceramides that reduce reliance on imports. China, already a major skincare hub, is seeing rapid adoption of ceramide-infused micellar waters and serums, supported by consumer preference for dermatologist-tested hydration and anti-aging products.
Japan follows closely at 16.4% CAGR, where the emphasis on skin barrier health and premium beauty routines positions ceramide alternatives as essential components of both mass-market and luxury skincare. Together, these Asian markets represent the fastest growth clusters globally, shaping innovation in vegan claims, multifunctional ceramide blends, and clinical-grade skincare solutions.
In contrast, Western markets show more moderate but steady growth. The USA market (8.8% CAGR) expands on the back of clinical dermatology endorsements, premium pharmacy channels, and the mainstreaming of sensitive-skin formulations, which account for over half of value share globally. Germany (9.8% CAGR) and the UK (12.9% CAGR) remain critical European hubs, balancing pharmacy-led retail and premium e-commerce demand for natural and clean-label ceramide skincare.
Growth here is slower than in Asia but remains significant due to high consumer spending on anti-aging and hydration solutions. While absolute volumes are higher in North America and Europe, the acceleration in Asia-Pacific reflects a clear shift in global demand centers, with Western markets focusing on premium positioning and regulatory-driven clean-label innovation.
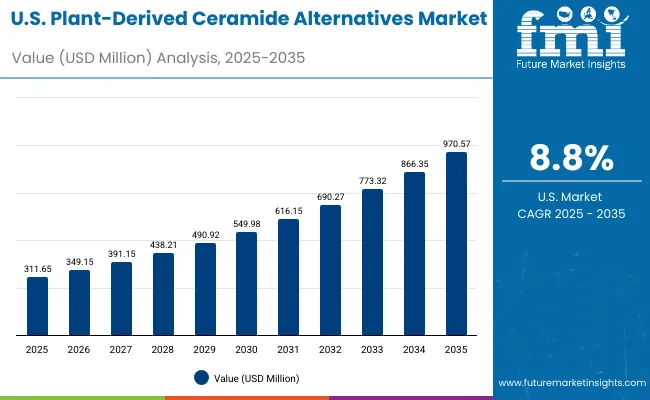
| Year | USA Plant-Derived Ceramide Alternatives Market (USD Million) |
|---|---|
| 2025 | 311.65 |
| 2026 | 349.15 |
| 2027 | 391.15 |
| 2028 | 438.21 |
| 2029 | 490.92 |
| 2030 | 549.98 |
| 2031 | 616.15 |
| 2032 | 690.27 |
| 2033 | 773.32 |
| 2034 | 866.35 |
| 2035 | 970.57 |
The Plant-Derived Ceramide Alternatives Market in the United States is projected to grow at a CAGR of 8.8%, led by increased adoption across dermatology clinics, pharmacies, and premium skincare brands. Sensitive-skin tested products recorded a notable year-on-year rise, particularly among hydration-focused serums and creams. The pharmacy channel continues to dominate distribution, while e-commerce platforms have expanded ceramide-based subscription models for targeted anti-aging regimens. Adoption is also rising in mass retail, where dermatologist-tested claims attract trust-driven consumers. High demand for micellar waters, which hold over 63% share in 2025, demonstrates the appeal of mild cleansing solutions suitable for USA consumer preferences.
The Plant-Derived Ceramide Alternatives Market in the United Kingdom is expected to grow at a CAGR of 12.9%, supported by applications in hydration, barrier repair, and clean-label premium skincare. Dermatology clinics and heritage pharmacy chains have accelerated usage of ceramide creams and lotions for sensitive skin treatments. Meanwhile, UK beauty retailers are pushing ceramide-infused serums and balms into AR-enabled online platforms, allowing consumers to visualize outcomes virtually. Growth is reinforced by clean-label regulations, which prioritize natural, vegan, and dermatologist-tested claims. The combination of government-backed innovation programs and brand partnerships with academic dermatology institutions continues to fuel adoption across both the mass and premium segments.
India is witnessing rapid growth in the Plant-Derived Ceramide Alternatives Market, which is forecast to expand at a CAGR of 22.7% through 2035. A sharp increase in consumption across tier-2 and tier-3 cities is being driven by affordability improvements, rising middle-class awareness, and strong e-commerce penetration. Domestic suppliers are leveraging rice- and wheat-derived ceramides to align with Ayurveda-inspired skincare solutions while maintaining cost-effectiveness. Educational institutes and vocational centers are introducing ceramide-based formulations into cosmetology training programs. Public health campaigns promoting hydration and skin barrier health are also reinforcing demand. With both affordability and premium positioning growing in parallel, India is emerging as one of the most dynamic markets worldwide.
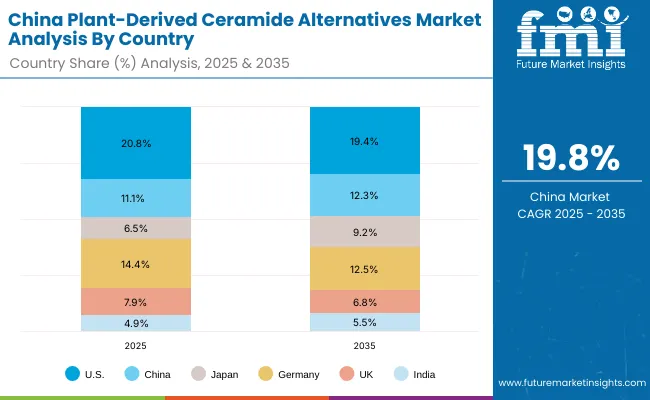
| Countries | 2025 Share (%) |
|---|---|
| USA | 20.8% |
| China | 11.1% |
| Japan | 6.5% |
| Germany | 14.4% |
| UK | 7.9% |
| India | 4.9% |
| Countries | 2035 Share (%) |
|---|---|
| USA | 19.4% |
| China | 12.3% |
| Japan | 9.2% |
| Germany | 12.5% |
| UK | 6.8% |
| India | 5.5% |
The Plant-Derived Ceramide Alternatives Market in China is expected to grow at a CAGR of 19.8%, the highest among leading economies. This momentum is driven by strong uptake of oil-in-water micelle-based skincare, city-level retail expansion, and competitive innovation by local beauty-tech firms. Premium brands are leveraging ceramides in anti-aging regimens, while mass-market players focus on hydration and sensitive-skin solutions for urban millennials. Municipal and regulatory bodies are increasingly supporting vegan and clean-label certifications, aligning with global sustainability benchmarks. Affordable ceramide-infused micellar waters and serums produced by domestic firms are enabling broad adoption across mass e-commerce and social commerce channels.
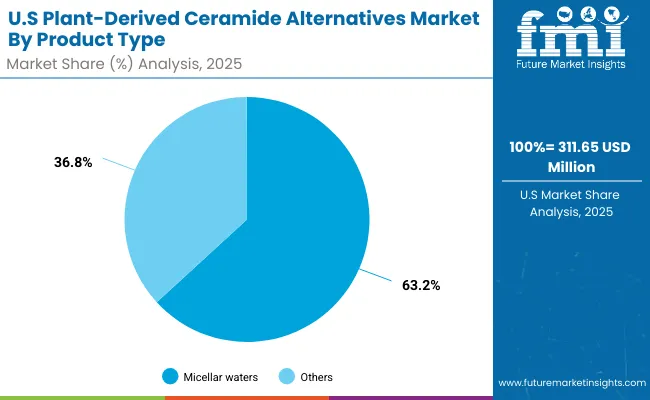
| US by Product Type | Value Share% 2025 |
|---|---|
| Micellar waters | 63.2% |
| Others | 36.8% |
The Plant-Derived Ceramide Alternatives Market in the United States is projected at USD 311.65 million in 2025. Micellar waters contribute 63.2%, while other ceramide formulations (creams, lotions, serums, balms) account for 36.8%, showing a strong preference for cleansing-based ceramide applications. This dominance stems from the rising prevalence of sensitive skin concerns, with micellar water positioned as a dermatologist-recommended solution for hydration and mild cleansing. Unlike creams and serums, which are often marketed as anti-aging solutions, micellar waters are reaching mass adoption because of their versatility across demographics and affordability at pharmacy retail points.
Growth is further supported by clinical endorsements, with dermatology clinics integrating ceramide-rich micellar solutions into sensitive-skin care regimens. Pharmacies and retail chains in the USA continue to prioritize dermatologist-tested claims, while e-commerce platforms drive subscription-based sales of hydration-focused ceramide serums. As consumers increasingly demand safety-backed products, the USA market will evolve toward multipurpose ceramide formats combining cleansing, hydration, and barrier repair in single-use solutions.
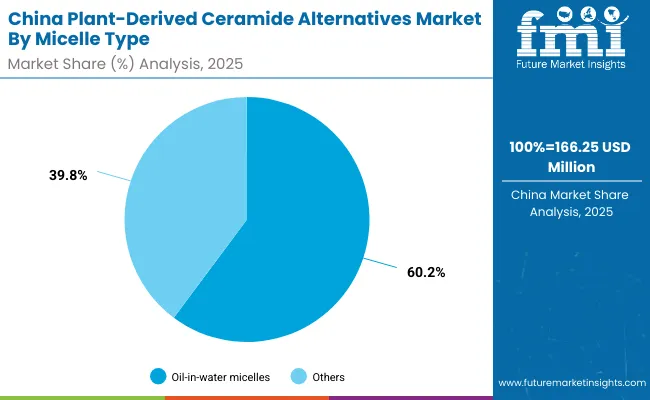
| China by Micelle Type | Value Share% 2025 |
|---|---|
| Oil-in-water micelles | 60.2% |
| Others | 39.8% |
The Plant-Derived Ceramide Alternatives Market in China is valued at USD 166.25 million in 2025, with oil-in-water micelles leading at 60.2%, followed by other types at 39.8%. The dominance of oil-in-water micelle systems reflects China’s skincare ecosystem, where hydration and barrier-repair benefits are prioritized in both premium and mass-market products. Oil-in-water micelles offer greater stability and compatibility with multifunctional formulations, making them essential for high-demand products like serums and lotions.
Local beauty-tech firms are actively producing affordable ceramide micellar waters, driving penetration into e-commerce and social commerce platforms. Urban millennials and Gen Z consumers are key drivers of adoption, influenced by K-beauty and J-beauty routines that emphasize skin barrier health. Regulatory tightening in China is also pushing demand for vegan-certified and clean-label ceramide alternatives, strengthening oil-in-water micelles’ position in formulations that emphasize natural safety. As the market accelerates, integration of AI-driven personalization in skincare apps and subscription platforms will further embed ceramide alternatives into daily consumer routines.
The Plant-Derived Ceramide Alternatives Market is moderately fragmented, with ingredient leaders, mid-sized innovators, and specialized formulators competing across diverse applications. Global ingredient suppliers such as Evonik, Croda, BASF, and Givaudan hold significant influence, driven by advanced soy- and rice-derived ceramide portfolios, strong sustainability credentials, and clinical validation programs. Their strategies increasingly emphasize clean-label certifications, vegan product lines, and co-development with multinational cosmetic brands.
Established mid-sized players, including Symrise, Seppic, Mibelle Biochemistry, and Provital, focus on innovation in multifunctional ceramide complexes that deliver hydration, anti-aging, and sensitive-skin relief simultaneously. These companies are accelerating adoption through partnerships with premium skincare brands, targeting formulations that balance efficacy with natural positioning.
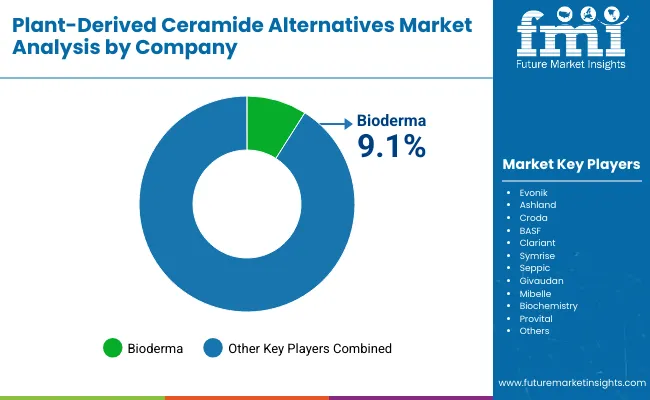
Specialized providers and downstream cosmetic brands such as Bioderma have carved out strong consumer-facing niches. Bioderma’s micellar water line dominates global share in ceramide-infused cleansing, holding 9.1% share in 2025, and sets benchmarks for dermatologist-tested formulations. Other niche brands focus on cost-effective ceramide solutions for emerging markets, particularly in Asia and MEA, where hydration remains the primary driver of adoption.
Competitive differentiation is shifting away from single-ingredient supply toward ecosystem strength, where ingredient suppliers, formulators, and retail partners collaborate to deliver integrated solutions. Leaders are emphasizing clinical trial validation, AR/VR-driven consumer education, and subscription-based distribution models. This transition reflects a market where trust, transparency, and innovation in delivery systems are as critical as raw ingredient quality.
Key Developments in Global Plant-Derived Ceramide Alternatives Market
| Item | Value |
|---|---|
| Quantitative Units | USD 1,501.1 Million |
| Source | Soy-derived ceramides, Wheat-derived ceramides, Rice-derived ceramides, Other botanicals (sunflower, corn) |
| Function | Barrier repair, Hydration, Anti-aging & wrinkle prevention, Sensitive skin relief |
| Product Type | Creams, Lotions, Serums, Balms, Micellar waters |
| Channel | E-commerce, Pharmacies, Mass retail, Dermatology clinics |
| Claim | Vegan, Natural/organic, Clean-label, Dermatologist-tested |
| Regions Covered | North America, Europe, Asia-Pacific, Latin America, Middle East & Africa |
| Country Covered | United States, Canada, Germany, France, United Kingdom, China, Japan, India, Brazil, South Africa |
| Key Companies Profiled | Evonik, Ashland, Croda, BASF, Clariant, Symrise, Seppic, Givaudan, Mibelle Biochemistry, Provital |
| Additional Attributes | Dollar sales by product type, function, and channel; adoption trends in sensitive-skin and hydration-led routines; rising demand for micellar waters and oil-in-water micelles; sector-specific growth in dermatology clinics and pharmacy retail; e-commerce subscription models providing recurring revenue; integration with AI-driven skin analysis and tele-dermatology; regional trends shaped by vegan/clean-label certification; innovations in plant sourcing (soy, wheat, rice, sunflower, corn) and fermentation for enhanced bioavailability. |
The Plant-Derived Ceramide Alternatives Market is estimated to be valued at USD 1,501.1 million in 2025.
The market size for the Plant-Derived Ceramide Alternatives Market is projected to reach USD 5,001.4 million by 2035.
The Plant-Derived Ceramide Alternatives Market is expected to grow at a 12.8% CAGR between 2025 and 2035.
The key product types in the Plant-Derived Ceramide Alternatives Market are creams, lotions, serums, balms, and micellar waters.
In terms of product type, the micellar waters segment is set to command the significant share in 2025, at 61.2% of global value sales.


Full Research Suite comprises of:
Market outlook & trends analysis
Interviews & case studies
Strategic recommendations
Vendor profiles & capabilities analysis
5-year forecasts
8 regions and 60+ country-level data splits
Market segment data splits
12 months of continuous data updates
DELIVERED AS:
PDF EXCEL ONLINE
Plant-Derived Hyaluronic Acid Alternatives Market Analysis - Size, Share, and Forecast Outlook 2025 to 2035
Ceramide Skincare Market Size and Share Forecast Outlook 2025 to 2035
Ceramide Complexes Market Analysis - Size and Share Forecast Outlook 2025 to 2035
Ceramide-Infused Moisturizers Market Analysis - Size and Share Forecast Outlook 2025 to 2035
Ceramide Sunscreen Market Growth – Size, Trends & Forecast 2024-2034
Alternatives For Injectable Diabetes Care Market Size and Share Forecast Outlook 2025 to 2035
Milk Alternatives Market – Growth, Demand & Dairy-Free Trends
Dairy Alternatives Market Analysis - Size, Share, and Forecast Outlook 2025 to 2035
Cheese Alternatives Market Analysis - Size, Share, and Forecast 2025 to 2035
Retinol Alternatives (Bakuchiol) Market Size and Share Forecast Outlook 2025 to 2035
Carmine Alternatives Market Size and Share Forecast Outlook 2025 to 2035
Fish Oil Alternatives Market Size and Share Forecast Outlook 2025 to 2035
Marine Squalene Alternatives Market Size and Share Forecast Outlook 2025 to 2035
Demand for Dairy Alternatives in the EU Size and Share Forecast Outlook 2025 to 2035
Bioactive Retinol Alternatives Market Analysis - Size and Share Forecast Outlook 2025 to 2035
Sustainable Glycerin Alternatives Market Size and Share Forecast Outlook 2025 to 2035
Carcinogenic Chemical Alternatives Market
Titanium-Free Food Color Alternatives Market
Pea Protein Demand in Dairy Alternatives Analysis - Size Share and Forecast outlook 2025 to 2035
High-Protein Plant-Based Cheese Alternatives in the EU Analysis Size and Share Forecast Outlook 2025 to 2035

Thank you!
You will receive an email from our Business Development Manager. Please be sure to check your SPAM/JUNK folder too.
Chat With
MaRIA