Bioactive Retinol Alternatives Market Size and Share Forecast Outlook 2025 to 2035

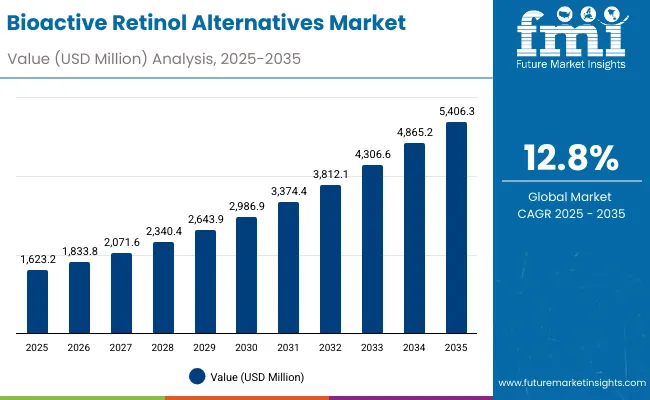
A valuation of USD 1,623.2 million had been estimated for the Bioactive Retinol Alternatives Market in 2025, with projections indicating a rise to USD 5,406.3 million by 2035. This reflects a net increase of USD 3,783.1 million, signifying a 233% expansion over the decade. The market’s long-term trajectory is expected to register a CAGR of 12.8%, effectively more than tripling in size over the period.
Quick Stats for Bioactive Retinol Alternatives Market

  • Bioactive Retinol Alternatives Market Value (2025): USD 1,623.2 Million
  • Bioactive Retinol Alternatives Market Forecast Value (2035): USD 5,406.3 Million
  • Bioactive Retinol Alternatives Market Forecast CAGR: 12.8% (2025 to 2035)
  • Leading Segment in Bioactive Retinol Alternatives Market (2025): Anti-aging Function (52.5%)
  • Key Growth Regions in the Bioactive Retinol Alternatives Market: Asia-Pacific, North America, Western Europe
  • Top Key Players in Bioactive Retinol Alternatives Market: Sytheon, Provital, BASF, Ashland, Croda, Givaudan, DSM-Firmenich, Roquette, Codif, Clariant

Bioactive Retinol Alternatives Market

Bioactive Retinol Alternatives Market Key Takeaways

Metric Value
Market Estimated Value in (2025E) USD 1,623.2 million
Market Forecast Value In (2035F) USD 5,406.3 million
Forecast CAGR (2025 to 2035) 12.80%

During the initial half of the forecast window (2025-2030), the market is set to grow from USD 1,623.2 million to USD 2,986.9 million, accounting for USD 1,363.7 million, which equals 36% of the projected decade-wide growth. This phase is expected to be marked by surging demand for plant-based actives, driven by consumer preference for clean-label skincare. Bakuchiol and alfalfa extract are anticipated to dominate, reinforced by anti-aging applications gaining widespread formulation preference.

In the subsequent five-year phase (2030-2035), an incremental rise of USD 2,419.4 million is projected, as the market grows from USD 2,986.9 million to USD 5,406.3 million, accounting for 64% of the total decade growth. This acceleration is likely to be powered by regulatory validation, enhanced clinical trials, and brand adoption in APAC. China and India are projected to anchor global momentum, with clinics, professional skincare, and D2C models strengthening uptake.

Through 2035, functional positioning around anti-aging, serums, and professional-grade product tiers is expected to define both volume and value leadership.

Between 2020 and 2024, early interest in bioactive retinol alternatives was primarily driven by sensitivity to synthetic retinoids and a shift toward clean-label cosmeceuticals. Brands emphasized clinical testing, gentle anti-aging, and pregnancy-safe claims, while consumer education accelerated through dermatology-endorsed social platforms.

By 2025, the market is expected to surpass USD 1,600 million, driven by expanding D2C models, professional dermatology use cases, and rising demand for plant-derived formulations. A transition toward clinical-grade botanicals has been initiated by global majors, with emphasis placed on high-purity extraction, encapsulation technology, and regulatory compliance.

From 2025 onward, the revenue mix is projected to shift as functional innovation, regulatory alignment, and co-branding with skin clinics take center stage. Competitive advantage is expected to move away from raw ingredient sourcing toward dermaceutical partnerships, microbiome-safe positioning, and multi-functional performance. Premium brands are likely to scale up hybrid formats supported by AI-powered personalization and barrier-restoring claims, redefining how retinol alternatives are positioned in clinical and commercial skincare portfolios.

Why the Bioactive Retinol Alternatives Market is growing?

The growth of the Bioactive Retinol Alternatives Market has been fueled by a rising demand for gentler, plant-based skincare solutions as concerns surrounding synthetic retinoids continue to mount. Widespread irritation, sensitivity, and regulatory scrutiny have prompted formulators and dermatologists to shift toward safer bioactives. Increased consumer awareness of skin microbiome health and long-term skin integrity has further accelerated this transition.

Clean beauty trends and ingredient transparency mandates have been reinforced by clinical trials validating the efficacy of alternatives like bakuchiol and alfalfa extract. These ingredients have been adopted across premium and mass-market formulations due to their multifunctional properties spanning anti-aging, anti-inflammatory, and skin-brightening effects.

The market expansion has also been supported by D2C brand penetration, regulatory easing in APAC, and strategic investments by key players in natural actives. As professional-grade skincare gains traction in China, India, and the USA, the momentum is expected to sustain, reshaping future formulation strategies across cosmetic and dermaceutical domains.

Segmental Analysis

The Bioactive Retinol Alternatives Market has been segmented to uncover the strategic forces shaping demand across various value pools. Segmentation has been conducted across function, tier, and product type, capturing essential variables that guide purchasing behavior and formulation focus. By dissecting these categories, nuanced shifts in consumer intent and product positioning have been revealed.

Function-based analysis has spotlighted anti-aging as a leading driver of value, while product tiers highlight the dual momentum of both premium and accessible categories. Simultaneously, product type segmentation indicates a dynamic interplay between concentrated formats like serums and other diversified delivery systems. These segments are expected to evolve in line with dermatological trends, ingredient efficacy, and brand positioning strategies, ultimately dictating innovation direction and revenue potential over the next decade.
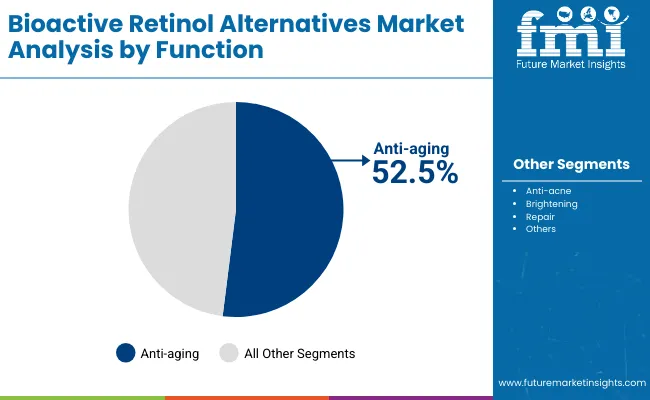
Insights into the Function Segment with Anti-Aging Leading

Bioactive Retinol Alternatives Market By Function

Function Market Value Share, 2025
Anti-aging 52.5%
Others 47.5%

The anti-aging function segment is projected to account for 52.5% share of the Bioactive Retinol Alternatives Market in 2025, valued at USD 840.4 Million, maintaining its position as the largest contributor. Demand is expected to be supported by the rising consumer preference for safe, irritation-free solutions that mimic retinol efficacy. Expansion will likely be reinforced by multi-functional claims such as wrinkle reduction, brightening, and barrier repair. “Others,” holding a 47.5% share (USD 770.6 Million), is anticipated to witness healthy growth, aided by anti-acne positioning and lifestyle-related skin concerns. Together, these functions are expected to drive strong market momentum as brands invest in clinically backed actives and education-led campaigns that elevate trust and usage frequency.
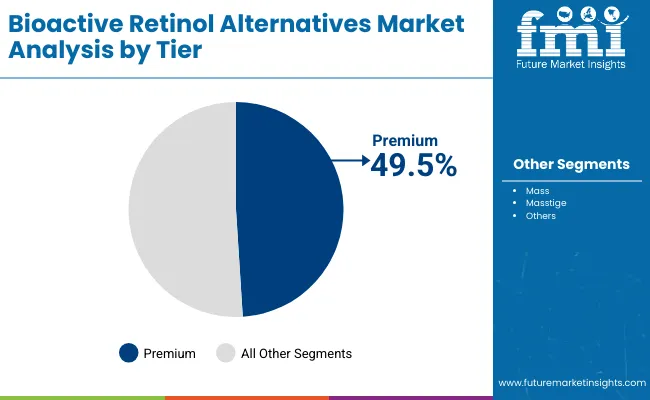
Insights into the Tier Segment with Premium Gaining Momentum

Bioactive Retinol Alternatives Market By Tier

Tier Market Value Share, 2025
Premium 49.5%
Others 50.5%

The premium tier is estimated to hold 49.5% share of market revenues in 2025, valued at USD 791.9 Million, reflecting growing consumer willingness to pay for clinically substantiated and higher-efficacy formulations. The share of non-premium (50.5%, USD 819.8 Million) is expected to remain relevant, particularly in price-sensitive regions where first-time users are driving penetration. Migration from mass to masstige and premium formats is projected to accelerate, supported by influencer-led marketing and dermatology partnerships. As awareness of skin safety and sustainability increases, consumers are anticipated to favor brands offering traceable sourcing and minimal irritation profiles, ensuring long-term loyalty and stable pricing power across the premium segment.
Insights into the Channel Segment with Professional Clinics Driving Trust

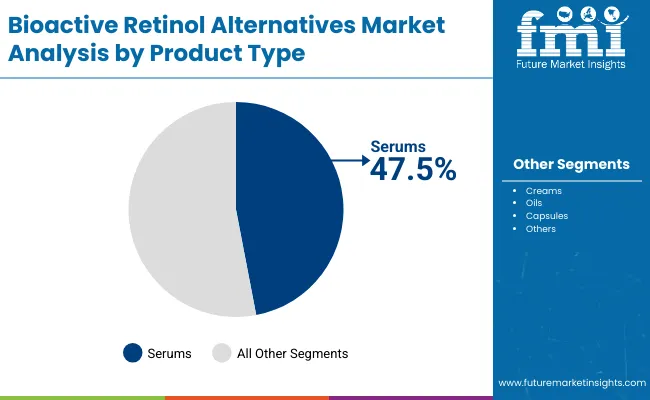
Bioactive Retinol Alternatives Market By Product

Product Type Market Value Share, 2025
Serums 47.5%
Others 52.5%

The clinics/professional channel is expected to contribute 52.5% share of total sales in 2025, valued at USD 103.3 Million, underlining its importance in building credibility and accelerating adoption. Other channels, with a 47.5% share (USD 93.5 Million), are projected to expand steadily through e-commerce, D2C platforms, and pharmacies. Professional recommendation is expected to play a pivotal role in reducing consumer hesitation and validating product efficacy, especially in markets such as China and Japan where dermatologist guidance drives trial rates. Digital-first brands are forecasted to leverage omni channel presence to bridge online education with offline conversion, thereby maximizing repeat purchases and strengthening consumer trust in bioactive retinol alternatives.

What are the Drivers, Restraints, and Key Trends of the Bioactive Retinol Alternatives Market?

Growing clinical scrutiny of synthetic retinoids and shifting dermatological standards have challenged conventional product portfolios, even as market readiness for functional, botanical-based alternatives continues to mature across both clinical and commercial skincare verticals.

Institutional Dermatology Partnerships and Ingredient Clinicalization

Strong momentum has been observed through collaborations between ingredient developers and dermatological institutions to validate efficacy via controlled trials. These partnerships have enabled the clinicalization of bioactive retinol alternatives, moving them from anecdotal use into evidence-backed skincare. This alignment with medical professionals has improved trust among physicians and estheticians, facilitating inclusion in post-procedure routines and prescription-led skincare. The development of standardized testing protocols for bakuchiol, alfalfa extract, and rosehip derivatives has further supported their formulation in regulated product classes, strengthening regulatory acceptance across APAC and Western markets.

Positioning of Bioactive Retinols as Microbiome-Friendly Ingredients

Bioactive retinol alternatives have increasingly been repositioned as microbiome-preserving compounds, in contrast to synthetic retinoids known to compromise skin barrier integrity. This positioning has opened avenues for integration into barrier-repair formulations, probiotic skincare, and anti-inflammatory dermaceuticals. Ingredient marketing now emphasizes compatibility with sensitive skin, chronic inflammatory conditions, and post-laser or resurfacing therapies areas traditionally avoided by retinoid users. This trend has elevated their perceived therapeutic value and is expected to redefine formulation strategies over the forecast period.
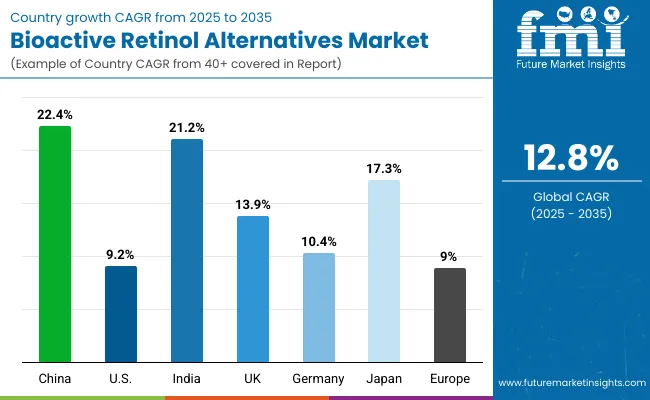
Analysis of Bioactive Retinol Alternatives Market By Key Countries

Bioactive Retinol Alternatives Market By Country

Countries CAGR
China 22.4%
USA 9.2%
India 21.2%
UK 13.9%
Germany 10.4%
Japan 17.3%

The global Bioactive Retinol Alternatives Market has displayed significant geographical variance in growth potential, shaped by factors such as clinical awareness, consumer acceptance of botanical actives, and regulatory flexibility. Asia-Pacific is anticipated to lead the expansion curve, driven by China (22.4% CAGR) and India (21.2%), as both countries continue to invest in clean-label skincare, dermatology infrastructure, and natural ingredient sourcing.

In China, accelerated growth has been supported by strong demand for professional-grade anti-aging solutions and institutional endorsements for plant-derived actives like bakuchiol. Clinics and D2C brands are expected to dominate the premium tier, reflecting evolving consumer sophistication and brand education. India’s trajectory has been catalyzed by rising disposable income, influencer-driven skincare narratives, and greater ingredient transparency.

Japan (17.3%) is projected to maintain steady growth due to innovation in functional cosmetics and a deep-rooted culture of preventive skincare. In contrast, Europe is expected to expand at a moderate pace, led by the UK (13.9%) and Germany (10.4%), supported by compliance with cosmetic safety standards and clean beauty movements.

The USA, while mature, is projected to grow at a 9.2% CAGR, with momentum being maintained through cosmeceutical adoption and channel diversification across clinical and retail ecosystems.
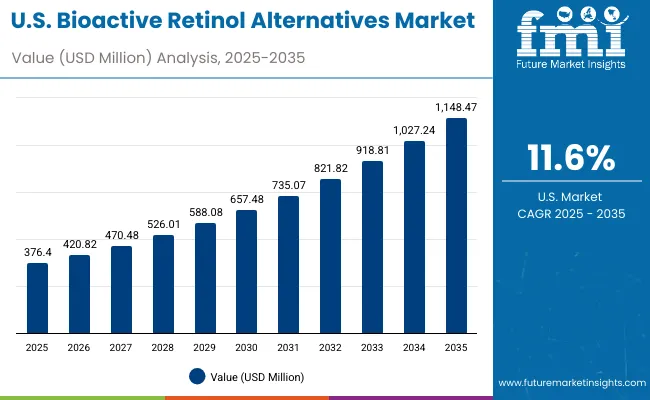
Sales Outlook for Bioactive Retinol Alternatives in the United States

Bioactive Retinol Alternatives Market Usa

Year USA Bioactive Retinol Alternatives Market (USD Million)
2025 376.40
2026 420.82
2027 470.48
2028 526.01
2029 588.08
2030 657.48
2031 735.07
2032 821.82
2033 918.81
2034 1,027.24
2035 1,148.47

The USA Bioactive Retinol Alternatives Market is projected to expand at a CAGR of 11.6% between 2025 and 2035, rising from USD 376.4 Million to USD 1,148.5 Million. Growth is expected to be fueled by increasing alignment with clinical dermatology standards, rising adoption of premium-tier product lines, and heightened consumer avoidance of synthetic actives.

Formulation science in the USA has increasingly favored bioactive ingredients validated by dermatological trials and regulatory transparency. The shift toward microbiome-safe and pregnancy-safe formulations has further accelerated adoption across both clinical and mass-market skincare portfolios. By the end of the forecast period, the USA market is expected to account for a meaningful share of global sales, reinforced by health-conscious consumers, robust channel diversification, and an innovation-friendly ecosystem.

  • Bakuchiol-based alternatives have been integrated into professional-grade regimens targeting aging and inflamed skin.
  • Regulatory clarity around plant-derived actives has encouraged innovation pipelines among USA-based clean beauty brands.
  • Functional skincare positioning especially within post-procedure and derm-prescribed categories has driven strong retail expansion.
  • Clinical endorsements and GRAS certifications have become key levers for ingredient commercialization.

Growth and Expansion Outlook for Bioactive Retinol Alternatives Market in the United Kingdom

The UK market is expected to grow at a CAGR of 13.9% between 2025 and 2035, signaling a healthy acceleration driven by the convergence of clean beauty mandates and clinical formulation adoption.

Consumer preference for EU-aligned, ingredient-transparent skincare has continued to shape the adoption of bioactive retinol alternatives. Product education around skin sensitivity, hormonal balance, and long-term skin health has been prioritized across both retail and prescription-grade channels. By 2035, the UK is expected to act as a regulatory benchmark for wider European expansion, particularly for clean-label and sensitive skin-positioned bioactive formulations.

  • British brands have integrated bakuchiol into nighttime repair creams and pregnancy-safe routines.
  • Demand for fragrance-free, hypoallergenic formulations has created white space for bioactives that avoid irritation.
  • Cosmetic dermatology clinics are favoring bioactives post-laser and resurfacing treatments.
  • Retailers are promoting microbiome-friendly claims through clinical-grade shelf labeling.

Growth and Expansion Outlook for Bioactive Retinol Alternatives Market in India

India’s market is projected to expand at a CAGR of 21.2% through 2035, driven by digitally enabled skincare demand, rising disposable incomes, and Ayurveda-aligned active ingredient formulations.

Urban middle-class consumers have embraced preventive skincare routines, especially for pigmentation and early aging, where bakuchiol, rosehip oil, and carrot root extracts have gained popularity. Skin tolerance levels, climate sensitivity, and cultural affinity for botanical remedies have guided product development and consumer trust.

  • Domestic brands are introducing bioactive ingredients in face oils, gels, and ayurvedic dermaceuticals.
  • E-commerce platforms are educating first-time users via influencer-led skin safety campaigns.
  • A shift away from fairness creams is channeling demand toward skin barrier-supportive bioactives.
  • Dermatologist engagement is increasing via collaborations with cosmeceutical companies for tiered city markets.

Sales Outlook for Bioactive Retinol Alternatives in China

China is forecasted to record a CAGR of 22.4% from 2025 to 2035 one of the highest globally fueled by strong clinical demand, professional skincare expansion, and local brand innovation.

The shift from synthetic to botanical retinoids has been actively supported by dermatological clinics, especially in Tier-1 and Tier-2 cities. Ingredient functionality, safety across skin types, and multi-tasking benefits have been emphasized in brand messaging.
  • Clinics and esthetic centers are adopting bakuchiol for anti-aging protocols in sensitive skin categories.
  • Cross-border e-commerce platforms are distributing certified global bioactive ingredients.
  • Regulatory updates have eased market entry for brands using “natural functionals” over prescription retinoids.
  • Growth is concentrated in clinic-prescribed, professional-grade formats, particularly in serums and night repair creams.

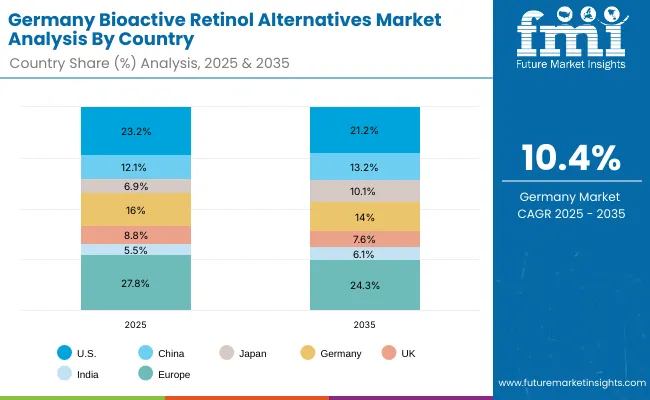
In-depth Analysis of Bioactive Retinol Alternatives in Germany

Bioactive Retinol Alternatives Market Germany

Countries 2025
USA 23.2%
China 12.1%
Japan 6.9%
Germany 16.0%
UK 8.8%
India 5.5%
Countries 2035
USA 21.2%
China 13.2%
Japan 10.1%
Germany 14.0%
UK 7.6%
India 6.1%

Germany’s Bioactive Retinol Alternatives Market is projected to grow at a CAGR of 10.4% from 2025 to 2035, supported by established dermocosmetic traditions and strong adherence to ingredient purity.

Sustainability and skin safety have remained critical themes in German cosmetic science. Bioactive retinol alternatives are increasingly adopted across pharmacy-led skincare lines and organic-certified product segments. Local consumers have demonstrated a strong preference for well-researched ingredients with minimal side effects.
  • Apothecary retail chains are introducing bioactive night creams with microbiome support claims.
  • Clinical skincare brands are avoiding synthetic retinoids in sensitive-skin lines, opting for phytosterol blends.
  • Ingredient transparency and EU COSMOS certification are driving inclusion in certified natural formulations.
  • Adoption is strongest in anti-aging and moisture-repair categories, especially among consumers over 35.

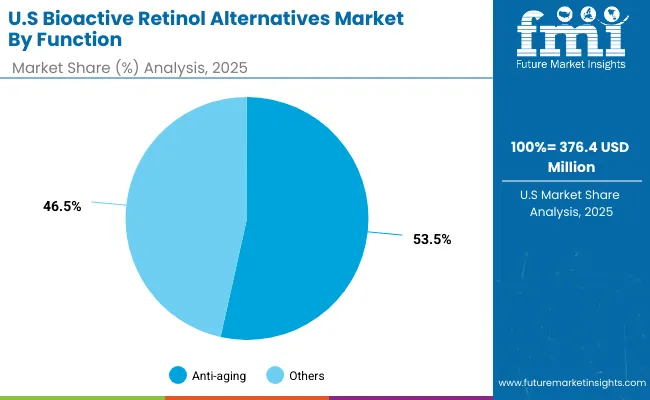
Growth Outlook for Bioactive Retinol Alternatives Market in USA

Bioactive Retinol Alternatives Market Usa 2

Segment Market Value Share, 2025
Anti-aging 53.5%
Others 46.5%

The USA Bioactive Retinol Alternatives Market is projected at USD 376.4 Million in 2025, with anti-aging applications contributing 53.5% (USD 201.5 Million) and other functions representing 46.5% (USD 174.9 Million). This dominance of anti-aging is expected to be reinforced by heightened consumer focus on early intervention, wrinkle prevention, and sensitivity-safe alternatives to retinoids. The market is anticipated to expand as brands emphasize clinically validated outcomes and position products as long-term solutions for skin health rather than short-term treatments.

Future growth is likely to be supported by dermocosmetic education campaigns, retailer-driven curation, and the inclusion of bioactive retinol alternatives in premium serums and creams. Subscription-based e-commerce models and dermatologist-recommended regimens are projected to drive repeat purchases and retention. Regulatory clarity on clean-label claims is also expected to strengthen consumer trust, encouraging further adoption. Over the forecast period, innovation around encapsulated delivery systems and combination products addressing both aging and acne concerns will likely shape competitive positioning in the USA market.
  • Market value projected at USD 376.4 Million in 2025
  • Anti-aging leads with 53.5% share, signaling strong preventive skincare demand
  • Growth fueled by clinical evidence, D2C subscriptions, and retailer-led education

Opportunity Analysis of China Bioactive Retinol Alternatives Market

Bioactive Retinol Alternatives Market China

Segment Market Value Share, 2025
Clinics/professional 52.5%
Others 47.5%

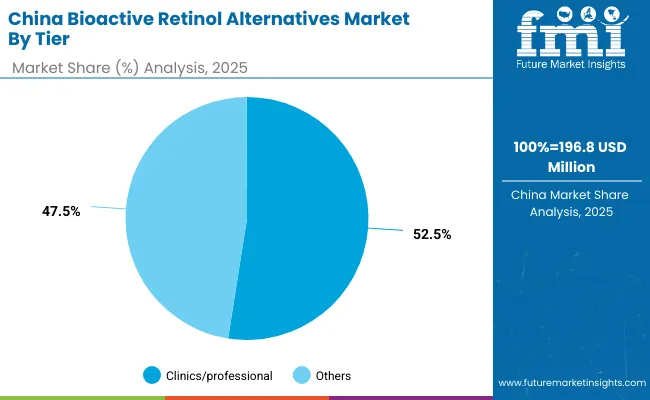
The China Bioactive Retinol Alternatives Market is projected at USD 196.8 Million in 2025, with clinics/professional channels contributing 52.5% (USD 103.3 Million) and other distribution formats holding 47.5% (USD 93.5 Million). The dominance of professional clinics is expected to continue as dermatology-led trust and in-clinic recommendations drive consumer adoption of new actives. Growth is anticipated to be fueled by the rising prevalence of preventive skincare routines, with Chinese consumers increasingly seeking irritation-free anti-aging and brightening solutions.

Digital integration with offline clinics is projected to amplify sales, as appointment-based product education and KOL collaborations enhance awareness. Rising disposable incomes and an accelerated premiumization trend are expected to raise average spend per consumer, favoring higher-margin formulations and specialized regimens. Over the forecast period, localization of botanical actives and TCM-inspired innovation is likely to differentiate offerings, positioning China as one of the fastest-growing markets globally.
  • Market value projected at USD 196.8 Million in 2025
  • Clinics/professional channels lead with 52.5% share, reflecting strong dermatologist influence
  • Growth driven by premiumization, offline-online integration, and TCM-based innovation

Competitive Landscape of Bioactive Retinol Alternatives Market

Bioactive Retinol Alternatives Market By Company

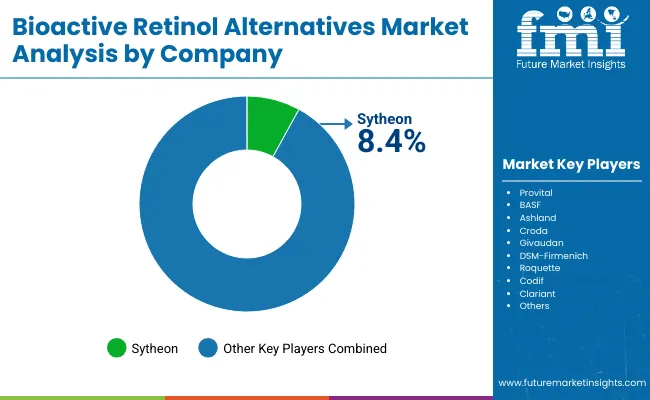
The Bioactive Retinol Alternatives Market is moderately fragmented, with global leaders, mid-sized innovators, and specialized formulators competing across dermatological, cosmeceutical, and wellness-driven skincare segments. Ingredient leaders such as DSM-Firmenich, Givaudan, and BASF have retained dominant market influence due to their extensive R&D infrastructure, regulatory expertise, and clinical validation of key bioactives like bakuchiol and phytosterols. Their portfolios have been increasingly aligned with anti-aging, microbiome-friendly, and pregnancy-safe claims, often supported by multi-center clinical trials and proprietary encapsulation technologies.

Mid-sized players including Ashland, Croda, and Clariant have focused on application-specific delivery systems and botanical extractions tailored for sensitive skin formulations. Customization for hybrid emulsions, time-release serums, and clean-label certifications has been actively prioritized, especially across D2C and premium clinical brands.

Emerging formulators such as Sytheon, Provital, Codif, and Roquette have carved niches by offering high-purity, low-irritation bioactives with strong appeal to minimalist skincare routines. Their strategies have emphasized transparency, local sourcing, and sustainable biotechnology.

Competitive advantage is now shifting from ingredient novelty to formulation compatibility, regulatory transparency, and clinical co-branding potential. Future positioning will likely depend on performance data, sensory profiling, and platform integration into skin diagnostic ecosystems and AI-driven personalization models.

Key Developments in Bioactive Retinol Alternatives Market

  • On April 23, 2025, a supramolecular delivery system for bakuchiol was introduced in a study published in Supramolecular Materials. Its nanoparticle formulation reportedly enhanced permeability by over 4×, boosted collagenI production by 75%, and achieved marked antiTNFα and MMP inhibition setting a new standard for sensitive-skin antiaging efficacy
  • In June 2025, bakuchiol salicylate (bakusylan) was unveiled as a next-generation botanical retinol alternative. This novel molecule has been engineered to deliver enhanced performance and formulation stability over traditional bakuchiol, and is being hailed for its potential to elevate clean-labeled, irritation reducing skincare routines

Scope of the Report

Item Value
Quantitative Units USD Million
Market Size (2025) USD 1,623.2 Million
Market Size (2035) USD 5,406.3 Million
Component Bakuchiol, Alfalfa Extract, Carrot Root Extract, Rosehip Oil, Phytosterols
Functionality Anti-aging, Anti-acne, Brightening, Repair
Product Type Serums, Creams, Oils, Capsules
Distribution Channel E-commerce, Natural Beauty Retail, Pharmacies, D2C
Tier Mass, Masstige, Premium
End-use Applications Clinics/Professional Skincare, OTC Skincare, Cosmeceuticals, Dermaceuticals
Regions Covered North America, Europe, Asia-Pacific, Latin America, Middle East & Africa

Key Segments

By Ingredient:

  • Bakuchiol
  • Alfalfa extract
  • Carrot root extract
  • Rosehip oil
  • Phytosterols

By Function:

  • Anti-aging
  • Anti-acne
  • Brightening
  • Repair

By Product Type:

  • Serums
  • Creams
  • Oils
  • Capsules

By Channel:

  • E-commerce
  • Natural beauty retail
  • Pharmacies
  • D2C

By Tier:

  • Mass
  • Masstige
  • Premium

By Region:

  • North America
  • Latin America
  • Europe
  • East Asia
  • South Asia & Pacific
  • Middle East and Africa

Table of Content

  1. Executive Summary
    • Global Market Outlook
    • Demand-side Trends
    • Supply-side Trends
    • Technology Roadmap Analysis
    • Analysis and Recommendations
  2. Market Overview
    • Market Coverage / Taxonomy
    • Market Definition / Scope / Limitations
  3. Market Background
    • Market Dynamics
      • Drivers
      • Restraints
      • Opportunity
      • Trends
    • Scenario Forecast
      • Demand in Optimistic Scenario
      • Demand in Likely Scenario
      • Demand in Conservative Scenario
    • Opportunity Map Analysis
    • Product Life Cycle Analysis
    • Supply Chain Analysis
      • Supply Side Participants and their Roles
        • Producers
        • Mid-Level Participants (Traders/ Agents/ Brokers)
        • Wholesalers and Distributors
      • Value Added and Value Created at Node in the Supply Chain
      • List of Raw Material Suppliers
      • List of Existing and Potential Buyer’s
    • Investment Feasibility Matrix
    • Value Chain Analysis
      • Profit Margin Analysis
      • Wholesalers and Distributors
      • Retailers
    • PESTLE and Porter’s Analysis
    • Regulatory Landscape
      • By Key Regions
      • By Key Countries
    • Regional Parent Market Outlook
    • Production and Consumption Statistics
    • Import and Export Statistics
  4. Global Market Analysis 2020 to 2024 and Forecast, 2025 to 2035
    • Historical Market Size Value (USD Million) & Volume (Units) Analysis, 2020 to 2024
    • Current and Future Market Size Value (USD Million) & Volume (Units) Projections, 2025 to 2035
      • Y-o-Y Growth Trend Analysis
      • Absolute $ Opportunity Analysis
  5. Global Market Analysis 2020 to 2024 and Forecast 2025 to 2035, By Ingredient
    • Introduction / Key Findings
    • Historical Market Size Value (USD Million) & Volume (Units) Analysis By Ingredient, 2020 to 2024
    • Current and Future Market Size Value (USD Million) & Volume (Units) Analysis and Forecast By Ingredient, 2025 to 2035
      • Bakuchiol
      • Alfalfa extract
      • Carrot root extract
      • Rosehip oil
      • Phytosterols
    • Y-o-Y Growth Trend Analysis By Ingredient, 2020 to 2024
    • Absolute $ Opportunity Analysis By Ingredient, 2025 to 2035
  6. Global Market Analysis 2020 to 2024 and Forecast 2025 to 2035, By Function
    • Introduction / Key Findings
    • Historical Market Size Value (USD Million) & Volume (Units) Analysis By Function, 2020 to 2024
    • Current and Future Market Size Value (USD Million) & Volume (Units) Analysis and Forecast By Function, 2025 to 2035
      • Anti-aging
      • Anti-acne
      • Brightening
      • Repair
    • Y-o-Y Growth Trend Analysis By Function, 2020 to 2024
    • Absolute $ Opportunity Analysis By Function, 2025 to 2035
  7. Global Market Analysis 2020 to 2024 and Forecast 2025 to 2035, By Product Type
    • Introduction / Key Findings
    • Historical Market Size Value (USD Million) & Volume (Units) Analysis By Product Type, 2020 to 2024
    • Current and Future Market Size Value (USD Million) & Volume (Units) Analysis and Forecast By Product Type, 2025 to 2035
      • Serums
      • Creams
      • Oils
      • Capsules
    • Y-o-Y Growth Trend Analysis By Product Type, 2020 to 2024
    • Absolute $ Opportunity Analysis By Product Type, 2025 to 2035
  8. Global Market Analysis 2020 to 2024 and Forecast 2025 to 2035, By Channel
    • Introduction / Key Findings
    • Historical Market Size Value (USD Million) & Volume (Units) Analysis By Channel, 2020 to 2024
    • Current and Future Market Size Value (USD Million) & Volume (Units) Analysis and Forecast By Channel, 2025 to 2035
      • E-commerce
      • Natural beauty retail
      • Pharmacies
      • D2C
    • Y-o-Y Growth Trend Analysis By Channel, 2020 to 2024
    • Absolute $ Opportunity Analysis By Channel, 2025 to 2035
  9. Global Market Analysis 2020 to 2024 and Forecast 2025 to 2035, By Tier
    • Introduction / Key Findings
    • Historical Market Size Value (USD Million) & Volume (Units) Analysis By Tier, 2020 to 2024
    • Current and Future Market Size Value (USD Million) & Volume (Units) Analysis and Forecast By Tier, 2025 to 2035
      • Mass
      • Masstige
      • Premium
    • Y-o-Y Growth Trend Analysis By Tier, 2020 to 2024
    • Absolute $ Opportunity Analysis By Tier, 2025 to 2035
  10. Global Market Analysis 2020 to 2024 and Forecast 2025 to 2035, By Region
    • Introduction
    • Historical Market Size Value (USD Million) & Volume (Units) Analysis By Region, 2020 to 2024
    • Current Market Size Value (USD Million) & Volume (Units) Analysis and Forecast By Region, 2025 to 2035
      • North America
      • Latin America
      • Europe
      • East Asia
      • South Asia & Pacific
      • Middle East and Africa
    • Market Attractiveness Analysis By Region
  11. North America Market Analysis 2020 to 2024 and Forecast 2025 to 2035, By Country
    • Historical Market Size Value (USD Million) & Volume (Units) Trend Analysis By Market Taxonomy, 2020 to 2024
    • Market Size Value (USD Million) & Volume (Units) Forecast By Market Taxonomy, 2025 to 2035
      • By Country
        • USA
        • Canada
      • By Ingredient
      • By Function
      • By Product Type
      • By Channel
      • By Tier
    • Market Attractiveness Analysis
      • By Country
      • By Ingredient
      • By Function
      • By Product Type
      • By Channel
      • By Tier
    • Key Takeaways
  12. Latin America Market Analysis 2020 to 2024 and Forecast 2025 to 2035, By Country
    • Historical Market Size Value (USD Million) & Volume (Units) Trend Analysis By Market Taxonomy, 2020 to 2024
    • Market Size Value (USD Million) & Volume (Units) Forecast By Market Taxonomy, 2025 to 2035
      • By Country
        • Brazil
        • Mexico
        • Colombia
        • Rest of Latin America
      • By Ingredient
      • By Function
      • By Product Type
      • By Channel
      • By Tier
    • Market Attractiveness Analysis
      • By Country
      • By Ingredient
      • By Function
      • By Product Type
      • By Channel
      • By Tier
    • Key Takeaways
  13. Europe Market Analysis 2020 to 2024 and Forecast 2025 to 2035, By Country
    • Historical Market Size Value (USD Million) & Volume (Units) Trend Analysis By Market Taxonomy, 2020 to 2024
    • Market Size Value (USD Million) & Volume (Units) Forecast By Market Taxonomy, 2025 to 2035
      • By Country
        • Germany
        • UK
        • France
        • Italy
        • Spain
        • Belgium
        • Netherlands
        • Nordic
        • Switzerland
        • Russia
        • Poland
        • Rest of Europe
      • By Ingredient
      • By Function
      • By Product Type
      • By Channel
      • By Tier
    • Market Attractiveness Analysis
      • By Country
      • By Ingredient
      • By Function
      • By Product Type
      • By Channel
      • By Tier
    • Key Takeaways
  14. East Asia Market Analysis 2020 to 2024 and Forecast 2025 to 2035, By Country
    • Historical Market Size Value (USD Million) & Volume (Units) Trend Analysis By Market Taxonomy, 2020 to 2024
    • Market Size Value (USD Million) & Volume (Units) Forecast By Market Taxonomy, 2025 to 2035
      • By Country
        • China
        • Japan
        • South Korea
      • By Ingredient
      • By Function
      • By Product Type
      • By Channel
      • By Tier
    • Market Attractiveness Analysis
      • By Country
      • By Ingredient
      • By Function
      • By Product Type
      • By Channel
      • By Tier
    • Key Takeaways
  15. South Asia & Pacific Market Analysis 2020 to 2024 and Forecast 2025 to 2035, By Country
    • Historical Market Size Value (USD Million) & Volume (Units) Trend Analysis By Market Taxonomy, 2020 to 2024
    • Market Size Value (USD Million) & Volume (Units) Forecast By Market Taxonomy, 2025 to 2035
      • By Country
        • India
        • Thailand
        • Malaysia
        • Indonesia
        • Singapore
        • Vietnam
        • Australia
        • New Zealand
        • Rest of South Asia
      • By Ingredient
      • By Function
      • By Product Type
      • By Channel
      • By Tier
    • Market Attractiveness Analysis
      • By Country
      • By Ingredient
      • By Function
      • By Product Type
      • By Channel
      • By Tier
    • Key Takeaways
  16. Middle East and Africa Market Analysis 2020 to 2024 and Forecast 2025 to 2035, By Country
    • Historical Market Size Value (USD Million) & Volume (Units) Trend Analysis By Market Taxonomy, 2020 to 2024
    • Market Size Value (USD Million) & Volume (Units) Forecast By Market Taxonomy, 2025 to 2035
      • By Country
        • Turkey
        • UAE
        • Saudi Arabia
        • Israel
        • Other GCC Countries
        • North Africa
        • South Africa
      • By Ingredient
      • By Function
      • By Product Type
      • By Channel
      • By Tier
    • Market Attractiveness Analysis
      • By Country
      • By Ingredient
      • By Function
      • By Product Type
      • By Channel
      • By Tier
    • Key Takeaways
  17. Key Countries Market Analysis
    • USA
      • Pricing Analysis
      • Market Share Analysis, 2024
        • By Ingredient
        • By Function
        • By Product Type
        • By Channel
        • By Tier
    • Canada
      • Pricing Analysis
      • Market Share Analysis, 2024
        • By Ingredient
        • By Function
        • By Product Type
        • By Channel
        • By Tier
    • Brazil
      • Pricing Analysis
      • Market Share Analysis, 2024
        • By Ingredient
        • By Function
        • By Product Type
        • By Channel
        • By Tier
    • Mexico
      • Pricing Analysis
      • Market Share Analysis, 2024
        • By Ingredient
        • By Function
        • By Product Type
        • By Channel
        • By Tier
    • Colombia
      • Pricing Analysis
      • Market Share Analysis, 2024
        • By Ingredient
        • By Function
        • By Product Type
        • By Channel
        • By Tier
    • Germany
      • Pricing Analysis
      • Market Share Analysis, 2024
        • By Ingredient
        • By Function
        • By Product Type
        • By Channel
        • By Tier
    • UK
      • Pricing Analysis
      • Market Share Analysis, 2024
        • By Ingredient
        • By Function
        • By Product Type
        • By Channel
        • By Tier
    • France
      • Pricing Analysis
      • Market Share Analysis, 2024
        • By Ingredient
        • By Function
        • By Product Type
        • By Channel
        • By Tier
    • Italy
      • Pricing Analysis
      • Market Share Analysis, 2024
        • By Ingredient
        • By Function
        • By Product Type
        • By Channel
        • By Tier
    • Spain
      • Pricing Analysis
      • Market Share Analysis, 2024
        • By Ingredient
        • By Function
        • By Product Type
        • By Channel
        • By Tier
    • Belgium
      • Pricing Analysis
      • Market Share Analysis, 2024
        • By Ingredient
        • By Function
        • By Product Type
        • By Channel
        • By Tier
    • Netherlands
      • Pricing Analysis
      • Market Share Analysis, 2024
        • By Ingredient
        • By Function
        • By Product Type
        • By Channel
        • By Tier
    • Nordic
      • Pricing Analysis
      • Market Share Analysis, 2024
        • By Ingredient
        • By Function
        • By Product Type
        • By Channel
        • By Tier
    • Switzerland
      • Pricing Analysis
      • Market Share Analysis, 2024
        • By Ingredient
        • By Function
        • By Product Type
        • By Channel
        • By Tier
    • Russia
      • Pricing Analysis
      • Market Share Analysis, 2024
        • By Ingredient
        • By Function
        • By Product Type
        • By Channel
        • By Tier
    • Poland
      • Pricing Analysis
      • Market Share Analysis, 2024
        • By Ingredient
        • By Function
        • By Product Type
        • By Channel
        • By Tier
    • China
      • Pricing Analysis
      • Market Share Analysis, 2024
        • By Ingredient
        • By Function
        • By Product Type
        • By Channel
        • By Tier
    • Japan
      • Pricing Analysis
      • Market Share Analysis, 2024
        • By Ingredient
        • By Function
        • By Product Type
        • By Channel
        • By Tier
    • South Korea
      • Pricing Analysis
      • Market Share Analysis, 2024
        • By Ingredient
        • By Function
        • By Product Type
        • By Channel
        • By Tier
    • India
      • Pricing Analysis
      • Market Share Analysis, 2024
        • By Ingredient
        • By Function
        • By Product Type
        • By Channel
        • By Tier
    • Thailand
      • Pricing Analysis
      • Market Share Analysis, 2024
        • By Ingredient
        • By Function
        • By Product Type
        • By Channel
        • By Tier
    • Indonesia
      • Pricing Analysis
      • Market Share Analysis, 2024
        • By Ingredient
        • By Function
        • By Product Type
        • By Channel
        • By Tier
    • Australia
      • Pricing Analysis
      • Market Share Analysis, 2024
        • By Ingredient
        • By Function
        • By Product Type
        • By Channel
        • By Tier
    • New Zealand
      • Pricing Analysis
      • Market Share Analysis, 2024
        • By Ingredient
        • By Function
        • By Product Type
        • By Channel
        • By Tier
    • Turkey
      • Pricing Analysis
      • Market Share Analysis, 2024
        • By Ingredient
        • By Function
        • By Product Type
        • By Channel
        • By Tier
    • UAE
      • Pricing Analysis
      • Market Share Analysis, 2024
        • By Ingredient
        • By Function
        • By Product Type
        • By Channel
        • By Tier
    • Saudi Arabia
      • Pricing Analysis
      • Market Share Analysis, 2024
        • By Ingredient
        • By Function
        • By Product Type
        • By Channel
        • By Tier
    • Israel
      • Pricing Analysis
      • Market Share Analysis, 2024
        • By Ingredient
        • By Function
        • By Product Type
        • By Channel
        • By Tier
    • North Africa
      • Pricing Analysis
      • Market Share Analysis, 2024
        • By Ingredient
        • By Function
        • By Product Type
        • By Channel
        • By Tier
    • South Africa
      • Pricing Analysis
      • Market Share Analysis, 2024
        • By Ingredient
        • By Function
        • By Product Type
        • By Channel
        • By Tier
  18. Market Structure Analysis
    • Competition Dashboard
    • Competition Benchmarking
    • Market Share Analysis of Top Players
      • By Regional
      • By Ingredient
      • By Function
      • By Product Type
      • By Channel
      • By Tier
  19. Competition Analysis
    • Competition Deep Dive
      • Sytheon
        • Overview
        • Product Portfolio
        • Profitability by Market Segments (Product/Age /Sales Channel/Region)
        • Sales Footprint
        • Strategy Overview
          • Marketing Strategy
          • Product Strategy
          • Channel Strategy
      • Provital
        • Overview
        • Product Portfolio
        • Profitability by Market Segments (Product/Age /Sales Channel/Region)
        • Sales Footprint
        • Strategy Overview
          • Marketing Strategy
          • Product Strategy
          • Channel Strategy
      • BASF
        • Overview
        • Product Portfolio
        • Profitability by Market Segments (Product/Age /Sales Channel/Region)
        • Sales Footprint
        • Strategy Overview
          • Marketing Strategy
          • Product Strategy
          • Channel Strategy
      • Ashland
        • Overview
        • Product Portfolio
        • Profitability by Market Segments (Product/Age /Sales Channel/Region)
        • Sales Footprint
        • Strategy Overview
          • Marketing Strategy
          • Product Strategy
          • Channel Strategy
      • Croda
        • Overview
        • Product Portfolio
        • Profitability by Market Segments (Product/Age /Sales Channel/Region)
        • Sales Footprint
        • Strategy Overview
          • Marketing Strategy
          • Product Strategy
          • Channel Strategy
      • Givaudan
        • Overview
        • Product Portfolio
        • Profitability by Market Segments (Product/Age /Sales Channel/Region)
        • Sales Footprint
        • Strategy Overview
          • Marketing Strategy
          • Product Strategy
          • Channel Strategy
      • DSM-Firmenich
        • Overview
        • Product Portfolio
        • Profitability by Market Segments (Product/Age /Sales Channel/Region)
        • Sales Footprint
        • Strategy Overview
          • Marketing Strategy
          • Product Strategy
          • Channel Strategy
      • Roquette
        • Overview
        • Product Portfolio
        • Profitability by Market Segments (Product/Age /Sales Channel/Region)
        • Sales Footprint
        • Strategy Overview
          • Marketing Strategy
          • Product Strategy
          • Channel Strategy
      • Codif
        • Overview
        • Product Portfolio
        • Profitability by Market Segments (Product/Age /Sales Channel/Region)
        • Sales Footprint
        • Strategy Overview
          • Marketing Strategy
          • Product Strategy
          • Channel Strategy
      • Clariant
        • Overview
        • Product Portfolio
        • Profitability by Market Segments (Product/Age /Sales Channel/Region)
        • Sales Footprint
        • Strategy Overview
          • Marketing Strategy
          • Product Strategy
          • Channel Strategy
      • Others
        • Overview
        • Product Portfolio
        • Profitability by Market Segments (Product/Age /Sales Channel/Region)
        • Sales Footprint
        • Strategy Overview
          • Marketing Strategy
          • Product Strategy
          • Channel Strategy
  20. Assumptions & Acronyms Used
  21. Research Methodology

List of Tables

  • Table 1: Global Market Value (USD Million) Forecast by Region, 2020-2035
  • Table 2: Global Market Volume (Units) Forecast by Region, 2020-2035
  • Table 3: Global Market Value (USD Million) Forecast by Ingredient, 2020-2035
  • Table 4: Global Market Volume (Units) Forecast by Ingredient, 2020-2035
  • Table 5: Global Market Value (USD Million) Forecast by Function, 2020-2035
  • Table 6: Global Market Volume (Units) Forecast by Function, 2020-2035
  • Table 7: Global Market Value (USD Million) Forecast by Product Type, 2020-2035
  • Table 8: Global Market Volume (Units) Forecast by Product Type, 2020-2035
  • Table 9: Global Market Value (USD Million) Forecast by Channel, 2020-2035
  • Table 10: Global Market Volume (Units) Forecast by Channel, 2020-2035
  • Table 11: Global Market Value (USD Million) Forecast by Tier, 2020-2035
  • Table 12: Global Market Volume (Units) Forecast by Tier, 2020-2035
  • Table 13: North America Market Value (USD Million) Forecast by Country, 2020-2035
  • Table 14: North America Market Volume (Units) Forecast by Country, 2020-2035
  • Table 15: North America Market Value (USD Million) Forecast by Ingredient, 2020-2035
  • Table 16: North America Market Volume (Units) Forecast by Ingredient, 2020-2035
  • Table 17: North America Market Value (USD Million) Forecast by Function, 2020-2035
  • Table 18: North America Market Volume (Units) Forecast by Function, 2020-2035
  • Table 19: North America Market Value (USD Million) Forecast by Product Type, 2020-2035
  • Table 20: North America Market Volume (Units) Forecast by Product Type, 2020-2035
  • Table 21: North America Market Value (USD Million) Forecast by Channel, 2020-2035
  • Table 22: North America Market Volume (Units) Forecast by Channel, 2020-2035
  • Table 23: North America Market Value (USD Million) Forecast by Tier, 2020-2035
  • Table 24: North America Market Volume (Units) Forecast by Tier, 2020-2035
  • Table 25: Latin America Market Value (USD Million) Forecast by Country, 2020-2035
  • Table 26: Latin America Market Volume (Units) Forecast by Country, 2020-2035
  • Table 27: Latin America Market Value (USD Million) Forecast by Ingredient, 2020-2035
  • Table 28: Latin America Market Volume (Units) Forecast by Ingredient, 2020-2035
  • Table 29: Latin America Market Value (USD Million) Forecast by Function, 2020-2035
  • Table 30: Latin America Market Volume (Units) Forecast by Function, 2020-2035
  • Table 31: Latin America Market Value (USD Million) Forecast by Product Type, 2020-2035
  • Table 32: Latin America Market Volume (Units) Forecast by Product Type, 2020-2035
  • Table 33: Latin America Market Value (USD Million) Forecast by Channel, 2020-2035
  • Table 34: Latin America Market Volume (Units) Forecast by Channel, 2020-2035
  • Table 35: Latin America Market Value (USD Million) Forecast by Tier, 2020-2035
  • Table 36: Latin America Market Volume (Units) Forecast by Tier, 2020-2035
  • Table 37: Europe Market Value (USD Million) Forecast by Country, 2020-2035
  • Table 38: Europe Market Volume (Units) Forecast by Country, 2020-2035
  • Table 39: Europe Market Value (USD Million) Forecast by Ingredient, 2020-2035
  • Table 40: Europe Market Volume (Units) Forecast by Ingredient, 2020-2035
  • Table 41: Europe Market Value (USD Million) Forecast by Function, 2020-2035
  • Table 42: Europe Market Volume (Units) Forecast by Function, 2020-2035
  • Table 43: Europe Market Value (USD Million) Forecast by Product Type, 2020-2035
  • Table 44: Europe Market Volume (Units) Forecast by Product Type, 2020-2035
  • Table 45: Europe Market Value (USD Million) Forecast by Channel, 2020-2035
  • Table 46: Europe Market Volume (Units) Forecast by Channel, 2020-2035
  • Table 47: Europe Market Value (USD Million) Forecast by Tier, 2020-2035
  • Table 48: Europe Market Volume (Units) Forecast by Tier, 2020-2035
  • Table 49: East Asia Market Value (USD Million) Forecast by Country, 2020-2035
  • Table 50: East Asia Market Volume (Units) Forecast by Country, 2020-2035
  • Table 51: East Asia Market Value (USD Million) Forecast by Ingredient, 2020-2035
  • Table 52: East Asia Market Volume (Units) Forecast by Ingredient, 2020-2035
  • Table 53: East Asia Market Value (USD Million) Forecast by Function, 2020-2035
  • Table 54: East Asia Market Volume (Units) Forecast by Function, 2020-2035
  • Table 55: East Asia Market Value (USD Million) Forecast by Product Type, 2020-2035
  • Table 56: East Asia Market Volume (Units) Forecast by Product Type, 2020-2035
  • Table 57: East Asia Market Value (USD Million) Forecast by Channel, 2020-2035
  • Table 58: East Asia Market Volume (Units) Forecast by Channel, 2020-2035
  • Table 59: East Asia Market Value (USD Million) Forecast by Tier, 2020-2035
  • Table 60: East Asia Market Volume (Units) Forecast by Tier, 2020-2035
  • Table 61: South Asia & Pacific Market Value (USD Million) Forecast by Country, 2020-2035
  • Table 62: South Asia & Pacific Market Volume (Units) Forecast by Country, 2020-2035
  • Table 63: South Asia & Pacific Market Value (USD Million) Forecast by Ingredient, 2020-2035
  • Table 64: South Asia & Pacific Market Volume (Units) Forecast by Ingredient, 2020-2035
  • Table 65: South Asia & Pacific Market Value (USD Million) Forecast by Function, 2020-2035
  • Table 66: South Asia & Pacific Market Volume (Units) Forecast by Function, 2020-2035
  • Table 67: South Asia & Pacific Market Value (USD Million) Forecast by Product Type, 2020-2035
  • Table 68: South Asia & Pacific Market Volume (Units) Forecast by Product Type, 2020-2035
  • Table 69: South Asia & Pacific Market Value (USD Million) Forecast by Channel, 2020-2035
  • Table 70: South Asia & Pacific Market Volume (Units) Forecast by Channel, 2020-2035
  • Table 71: South Asia & Pacific Market Value (USD Million) Forecast by Tier, 2020-2035
  • Table 72: South Asia & Pacific Market Volume (Units) Forecast by Tier, 2020-2035
  • Table 73: Middle East and Africa Market Value (USD Million) Forecast by Country, 2020-2035
  • Table 74: Middle East and Africa Market Volume (Units) Forecast by Country, 2020-2035
  • Table 75: Middle East and Africa Market Value (USD Million) Forecast by Ingredient, 2020-2035
  • Table 76: Middle East and Africa Market Volume (Units) Forecast by Ingredient, 2020-2035
  • Table 77: Middle East and Africa Market Value (USD Million) Forecast by Function, 2020-2035
  • Table 78: Middle East and Africa Market Volume (Units) Forecast by Function, 2020-2035
  • Table 79: Middle East and Africa Market Value (USD Million) Forecast by Product Type, 2020-2035
  • Table 80: Middle East and Africa Market Volume (Units) Forecast by Product Type, 2020-2035
  • Table 81: Middle East and Africa Market Value (USD Million) Forecast by Channel, 2020-2035
  • Table 82: Middle East and Africa Market Volume (Units) Forecast by Channel, 2020-2035
  • Table 83: Middle East and Africa Market Value (USD Million) Forecast by Tier, 2020-2035
  • Table 84: Middle East and Africa Market Volume (Units) Forecast by Tier, 2020-2035

List of Figures

  • Figure 1: Global Market Value (USD Million) by Ingredient, 2025-2035
  • Figure 2: Global Market Value (USD Million) by Function, 2025-2035
  • Figure 3: Global Market Value (USD Million) by Product Type, 2025-2035
  • Figure 4: Global Market Value (USD Million) by Channel, 2025-2035
  • Figure 5: Global Market Value (USD Million) by Tier, 2025-2035
  • Figure 6: Global Market Value (USD Million) by Region, 2025-2035
  • Figure 7: Global Market Value (USD Million) Analysis by Region, 2020-2035
  • Figure 8: Global Market Volume (Units) Analysis by Region, 2020-2035
  • Figure 9: Global Market Value Share (%) and BPS Analysis by Region, 2025-2035
  • Figure 10: Global Market Y-o-Y Growth (%) Projections by Region, 2025-2035
  • Figure 11: Global Market Value (USD Million) Analysis by Ingredient, 2020-2035
  • Figure 12: Global Market Volume (Units) Analysis by Ingredient, 2020-2035
  • Figure 13: Global Market Value Share (%) and BPS Analysis by Ingredient, 2025-2035
  • Figure 14: Global Market Y-o-Y Growth (%) Projections by Ingredient, 2025-2035
  • Figure 15: Global Market Value (USD Million) Analysis by Function, 2020-2035
  • Figure 16: Global Market Volume (Units) Analysis by Function, 2020-2035
  • Figure 17: Global Market Value Share (%) and BPS Analysis by Function, 2025-2035
  • Figure 18: Global Market Y-o-Y Growth (%) Projections by Function, 2025-2035
  • Figure 19: Global Market Value (USD Million) Analysis by Product Type, 2020-2035
  • Figure 20: Global Market Volume (Units) Analysis by Product Type, 2020-2035
  • Figure 21: Global Market Value Share (%) and BPS Analysis by Product Type, 2025-2035
  • Figure 22: Global Market Y-o-Y Growth (%) Projections by Product Type, 2025-2035
  • Figure 23: Global Market Value (USD Million) Analysis by Channel, 2020-2035
  • Figure 24: Global Market Volume (Units) Analysis by Channel, 2020-2035
  • Figure 25: Global Market Value Share (%) and BPS Analysis by Channel, 2025-2035
  • Figure 26: Global Market Y-o-Y Growth (%) Projections by Channel, 2025-2035
  • Figure 27: Global Market Value (USD Million) Analysis by Tier, 2020-2035
  • Figure 28: Global Market Volume (Units) Analysis by Tier, 2020-2035
  • Figure 29: Global Market Value Share (%) and BPS Analysis by Tier, 2025-2035
  • Figure 30: Global Market Y-o-Y Growth (%) Projections by Tier, 2025-2035
  • Figure 31: Global Market Attractiveness by Ingredient, 2025-2035
  • Figure 32: Global Market Attractiveness by Function, 2025-2035
  • Figure 33: Global Market Attractiveness by Product Type, 2025-2035
  • Figure 34: Global Market Attractiveness by Channel, 2025-2035
  • Figure 35: Global Market Attractiveness by Tier, 2025-2035
  • Figure 36: Global Market Attractiveness by Region, 2025-2035
  • Figure 37: North America Market Value (USD Million) by Ingredient, 2025-2035
  • Figure 38: North America Market Value (USD Million) by Function, 2025-2035
  • Figure 39: North America Market Value (USD Million) by Product Type, 2025-2035
  • Figure 40: North America Market Value (USD Million) by Channel, 2025-2035
  • Figure 41: North America Market Value (USD Million) by Tier, 2025-2035
  • Figure 42: North America Market Value (USD Million) by Country, 2025-2035
  • Figure 43: North America Market Value (USD Million) Analysis by Country, 2020-2035
  • Figure 44: North America Market Volume (Units) Analysis by Country, 2020-2035
  • Figure 45: North America Market Value Share (%) and BPS Analysis by Country, 2025-2035
  • Figure 46: North America Market Y-o-Y Growth (%) Projections by Country, 2025-2035
  • Figure 47: North America Market Value (USD Million) Analysis by Ingredient, 2020-2035
  • Figure 48: North America Market Volume (Units) Analysis by Ingredient, 2020-2035
  • Figure 49: North America Market Value Share (%) and BPS Analysis by Ingredient, 2025-2035
  • Figure 50: North America Market Y-o-Y Growth (%) Projections by Ingredient, 2025-2035
  • Figure 51: North America Market Value (USD Million) Analysis by Function, 2020-2035
  • Figure 52: North America Market Volume (Units) Analysis by Function, 2020-2035
  • Figure 53: North America Market Value Share (%) and BPS Analysis by Function, 2025-2035
  • Figure 54: North America Market Y-o-Y Growth (%) Projections by Function, 2025-2035
  • Figure 55: North America Market Value (USD Million) Analysis by Product Type, 2020-2035
  • Figure 56: North America Market Volume (Units) Analysis by Product Type, 2020-2035
  • Figure 57: North America Market Value Share (%) and BPS Analysis by Product Type, 2025-2035
  • Figure 58: North America Market Y-o-Y Growth (%) Projections by Product Type, 2025-2035
  • Figure 59: North America Market Value (USD Million) Analysis by Channel, 2020-2035
  • Figure 60: North America Market Volume (Units) Analysis by Channel, 2020-2035
  • Figure 61: North America Market Value Share (%) and BPS Analysis by Channel, 2025-2035
  • Figure 62: North America Market Y-o-Y Growth (%) Projections by Channel, 2025-2035
  • Figure 63: North America Market Value (USD Million) Analysis by Tier, 2020-2035
  • Figure 64: North America Market Volume (Units) Analysis by Tier, 2020-2035
  • Figure 65: North America Market Value Share (%) and BPS Analysis by Tier, 2025-2035
  • Figure 66: North America Market Y-o-Y Growth (%) Projections by Tier, 2025-2035
  • Figure 67: North America Market Attractiveness by Ingredient, 2025-2035
  • Figure 68: North America Market Attractiveness by Function, 2025-2035
  • Figure 69: North America Market Attractiveness by Product Type, 2025-2035
  • Figure 70: North America Market Attractiveness by Channel, 2025-2035
  • Figure 71: North America Market Attractiveness by Tier, 2025-2035
  • Figure 72: North America Market Attractiveness by Country, 2025-2035
  • Figure 73: Latin America Market Value (USD Million) by Ingredient, 2025-2035
  • Figure 74: Latin America Market Value (USD Million) by Function, 2025-2035
  • Figure 75: Latin America Market Value (USD Million) by Product Type, 2025-2035
  • Figure 76: Latin America Market Value (USD Million) by Channel, 2025-2035
  • Figure 77: Latin America Market Value (USD Million) by Tier, 2025-2035
  • Figure 78: Latin America Market Value (USD Million) by Country, 2025-2035
  • Figure 79: Latin America Market Value (USD Million) Analysis by Country, 2020-2035
  • Figure 80: Latin America Market Volume (Units) Analysis by Country, 2020-2035
  • Figure 81: Latin America Market Value Share (%) and BPS Analysis by Country, 2025-2035
  • Figure 82: Latin America Market Y-o-Y Growth (%) Projections by Country, 2025-2035
  • Figure 83: Latin America Market Value (USD Million) Analysis by Ingredient, 2020-2035
  • Figure 84: Latin America Market Volume (Units) Analysis by Ingredient, 2020-2035
  • Figure 85: Latin America Market Value Share (%) and BPS Analysis by Ingredient, 2025-2035
  • Figure 86: Latin America Market Y-o-Y Growth (%) Projections by Ingredient, 2025-2035
  • Figure 87: Latin America Market Value (USD Million) Analysis by Function, 2020-2035
  • Figure 88: Latin America Market Volume (Units) Analysis by Function, 2020-2035
  • Figure 89: Latin America Market Value Share (%) and BPS Analysis by Function, 2025-2035
  • Figure 90: Latin America Market Y-o-Y Growth (%) Projections by Function, 2025-2035
  • Figure 91: Latin America Market Value (USD Million) Analysis by Product Type, 2020-2035
  • Figure 92: Latin America Market Volume (Units) Analysis by Product Type, 2020-2035
  • Figure 93: Latin America Market Value Share (%) and BPS Analysis by Product Type, 2025-2035
  • Figure 94: Latin America Market Y-o-Y Growth (%) Projections by Product Type, 2025-2035
  • Figure 95: Latin America Market Value (USD Million) Analysis by Channel, 2020-2035
  • Figure 96: Latin America Market Volume (Units) Analysis by Channel, 2020-2035
  • Figure 97: Latin America Market Value Share (%) and BPS Analysis by Channel, 2025-2035
  • Figure 98: Latin America Market Y-o-Y Growth (%) Projections by Channel, 2025-2035
  • Figure 99: Latin America Market Value (USD Million) Analysis by Tier, 2020-2035
  • Figure 100: Latin America Market Volume (Units) Analysis by Tier, 2020-2035
  • Figure 101: Latin America Market Value Share (%) and BPS Analysis by Tier, 2025-2035
  • Figure 102: Latin America Market Y-o-Y Growth (%) Projections by Tier, 2025-2035
  • Figure 103: Latin America Market Attractiveness by Ingredient, 2025-2035
  • Figure 104: Latin America Market Attractiveness by Function, 2025-2035
  • Figure 105: Latin America Market Attractiveness by Product Type, 2025-2035
  • Figure 106: Latin America Market Attractiveness by Channel, 2025-2035
  • Figure 107: Latin America Market Attractiveness by Tier, 2025-2035
  • Figure 108: Latin America Market Attractiveness by Country, 2025-2035
  • Figure 109: Europe Market Value (USD Million) by Ingredient, 2025-2035
  • Figure 110: Europe Market Value (USD Million) by Function, 2025-2035
  • Figure 111: Europe Market Value (USD Million) by Product Type, 2025-2035
  • Figure 112: Europe Market Value (USD Million) by Channel, 2025-2035
  • Figure 113: Europe Market Value (USD Million) by Tier, 2025-2035
  • Figure 114: Europe Market Value (USD Million) by Country, 2025-2035
  • Figure 115: Europe Market Value (USD Million) Analysis by Country, 2020-2035
  • Figure 116: Europe Market Volume (Units) Analysis by Country, 2020-2035
  • Figure 117: Europe Market Value Share (%) and BPS Analysis by Country, 2025-2035
  • Figure 118: Europe Market Y-o-Y Growth (%) Projections by Country, 2025-2035
  • Figure 119: Europe Market Value (USD Million) Analysis by Ingredient, 2020-2035
  • Figure 120: Europe Market Volume (Units) Analysis by Ingredient, 2020-2035
  • Figure 121: Europe Market Value Share (%) and BPS Analysis by Ingredient, 2025-2035
  • Figure 122: Europe Market Y-o-Y Growth (%) Projections by Ingredient, 2025-2035
  • Figure 123: Europe Market Value (USD Million) Analysis by Function, 2020-2035
  • Figure 124: Europe Market Volume (Units) Analysis by Function, 2020-2035
  • Figure 125: Europe Market Value Share (%) and BPS Analysis by Function, 2025-2035
  • Figure 126: Europe Market Y-o-Y Growth (%) Projections by Function, 2025-2035
  • Figure 127: Europe Market Value (USD Million) Analysis by Product Type, 2020-2035
  • Figure 128: Europe Market Volume (Units) Analysis by Product Type, 2020-2035
  • Figure 129: Europe Market Value Share (%) and BPS Analysis by Product Type, 2025-2035
  • Figure 130: Europe Market Y-o-Y Growth (%) Projections by Product Type, 2025-2035
  • Figure 131: Europe Market Value (USD Million) Analysis by Channel, 2020-2035
  • Figure 132: Europe Market Volume (Units) Analysis by Channel, 2020-2035
  • Figure 133: Europe Market Value Share (%) and BPS Analysis by Channel, 2025-2035
  • Figure 134: Europe Market Y-o-Y Growth (%) Projections by Channel, 2025-2035
  • Figure 135: Europe Market Value (USD Million) Analysis by Tier, 2020-2035
  • Figure 136: Europe Market Volume (Units) Analysis by Tier, 2020-2035
  • Figure 137: Europe Market Value Share (%) and BPS Analysis by Tier, 2025-2035
  • Figure 138: Europe Market Y-o-Y Growth (%) Projections by Tier, 2025-2035
  • Figure 139: Europe Market Attractiveness by Ingredient, 2025-2035
  • Figure 140: Europe Market Attractiveness by Function, 2025-2035
  • Figure 141: Europe Market Attractiveness by Product Type, 2025-2035
  • Figure 142: Europe Market Attractiveness by Channel, 2025-2035
  • Figure 143: Europe Market Attractiveness by Tier, 2025-2035
  • Figure 144: Europe Market Attractiveness by Country, 2025-2035
  • Figure 145: East Asia Market Value (USD Million) by Ingredient, 2025-2035
  • Figure 146: East Asia Market Value (USD Million) by Function, 2025-2035
  • Figure 147: East Asia Market Value (USD Million) by Product Type, 2025-2035
  • Figure 148: East Asia Market Value (USD Million) by Channel, 2025-2035
  • Figure 149: East Asia Market Value (USD Million) by Tier, 2025-2035
  • Figure 150: East Asia Market Value (USD Million) by Country, 2025-2035
  • Figure 151: East Asia Market Value (USD Million) Analysis by Country, 2020-2035
  • Figure 152: East Asia Market Volume (Units) Analysis by Country, 2020-2035
  • Figure 153: East Asia Market Value Share (%) and BPS Analysis by Country, 2025-2035
  • Figure 154: East Asia Market Y-o-Y Growth (%) Projections by Country, 2025-2035
  • Figure 155: East Asia Market Value (USD Million) Analysis by Ingredient, 2020-2035
  • Figure 156: East Asia Market Volume (Units) Analysis by Ingredient, 2020-2035
  • Figure 157: East Asia Market Value Share (%) and BPS Analysis by Ingredient, 2025-2035
  • Figure 158: East Asia Market Y-o-Y Growth (%) Projections by Ingredient, 2025-2035
  • Figure 159: East Asia Market Value (USD Million) Analysis by Function, 2020-2035
  • Figure 160: East Asia Market Volume (Units) Analysis by Function, 2020-2035
  • Figure 161: East Asia Market Value Share (%) and BPS Analysis by Function, 2025-2035
  • Figure 162: East Asia Market Y-o-Y Growth (%) Projections by Function, 2025-2035
  • Figure 163: East Asia Market Value (USD Million) Analysis by Product Type, 2020-2035
  • Figure 164: East Asia Market Volume (Units) Analysis by Product Type, 2020-2035
  • Figure 165: East Asia Market Value Share (%) and BPS Analysis by Product Type, 2025-2035
  • Figure 166: East Asia Market Y-o-Y Growth (%) Projections by Product Type, 2025-2035
  • Figure 167: East Asia Market Value (USD Million) Analysis by Channel, 2020-2035
  • Figure 168: East Asia Market Volume (Units) Analysis by Channel, 2020-2035
  • Figure 169: East Asia Market Value Share (%) and BPS Analysis by Channel, 2025-2035
  • Figure 170: East Asia Market Y-o-Y Growth (%) Projections by Channel, 2025-2035
  • Figure 171: East Asia Market Value (USD Million) Analysis by Tier, 2020-2035
  • Figure 172: East Asia Market Volume (Units) Analysis by Tier, 2020-2035
  • Figure 173: East Asia Market Value Share (%) and BPS Analysis by Tier, 2025-2035
  • Figure 174: East Asia Market Y-o-Y Growth (%) Projections by Tier, 2025-2035
  • Figure 175: East Asia Market Attractiveness by Ingredient, 2025-2035
  • Figure 176: East Asia Market Attractiveness by Function, 2025-2035
  • Figure 177: East Asia Market Attractiveness by Product Type, 2025-2035
  • Figure 178: East Asia Market Attractiveness by Channel, 2025-2035
  • Figure 179: East Asia Market Attractiveness by Tier, 2025-2035
  • Figure 180: East Asia Market Attractiveness by Country, 2025-2035
  • Figure 181: South Asia & Pacific Market Value (USD Million) by Ingredient, 2025-2035
  • Figure 182: South Asia & Pacific Market Value (USD Million) by Function, 2025-2035
  • Figure 183: South Asia & Pacific Market Value (USD Million) by Product Type, 2025-2035
  • Figure 184: South Asia & Pacific Market Value (USD Million) by Channel, 2025-2035
  • Figure 185: South Asia & Pacific Market Value (USD Million) by Tier, 2025-2035
  • Figure 186: South Asia & Pacific Market Value (USD Million) by Country, 2025-2035
  • Figure 187: South Asia & Pacific Market Value (USD Million) Analysis by Country, 2020-2035
  • Figure 188: South Asia & Pacific Market Volume (Units) Analysis by Country, 2020-2035
  • Figure 189: South Asia & Pacific Market Value Share (%) and BPS Analysis by Country, 2025-2035
  • Figure 190: South Asia & Pacific Market Y-o-Y Growth (%) Projections by Country, 2025-2035
  • Figure 191: South Asia & Pacific Market Value (USD Million) Analysis by Ingredient, 2020-2035
  • Figure 192: South Asia & Pacific Market Volume (Units) Analysis by Ingredient, 2020-2035
  • Figure 193: South Asia & Pacific Market Value Share (%) and BPS Analysis by Ingredient, 2025-2035
  • Figure 194: South Asia & Pacific Market Y-o-Y Growth (%) Projections by Ingredient, 2025-2035
  • Figure 195: South Asia & Pacific Market Value (USD Million) Analysis by Function, 2020-2035
  • Figure 196: South Asia & Pacific Market Volume (Units) Analysis by Function, 2020-2035
  • Figure 197: South Asia & Pacific Market Value Share (%) and BPS Analysis by Function, 2025-2035
  • Figure 198: South Asia & Pacific Market Y-o-Y Growth (%) Projections by Function, 2025-2035
  • Figure 199: South Asia & Pacific Market Value (USD Million) Analysis by Product Type, 2020-2035
  • Figure 200: South Asia & Pacific Market Volume (Units) Analysis by Product Type, 2020-2035
  • Figure 201: South Asia & Pacific Market Value Share (%) and BPS Analysis by Product Type, 2025-2035
  • Figure 202: South Asia & Pacific Market Y-o-Y Growth (%) Projections by Product Type, 2025-2035
  • Figure 203: South Asia & Pacific Market Value (USD Million) Analysis by Channel, 2020-2035
  • Figure 204: South Asia & Pacific Market Volume (Units) Analysis by Channel, 2020-2035
  • Figure 205: South Asia & Pacific Market Value Share (%) and BPS Analysis by Channel, 2025-2035
  • Figure 206: South Asia & Pacific Market Y-o-Y Growth (%) Projections by Channel, 2025-2035
  • Figure 207: South Asia & Pacific Market Value (USD Million) Analysis by Tier, 2020-2035
  • Figure 208: South Asia & Pacific Market Volume (Units) Analysis by Tier, 2020-2035
  • Figure 209: South Asia & Pacific Market Value Share (%) and BPS Analysis by Tier, 2025-2035
  • Figure 210: South Asia & Pacific Market Y-o-Y Growth (%) Projections by Tier, 2025-2035
  • Figure 211: South Asia & Pacific Market Attractiveness by Ingredient, 2025-2035
  • Figure 212: South Asia & Pacific Market Attractiveness by Function, 2025-2035
  • Figure 213: South Asia & Pacific Market Attractiveness by Product Type, 2025-2035
  • Figure 214: South Asia & Pacific Market Attractiveness by Channel, 2025-2035
  • Figure 215: South Asia & Pacific Market Attractiveness by Tier, 2025-2035
  • Figure 216: South Asia & Pacific Market Attractiveness by Country, 2025-2035
  • Figure 217: Middle East and Africa Market Value (USD Million) by Ingredient, 2025-2035
  • Figure 218: Middle East and Africa Market Value (USD Million) by Function, 2025-2035
  • Figure 219: Middle East and Africa Market Value (USD Million) by Product Type, 2025-2035
  • Figure 220: Middle East and Africa Market Value (USD Million) by Channel, 2025-2035
  • Figure 221: Middle East and Africa Market Value (USD Million) by Tier, 2025-2035
  • Figure 222: Middle East and Africa Market Value (USD Million) by Country, 2025-2035
  • Figure 223: Middle East and Africa Market Value (USD Million) Analysis by Country, 2020-2035
  • Figure 224: Middle East and Africa Market Volume (Units) Analysis by Country, 2020-2035
  • Figure 225: Middle East and Africa Market Value Share (%) and BPS Analysis by Country, 2025-2035
  • Figure 226: Middle East and Africa Market Y-o-Y Growth (%) Projections by Country, 2025-2035
  • Figure 227: Middle East and Africa Market Value (USD Million) Analysis by Ingredient, 2020-2035
  • Figure 228: Middle East and Africa Market Volume (Units) Analysis by Ingredient, 2020-2035
  • Figure 229: Middle East and Africa Market Value Share (%) and BPS Analysis by Ingredient, 2025-2035
  • Figure 230: Middle East and Africa Market Y-o-Y Growth (%) Projections by Ingredient, 2025-2035
  • Figure 231: Middle East and Africa Market Value (USD Million) Analysis by Function, 2020-2035
  • Figure 232: Middle East and Africa Market Volume (Units) Analysis by Function, 2020-2035
  • Figure 233: Middle East and Africa Market Value Share (%) and BPS Analysis by Function, 2025-2035
  • Figure 234: Middle East and Africa Market Y-o-Y Growth (%) Projections by Function, 2025-2035
  • Figure 235: Middle East and Africa Market Value (USD Million) Analysis by Product Type, 2020-2035
  • Figure 236: Middle East and Africa Market Volume (Units) Analysis by Product Type, 2020-2035
  • Figure 237: Middle East and Africa Market Value Share (%) and BPS Analysis by Product Type, 2025-2035
  • Figure 238: Middle East and Africa Market Y-o-Y Growth (%) Projections by Product Type, 2025-2035
  • Figure 239: Middle East and Africa Market Value (USD Million) Analysis by Channel, 2020-2035
  • Figure 240: Middle East and Africa Market Volume (Units) Analysis by Channel, 2020-2035
  • Figure 241: Middle East and Africa Market Value Share (%) and BPS Analysis by Channel, 2025-2035
  • Figure 242: Middle East and Africa Market Y-o-Y Growth (%) Projections by Channel, 2025-2035
  • Figure 243: Middle East and Africa Market Value (USD Million) Analysis by Tier, 2020-2035
  • Figure 244: Middle East and Africa Market Volume (Units) Analysis by Tier, 2020-2035
  • Figure 245: Middle East and Africa Market Value Share (%) and BPS Analysis by Tier, 2025-2035
  • Figure 246: Middle East and Africa Market Y-o-Y Growth (%) Projections by Tier, 2025-2035
  • Figure 247: Middle East and Africa Market Attractiveness by Ingredient, 2025-2035
  • Figure 248: Middle East and Africa Market Attractiveness by Function, 2025-2035
  • Figure 249: Middle East and Africa Market Attractiveness by Product Type, 2025-2035
  • Figure 250: Middle East and Africa Market Attractiveness by Channel, 2025-2035
  • Figure 251: Middle East and Africa Market Attractiveness by Tier, 2025-2035
  • Figure 252: Middle East and Africa Market Attractiveness by Country, 2025-2035

Frequently Asked Questions

How big is the Bioactive Retinol Alternatives Market in 2025?

The global Bioactive Retinol Alternatives Market is estimated to be valued at USD 1,623.2 million in 2025.

What will be the size of the Bioactive Retinol Alternatives Market in 2035?

The market size for the Bioactive Retinol Alternatives Market is projected to reach USD 5,406.3 million by 2035.

How much will the Bioactive Retinol Alternatives Market grow between 2025 and 2035?

The Bioactive Retinol Alternatives Market is expected to grow at a CAGR of 12.8% during the period from 2025 to 2035.

What are the key product types in the Bioactive Retinol Alternatives Market?

The key product types include serums, creams, oils, and capsules, with serums and creams leading due to their superior skin absorption and compatibility with anti-aging formulations.

Which function segment is expected to contribute a significant share in the Bioactive Retinol Alternatives Market in 2025?

The anti-aging segment is projected to account for the highest share in 2025, contributing 52.5% of the global value, driven by demand for safer, non-irritating alternatives to traditional retinoids.

Explore Similar Insights

Future Market Insights

Bioactive Retinol Alternatives Market

Chat With

MaRIA

Hi There, I am MaRIA, Your Market Research Intelligence Assistant. How may I help you?