Botanical Bioactives Market Size and Share Forecast Outlook 2025 to 2035

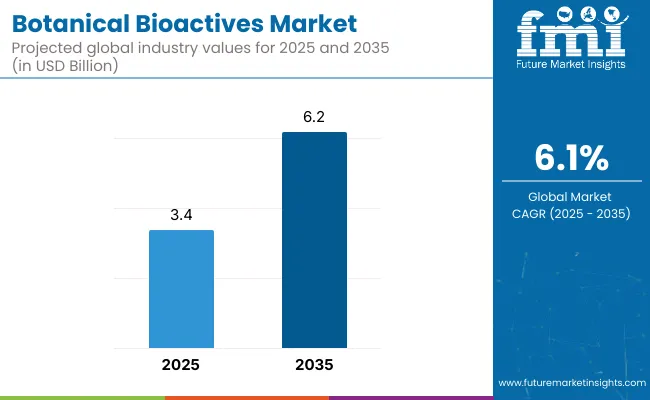
The global botanical bioactives market is projected to reach USD 3.4 billion in 2025 and USD 6.2 billion in 2035, marking an absolute growth of USD 2.78 billion over the decade. This expansion reflects a CAGR of 6.1% and represents a 1.81x increase in market value.
Quick Stats for Botanical Bioactives Market

  • Botanical Bioactives Market Value (2025): USD 3.4 billion
  • Botanical Bioactives Market Forecast Value (2035): USD 6.2 billion
  • Botanical Bioactives Market Forecast CAGR: 6.1%
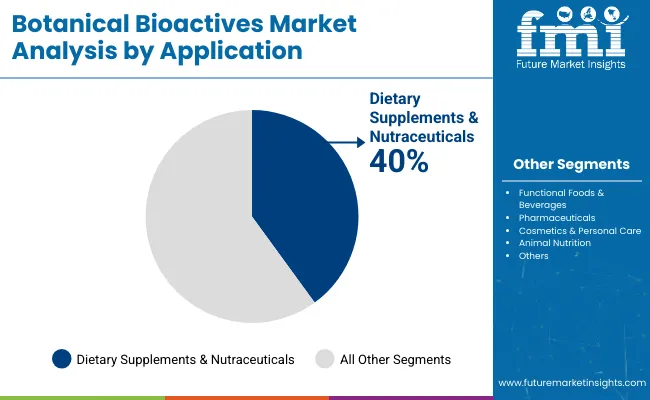
  • Leading Segment in Botanical Bioactives Market in 2025: Dietary Supplements & Nutraceuticals (40%)
  • Key Growth Regions in the Botanical Bioactives Market: North America, Asia-Pacific, Europe
  • Top Key Players in Botanical Bioactive Market: Indena S.p.A., Naturex (Givaudan), Sabinsa Corporation, Euromed S.A., Arjuna Natural Extracts Ltd., Martin Bauer Group, Plantextract, Frutarom (IFF), NutraScience Labs, Gaia Herbs

Botanical Bioactives Market

Botanical Bioactives Market Key Takeaways

Metric Value
Market Estimated Value in (2025E) USD 3.4 billion
Market Forecast Value in (2035F) USD 6.2 billion
Forecast CAGR (2025 to 2035) 6.1%

Between 2025 and 2030, market size is expected to rise from USD 3.4 billion to approximately USD 4.56 billion, contributing USD 1.12 billion, or around 40% of the total decade growth. This phase is anticipated to be driven by heightened consumer demand for natural health-enhancing products, increasing clinical validation of plant-derived compounds, and wider adoption in nutraceutical, functional food, and personal care segments.

In the latter half of the forecast period (2030-2035), the market is forecast to accelerate from USD 4.56 billion to USD 6.2 billion, contributing USD 1.66 billion, or 60% of the total growth. Growth momentum during this stage is expected to be supported by regulatory alignment in key markets, innovations in extraction and formulation technologies, and stronger supply-chain traceability programs that enhance product quality and consumer trust. Emerging economies in Asia-Pacific and Latin America are projected to account for a rising share of demand as local production capacity expands and consumer awareness increases.

Regional diversification, bioavailability-enhanced delivery systems, and integration of botanical bioactives into condition-specific health solutions are anticipated to reshape competitive strategies. Premium-positioned products with verified efficacy, clean-label credentials, and sustainability certifications are expected to capture a disproportionate share of incremental value. By 2035, the market landscape is projected to be characterized by consolidation among vertically integrated players, higher compliance standards, and an expanded role for science-backed marketing in driving consumer adoption.

From 2020 to 2024, the botanical bioactives market expanded steadily, driven by increasing demand for plant-derived compounds in nutraceutical, functional food, and personal care applications. During this period, the competitive landscape was dominated by vertically integrated botanical extract manufacturers, controlling most of the global supply through proprietary cultivation, extraction, and standardization processes. Leading players such as Indena S.p.A., Naturex, and Sabinsa Corporation strengthened positions by investing in traceability programs, clinical validation studies, and region-specific formulation partnerships.

In 2025, the market is expected to reach USD 3.4 billion, with the revenue mix increasingly influenced by high-purity standardized extracts and bioavailability-enhanced delivery formats. Over the forecast period, the share of premium, clinically supported products is projected to rise as regulatory scrutiny intensifies across key markets. This shift is anticipated to benefit companies with strong R&D pipelines, robust quality assurance systems, and multi-origin sourcing networks.

By 2035, demand is forecast to reach USD 6.2 billion, with Asia-Pacific and Europe accounting for a growing portion of incremental revenue. Competitive advantage is projected to depend less on raw extraction capacity and more on ecosystem capabilities integrating supply chain transparency, data-backed health claims, and scalable formulation technologies. Emerging entrants specializing in condition-specific bioactive blends, sustainable cultivation, and novel extraction techniques are expected to capture share from incumbents, reinforcing the market’s transition toward science-driven, premium-positioned botanical solutions.

Why is the Botanical Bioactive Market Growing?

Growth in the botanical bioactives market is being driven by increasing consumer preference for plant-derived health solutions supported by clinical validation and clean-label positioning. Rising demand in dietary supplements and nutraceuticals is being reinforced by expanding awareness of preventive healthcare and natural ingredient efficacy. Regulatory frameworks in key markets are being aligned to Favor standardized extracts with verifiable bioactive content, enabling higher trust and premium pricing.

Advances in extraction technologies, including green solvents and process intensification, are improving yield, purity, and cost efficiency, supporting scalability. Supply chain traceability, enabled through DNA barcoding and isotope analysis, is being adopted to assure authenticity and mitigate adulteration risks. Integration into functional foods, cosmetics, and pharmaceutical formulations is broadening the application base. Strategic investment in R&D for condition-specific formulations, combined with sustainability-focused sourcing, is expected to create long-term value and sustain above-average growth rates across both developed and emerging markets.

Segmental Analysis Introduction

The botanical bioactives market is segmented by source plant type, active compound type, application, and region. Source plant types include herbs, flowers, roots & rhizomes, leaves, fruits & berries, seeds & pods, and trees & bark each providing unique bioactive profiles for targeted applications. Active compound segmentation covers polyphenols & flavonoids, alkaloids, terpenoids & essential oils, saponins, tannins, glycosides, lignans, and anthocyanins, reflecting the diversity of functional benefits.

Applications span dietary supplements & nutraceuticals, functional foods & beverages, pharmaceuticals, cosmetics & personal care, and animal nutrition, driven by growing demand for natural health-enhancing solutions. Regionally, the market scope encompasses North America, Latin America, Europe, East Asia, South Asia & Pacific, and the Middle East & Africa, with Asia-Pacific emerging as a high-growth region due to expanding production capabilities and rising consumer awareness. This segmentation framework enables targeted growth strategies, aligns R&D priorities with market demand, and supports value chain optimization.

Insights into the Source Plant Type Segment with Herbs Leading Market Share

Source Plant Type Market Value Share, 2025
Botanical Bioactives Market By Source

Segment 2025 Share%
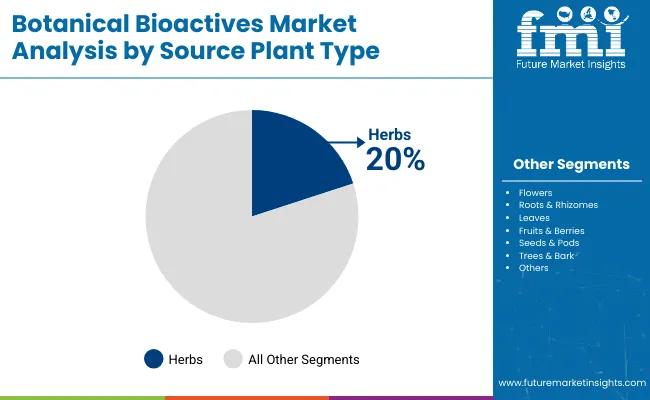
Herbs 20%
Flowers 10%
Roots & Rhizomes 18%
Leaves 15%
Fruits & Berries 15%
Seeds & Pods 8%
Trees & Bark 14%
Total 100%
Segment CAGR (2025 to 2035)
Herbs 8.90%
Flowers 8.70%
Roots & Rhizomes 9.10%
Leaves 9.20%
Fruits & Berries 9.30%
Seeds & Pods 8.80%
Trees & Bark 8.60%

The source plant type segment is expected to be dominated by herbs, driven by their widespread medicinal and nutritional applications. Growing consumer interest in natural wellness products is anticipated to strengthen demand for herbal bioactive. Roots, leaves, and fruits are projected to follow closely, supported by expanding use in dietary supplements, functional foods, and cosmetics.

The diversity of plant sources allows for targeted bioactive extraction, fostering innovation in product development. Rising cultivation of bioactive-rich botanicals and investments in advanced extraction technologies are expected to expand supply capabilities. With rising regulatory support for herbal ingredients and expanding functional benefits, the herbs segment is poised to sustain leadership throughout the forecast period.

Insights into the Active Compound Type Segment with Polyphenols Dominating

Active Compound Type Market Value Share, 2025
Botanical Bioactives Market By Active

Segment 2025 Share%
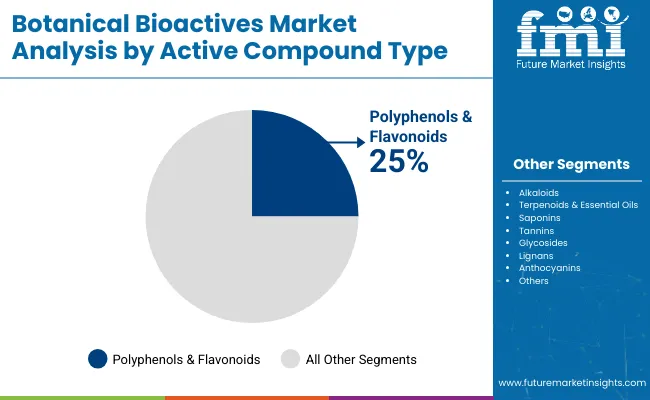
Polyphenols & Flavonoids 25%
Alkaloids 10%
Terpenoids & Essential Oils 12%
Saponins 12%
Tannins 10%
Glycosides 10%
Lignans 8%
Anthocyanins 13%
Total 100%
Segment CAGR (2025 to 2035)
Polyphenols & Flavonoids 9.20%
Alkaloids 8.80%
Terpenoids & Essential Oils 8.90%
Saponins 9.00%
Tannins 8.70%
Glycosides 8.90%
Lignans 8.60%
Anthocyanins 9.10%

The active compound type segment is anticipated to be led by polyphenols & flavonoids, given their strong antioxidant properties and extensive applications in nutraceutical, cosmetic, and pharmaceutical formulations. Increasing clinical research validating their health benefits is likely to accelerate market adoption. Other key compounds such as terpenoids, saponins, and anthocyanins are projected to witness robust growth, driven by their role in anti-inflammatory, antimicrobial, and cardiovascular health products.

Advancements in extraction purity and bioavailability enhancement technologies are expected to improve efficacy, driving demand further. Strategic partnerships between botanical suppliers and end-product manufacturers are anticipated to fuel targeted formulation development. Overall, polyphenols are positioned to remain a central driver of innovation in botanical bioactive markets.

Insights into the Application Segment with Dietary Supplements Leading

Application Market Value Share, 2025

Botanical Bioactives Market By Application

Segment 2025 Share%
Dietary Supplements & Nutraceuticals 40%
Functional Foods & Beverages 25%
Pharmaceuticals 15%
Cosmetics & Personal Care 12%
Animal Nutrition 8%
Total 100%
Segment CAGR (2025 to 2035)
Dietary Supplements & Nutraceuticals 9.10%
Functional Foods & Beverages 9.40%
Pharmaceuticals 8.90%
Cosmetics & Personal Care 9.00%
Animal Nutrition 8.70%

The application segment is forecasted to be dominated by dietary supplements & nutraceuticals, reflecting a global shift towards preventive healthcare and wellness-oriented consumption. Consumer preference for plant-based, clean-label products is anticipated to sustain high growth in this category. Functional foods and beverages are projected to expand rapidly, driven by demand for fortified products with added health benefits.

Pharmaceutical applications continue to grow steadily, supported by the integration of botanical bioactive in complementary medicine. The cosmetics segment is expected to leverage the rising trend of natural beauty formulations. As awareness of bioactive health benefits strengthens, cross-sector adoption is likely to accelerate, positioning dietary supplements as the most influential demand driver in the coming decade.

What are the Drivers, Restraints, and Key Trends of the Botanical Bioactive Market?

Evolving consumer preferences for natural health solutions, regulatory alignment favouring standardized extracts, and clinical validation are driving botanical bioactives adoption, even as supply chain constraints and raw material cost fluctuations present operational and strategic challenges for industry stakeholders.

Rising Demand for Clinically Validated Natural IngredientsMarket expansion is being propelled by increasing consumer trust in botanical bioactives supported by peer-reviewed clinical studies and regulatory-compliant health claims. Scientific validation is enabling premium pricing, stronger brand differentiation, and deeper penetration into regulated categories such as pharmaceuticals and fortified foods. Regulatory frameworks in key markets are aligning to reward manufacturers with standardized actives, traceable sourcing, and robust safety data.

Investments in bioavailability enhancement and targeted formulations are strengthening value propositions, making clinically validated botanical ingredients a critical growth lever. The driver is expected to remain influential as healthcare systems and consumers increasingly prioritize preventive and functional nutrition.

Supply Chain Volatility and Raw Material Risks Growth is being constrained by vulnerability to climatic fluctuations, geopolitical disruptions, and agricultural yield variability affecting botanical ingredient supply chains. Shortages or quality inconsistencies in high-demand plants, such as ginseng or turmeric, can disrupt production schedules, inflate procurement costs, and erode margins.

Compliance with increasingly stringent quality and sustainability requirements is adding complexity to sourcing strategies, especially for multi-origin supply networks. Without investment in controlled cultivation, vertical integration, and climate-resilient agriculture, dependency on volatile supply chains is projected to limit scalability and challenge market stability, particularly in regions heavily reliant on seasonal harvest cycles.
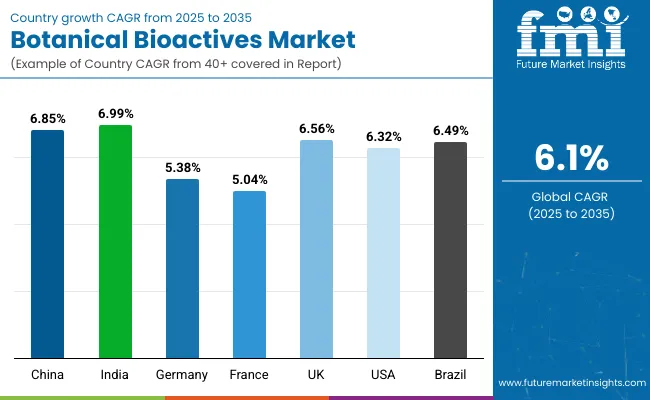
Analysis of Botanical Bioactive Market by Key Countries

Botanical Bioactives Market By Country

Countries CAGR (2025 to 2035)
China 6.85%
India 6.99%
Germany 5.38%
France 5.04%
UK 6.56%
USA 6.32%
Brazil 6.49%

The global botanical bioactives market demonstrates marked regional variation in growth patterns, shaped by dietary supplement penetration, functional food adoption, and evolving regulatory frameworks. Asia-Pacific is projected to be the fastest-growing region, led by China at a CAGR of 6.0% and India at 5.96%.

China’s expansion is expected to be supported by large-scale production ecosystems, extensive cultivation of medicinal plants, and government-backed initiatives promoting standardized herbal products for both domestic and export markets. India’s growth is anticipated to be reinforced by rising investment in nutraceutical manufacturing, increasing adoption of clinically validated botanicals, and diversification of agricultural outputs into high-value medicinal crops.

Europe is forecast to sustain a strong growth profile, with Germany, France, and the UK benefiting from stringent product safety regulations, clean-label consumer demand, and active R&D pipelines for condition-specific bioactive formulations. Regulatory alignment under EU directives is anticipated to Favor standardized, traceable, and sustainably sourced botanical ingredients, maintaining the region’s premium positioning.

North America is expected to record steady expansion, led by the USA, driven by the mainstreaming of plant-based supplements, expansion of functional food portfolios, and integration of botanical actives into sports nutrition and personal care categories. Growth in this region is projected to be service-oriented, with increasing emphasis on product innovation, compliance testing, and brand differentiation through clinical evidence.

Sales Outlook for Botanical Bioactives in the United States

Year USABotanical Bioactives Market (USD Billion)
2025 824.54
2026 880.5
2027 928.6
2028 993.1
2029 1,060.1
2030 1,127.5
2031 1,197.8
2032 1,258.9
2033 1,337.3
2034 1,417.2
2035 1,495.1
Year CAGR (2025 to 2035)
2025 5.86%
2026 6.79%
2027 5.46%
2028 6.95%
2029 6.74%
2030 6.36%
2031 6.23%
2032 5.11%
2033 6.2%
2034 5.98%
2035 5.50%

The USA botanical bioactives market is projected to grow at a CAGR of 6.1%, driven by expanding adoption in nutraceuticals, functional foods, and premium personal care formulations. Rising consumer demand for clinically validated plant-based health solutions is creating opportunities for innovation in bioavailability enhancement, condition-specific formulations, and clean-label product lines. Regulatory scrutiny and labelling compliance are expected to strengthen trust in domestically produced botanical actives, further supporting premium positioning.

Pharmaceutical applications are anticipated to gain traction as standardized extracts are increasingly integrated into complementary health therapies. Functional beverages and fortified snacks featuring botanical actives are expected to expand retail penetration, driven by wellness-focused consumer lifestyles. The personal care sector is forecast to integrate more antioxidant-rich and anti-inflammatory botanical ingredients into skincare and haircare ranges.

  • Nutraceutical brands are expanding product portfolios with clinically validated botanical actives.
  • Functional beverages with botanicals are gaining shelf space in mainstream retail.
  • Personal care formulators are integrating high-efficacy botanical antioxidants for skin health.

Growth and Expansion Outlook for Botanical Bioactives Market in the United Kingdom

The UK botanical bioactives market is projected to experience steady growth, supported by rising consumer demand for plant-based supplements and fortified food products. Regulatory alignment under UK food safety and supplement laws is expected to strengthen market confidence. The clean-label trend is anticipated to drive innovation, with manufacturers investing in organic certifications and sustainable sourcing. Premiumization is forecast to remain a key growth lever, with brands differentiating through clinically supported claims and targeted health benefits.

  • Clean-label product launches are increasing market penetration in retail channels.
  • Organic certifications are being prioritized to enhance brand credibility.
  • Functional beverages incorporating botanical extracts are expanding in popularity.
  • E-commerce platforms are strengthening access to niche botanical formulations.

In-depth Analysis of Botanical Bioactives in Europe

Countries / Subregion 2025
UK 20.95%
Germany 21.81%
Italy 9.91%
France 12.19%
Spain 10.63%
BENELUX 6.13%
Nordic 5.46%
Rest of Europe 13%
Total 100%
Country / Subregion 2035
UK 18.40%
Germany 20.26%
Italy 11.66%
France 13.04%
Spain 10.28%
BENELUX 5.45%
Nordic 5.07%
Rest of Europe 16%
Total 100%

Growth and Expansion Outlook for Botanical Bioactives Market in India

India’s botanical bioactives market is projected to expand at a healthy pace, driven by its strong medicinal plant heritage and growing nutraceutical sector. Ayurveda-based formulations are expected to gain wider acceptance in export markets due to improved standardization and regulatory compliance. Domestic demand is anticipated to rise as awareness of preventive health and immunity-boosting products increases. Investment in controlled cultivation and processing infrastructure is likely to enhance quality consistency.

  • Ayurveda-inspired formulations are gaining traction in global wellness markets.
  • Standardized cultivation practices are improving consistency in active compound content.
  • Nutraceutical consumption is increasing across urban and semi-urban regions.
  • Export potential is strengthening through compliance with global quality standards.

Sales Outlook for China Botanical Bioactives Market

China’s botanical bioactives market is forecast to remain one of the fastest-growing globally, driven by extensive cultivation capacity, government support for traditional medicine modernization, and strong domestic demand. Integration of botanical extracts into functional foods, beverages, and cosmetics is expected to accelerate. Investment in advanced extraction technologies is likely to improve yield and purity. Export competitiveness is anticipated to rise through stricter quality control and certification programs.

  • Government initiatives are modernizing traditional botanical medicine industries.
  • Functional food and beverage categories are expanding botanical incorporation.
  • Advanced extraction technologies are enhancing product quality and efficiency.
  • Export competitiveness is improving through internationally recognized certifications.

In-depth Analysis of Botanical Bioactive in Germany

Germany’s botanical bioactives market is expected to benefit from stringent quality regulations, a strong herbal medicine tradition, and a high level of consumer trust in plant-based health solutions. Pharmaceutical-grade botanical extracts are anticipated to see steady demand in both domestic and export markets. Growth in functional food and dietary supplement categories is projected to be driven by clinically validated claims and sustainable sourcing initiatives.

  • Pharmaceutical-grade botanical products are maintaining high demand in regulated markets.
  • Stringent EU-aligned regulations are supporting product quality and safety.
  • Sustainability certifications are influencing consumer purchasing preferences.
  • Functional food innovation is integrating more targeted botanical actives.

Growth Outlook for Botanical Bioactive Market in Japan

Japan Source Plant Type 2025 Share%
Herbs (e.g., Ginseng, Echinacea) 21%
Flowers (e.g., Chamomile, Hibiscus) 10%
Roots & Rhizomes (e.g., Turmeric, Ginger) 18%
Leaves (e.g., Green Tea, Moringa) 16%
Fruits & Berries (e.g., Goji, Acai) 15%
Seeds & Pods (e.g., Fenugreek, Cardamom) 7%
Trees & Bark (e.g., Willow Bark, Cinnamon) 13%
Total 100%
Japan Source Plant Type CAGR (2025 to 2035)
Herbs (e.g., Ginseng, Echinacea) 8.80%
Flowers (e.g., Chamomile, Hibiscus) 8.60%
Roots & Rhizomes (e.g., Turmeric, Ginger) 9.00%
Leaves (e.g., Green Tea, Moringa) 9.10%
Fruits & Berries (e.g., Goji, Acai) 9.20%
Seeds & Pods (e.g., Fenugreek, Cardamom) 8.70%
Trees & Bark (e.g., Willow Bark, Cinnamon) 8.50%

The botanical bioactives market in Japan is projected at USD 250 million in 2025. Herbs dominate with a 21% share, supported by established demand in traditional medicine and modern nutraceutical formulations. Roots & rhizomes hold 18%, driven by turmeric and ginger’s integration into functional beverages and supplements. Fruits & berries, growing at the highest CAGR of 9.20%, are benefiting from rising interest in antioxidant-rich and immunity-enhancing ingredients.

Government-backed Food for Specified Health Uses (FOSHU) approvals are accelerating adoption of clinically validated botanical extracts. Japanese manufacturers are focusing on traceable sourcing, bioavailability enhancement, and scientific validation to sustain consumer trust. Expansion into convenience-oriented formats and fortified daily-use products is expected to further strengthen market penetration.

  • Japan market led by herbs at 21%, followed by roots & rhizomes at 18%.
  • Fruits & berries category to grow fastest at 9.20% CAGR.
  • FOSHU-approved products driving credibility and premium positioning in domestic market.

Opportunity Analysis of South Korea Botanical Bioactive Market

S Korea Active Compound Type 2025 Share%
Polyphenols & Flavonoids 26%
Alkaloids 9%
Terpenoids & Essential Oils 13%
Saponins 12%
Tannins 10%
Glycosides 10%
Lignans 8%
Anthocyanins 12%
Total 100%
S Korea Active Compound Type CAGR (2025 to 2035)
Polyphenols & Flavonoids 9.10%
Alkaloids 8.70%
Terpenoids & Essential Oils 8.80%
Saponins 8.90%
Tannins 8.60%
Glycosides 8.80%
Lignans 8.50%
Anthocyanins 9.00%

The Botanical Bioactive Market in South Korea is projected to be valued at USD 400 million in 2025. Polyphenols & flavonoids hold the largest share at 26%, reflecting their well-documented antioxidant, anti-inflammatory, and cardiovascular benefits. These compounds are expected to remain integral to functional foods, beverages, and cosmeceuticals, as Korean manufacturers prioritize plant-based formulations with scientifically validated health claims. The expanding integration of botanical actives into K-Beauty skincare and functional nutrition formats is projected to reinforce their market dominance.

Strong growth is anticipated in anthocyanins (12% share, 9.0% CAGR) and saponins (12% share, 8.9% CAGR), driven by their dual applicability in health and cosmetic formulations. Functional claims targeting skin radiance, immune resilience, and metabolic health are expected to gain traction, as regulatory bodies increasingly demand standardized quality documentation and safety profiles. The convergence of nutraceutical and cosmeceutical sectors in South Korea is projected to accelerate demand for these compounds, particularly in premium product lines that combine efficacy with clean-label positioning.

Digital health platforms and personalized nutrition services are expected to further propel targeted botanical bioactive adoption, leveraging consumer health data to recommend ingredient-specific regimens. Supply-side advancements in extraction technologies, coupled with blockchain-enabled traceability, are anticipated to secure consistent quality and improve consumer trust. Over the forecast period, competitive positioning is likely to hinge on the ability to deliver bioactive with proven bioavailability, stability in diverse formulations, and sustainability credentials aligned with South Korea’s eco-conscious consumer base.
  • Polyphenols & flavonoids lead at 26%, followed by terpenoids & essential oils at 13% and anthocyanins/saponins at 12% each
  • Growth supported by personalized nutrition platforms, K-Beauty integration, and advanced extraction technologies

Competitive Landscape of Botanical Bioactive Market

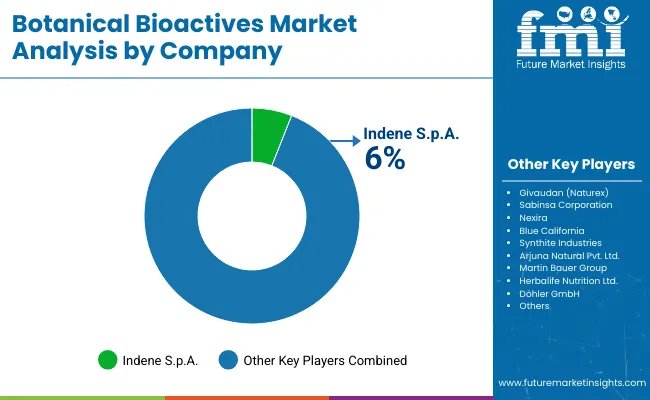
Botanical Bioactives Market By Company

The Botanical Bioactive Market is moderately fragmented, with multinational ingredient producers, mid-sized specialists, and regional extract innovators competing across functional food, nutraceutical, cosmetic, and pharmaceutical applications. Global leaders such asGivaudan (Naturex), Sabinsa Corporation, and Indena S.p.A. are recognized for high-quality, standardized botanical actives supported by robust clinical evidence and strong regulatory compliance. Their strategies are increasingly focused on sustainable sourcing, advanced extraction technologies, and bioavailability-enhancing delivery systems to meet evolving consumer and regulatory demands.

Established mid-sized players, including Nexira, Blue California, and Synthite Industries, are enhancing competitiveness through targeted innovation in antioxidant-rich, adaptogenic, and skin-health-focused compounds. These companies are expanding partnerships with brand owners to co-develop science-backed formulations tailored for emerging wellness categories.

Specialized regional suppliers focus on niche bioactive or traditional botanicals with heritage value, leveraging unique terroirs and cultivation expertise. Their differentiation is rooted in customization, transparent traceability, and strong alignment with clean-label and sustainability trends.

Competitive advantage in this market is expected to shift from price-led procurement toward innovation-led value, where integrated supply chains, clinical substantiation, and eco-responsible operations define leadership. Subscription-based R&D collaborations, personalized nutrition alignment, and biotech-enabled bioactive production are projected to further transform market positioning over the forecast period.

Key Developments in Botanical Bioactive Market

  • In March 2025, EverZen a novel botanical ingredient standardized on 6-methoxy-2-benzoxazolinone (6-MBOA), sourced from non-GMO corn leaves was introduced by Nutrition21 for mood and stress support, based on positive clinical findings for cortisol regulation and emotional balance.
  • In July 2025, HerbCare Joint Care was launched featuring clinically studied botanical mobility actives Mobilee®, Collavant®, and Apresflex® marking a rising trend toward evidence-based, plant-derived joint health supplements tailored for preventive wellness and active aging demands.

Scope of the Report

Item Value
Quantitative Units USD 3.4 billion (2025) - USD 6.2 billion (2035)
Component Polyphenols & Flavonoids, Alkaloids, Terpenoids & Essential Oils, Saponins, Tannins, Glycosides, Lignans, Anthocyanins
Range Low-potency extracts, Medium-standardized extracts, High-purity bioactive concentrates
Technology Solvent extraction, Supercritical CO₂ extraction, Enzymatic extraction, Ultrasonic-assisted extraction, Fermentation-derived actives
Type Standardized extracts, Powdered bioactive, Liquid concentrates, Encapsulated actives
End-use Industry Functional foods & beverages, Nutraceuticals, Cosmetics & personal care, Pharmaceuticals, Animal nutrition
Regions Covered North America, Europe, Asia-Pacific, Latin America, Middle East & Africa
Country Covered United States, Canada, Germany, France, United Kingdom, China, Japan, India, Brazil, South Korea
Key Companies Profiled Givaudan (Naturex), Sabinsa Corporation, Indena S.p.A., Nexira, Blue California, Synthite Industries, Arjuna Natural Pvt. Ltd., Martin Bauer Group, Herbalife Nutrition Ltd., Döhler GmbH
Additional Attributes Dollar sales by active compound type and end-use sector, adoption trends in preventive health and clean-label cosmetics, rising demand for antioxidant and anti-inflammatory actives, sector-specific growth in nutraceuticals and functional beverages, bioavailability and delivery-system innovation, regulatory harmonization trends, sustainability-linked sourcing models, integration with personalized nutrition and AI-based formulation design

Key Segments

By Source Plant Type:

  • Herbs
  • Flowers
  • Roots & Rhizomes
  • Leaves
  • Fruits & Berries
  • Seeds & Pods
  • Trees & Bark

By Active Compound Type:

  • Polyphenols & Flavonoids
  • Alkaloids
  • Terpenoids & Essential Oils
  • Saponins
  • Tannins
  • Glycosides
  • Lignans
  • Anthocyanins

By Application:

  • Dietary Supplements & Nutraceuticals
  • Functional Foods & Beverages
  • Pharmaceuticals
  • Cosmetics & Personal Care
  • Animal Nutrition

By Product Form:

  • Extracts & Concentrates
  • Powders
  • Capsules & Tablets
  • Oils & Tinctures
  • Topical Formulations

By Sales Channel:

  • Pharmacies & Drugstores
  • Health & Nutrition Stores
  • Online Retail
  • Food & Beverage Manufacturers (B2B)
  • Cosmetics Manufacturers (B2B)

By End User:

  • General Consumers
  • Patients & Clinical Users
  • Beauty & Personal Care Consumers
  • Animal Nutrition Industry

By Region:

  • North America
  • Latin America
  • Europe
  • East Asia
  • South Asia & Pacific
  • Middle East and Africa

Table of Content

  1. Executive Summary
    • Global Market Outlook
    • Demand-side Trends
    • Supply-side Trends
    • Technology Roadmap Analysis
    • Analysis and Recommendations
  2. Market Overview
    • Market Coverage / Taxonomy
    • Market Definition / Scope / Limitations
  3. Market Background
    • Market Dynamics
      • Drivers
      • Restraints
      • Opportunity
      • Trends
    • Scenario Forecast
      • Demand in Optimistic Scenario
      • Demand in Likely Scenario
      • Demand in Conservative Scenario
    • Opportunity Map Analysis
    • Product Life Cycle Analysis
    • Supply Chain Analysis
      • Supply Side Participants and their Roles
        • Producers
        • Mid-Level Participants (Traders/ Agents/ Brokers)
        • Wholesalers and Distributors
      • Value Added and Value Created at Node in the Supply Chain
      • List of Raw Material Suppliers
      • List of Existing and Potential Buyer’s
    • Investment Feasibility Matrix
    • Value Chain Analysis
      • Profit Margin Analysis
      • Wholesalers and Distributors
      • Retailers
    • PESTLE and Porter’s Analysis
    • Regulatory Landscape
      • By Key Regions
      • By Key Countries
    • Regional Parent Market Outlook
    • Production and Consumption Statistics
    • Import and Export Statistics
  4. Global Market Analysis 2020 to 2024 and Forecast, 2025 to 2035
    • Historical Market Size Value (USD Million) & Volume (Units) Analysis, 2020 to 2024
    • Current and Future Market Size Value (USD Million) & Volume (Units) Projections, 2025 to 2035
      • Y-o-Y Growth Trend Analysis
      • Absolute $ Opportunity Analysis
  5. Global Market Analysis 2020 to 2024 and Forecast 2025 to 2035, By Source Plant Type
    • Introduction / Key Findings
    • Historical Market Size Value (USD Million) & Volume (Units) Analysis By Source Plant Type, 2020 to 2024
    • Current and Future Market Size Value (USD Million) & Volume (Units) Analysis and Forecast By Source Plant Type, 2025 to 2035
      • Herbs
      • Flowers
      • Roots & Rhizomes
      • Leaves
      • Fruits & Berries
      • Seeds & Pods
      • Trees & Bark
    • Y-o-Y Growth Trend Analysis By Source Plant Type, 2020 to 2024
    • Absolute $ Opportunity Analysis By Source Plant Type, 2025 to 2035
  6. Global Market Analysis 2020 to 2024 and Forecast 2025 to 2035, By Active Compound Type
    • Introduction / Key Findings
    • Historical Market Size Value (USD Million) & Volume (Units) Analysis By Active Compound Type, 2020 to 2024
    • Current and Future Market Size Value (USD Million) & Volume (Units) Analysis and Forecast By Active Compound Type, 2025 to 2035
      • Polyphenols & Flavonoids
      • Alkaloids
      • Terpenoids & Essential Oils
      • Saponins
      • Tannins
      • Glycosides
      • Lignans
      • Anthocyanins
    • Y-o-Y Growth Trend Analysis By Active Compound Type, 2020 to 2024
    • Absolute $ Opportunity Analysis By Active Compound Type, 2025 to 2035
  7. Global Market Analysis 2020 to 2024 and Forecast 2025 to 2035, By Application
    • Introduction / Key Findings
    • Historical Market Size Value (USD Million) & Volume (Units) Analysis By Application, 2020 to 2024
    • Current and Future Market Size Value (USD Million) & Volume (Units) Analysis and Forecast By Application, 2025 to 2035
      • Dietary Supplements & Nutraceuticals
      • Functional Foods & Beverages
      • Pharmaceuticals
      • Cosmetics & Personal Care
      • Animal Nutrition
    • Y-o-Y Growth Trend Analysis By Application, 2020 to 2024
    • Absolute $ Opportunity Analysis By Application, 2025 to 2035
  8. Global Market Analysis 2020 to 2024 and Forecast 2025 to 2035, By Product Form
    • Introduction / Key Findings
    • Historical Market Size Value (USD Million) & Volume (Units) Analysis By Product Form, 2020 to 2024
    • Current and Future Market Size Value (USD Million) & Volume (Units) Analysis and Forecast By Product Form, 2025 to 2035
      • Extracts & Concentrates
      • Powders
      • Capsules & Tablets
      • Oils & Tinctures
      • Topical Formulations
    • Y-o-Y Growth Trend Analysis By Product Form, 2020 to 2024
    • Absolute $ Opportunity Analysis By Product Form, 2025 to 2035
  9. Global Market Analysis 2020 to 2024 and Forecast 2025 to 2035, By Sales Channel
    • Introduction / Key Findings
    • Historical Market Size Value (USD Million) & Volume (Units) Analysis By Sales Channel, 2020 to 2024
    • Current and Future Market Size Value (USD Million) & Volume (Units) Analysis and Forecast By Sales Channel, 2025 to 2035
      • Pharmacies & Drugstores
      • Health & Nutrition Stores
      • Online Retail
      • Food & Beverage Manufacturers (B2B)
      • Cosmetics Manufacturers (B2B)
    • Y-o-Y Growth Trend Analysis By Sales Channel, 2020 to 2024
    • Absolute $ Opportunity Analysis By Sales Channel, 2025 to 2035
  10. Global Market Analysis 2020 to 2024 and Forecast 2025 to 2035, By End User
    • Introduction / Key Findings
    • Historical Market Size Value (USD Million) & Volume (Units) Analysis By End User, 2020 to 2024
    • Current and Future Market Size Value (USD Million) & Volume (Units) Analysis and Forecast By End User, 2025 to 2035
      • General Consumers
      • Patients & Clinical Users
      • Beauty & Personal Care Consumers
      • Animal Nutrition Industry
    • Y-o-Y Growth Trend Analysis By End User, 2020 to 2024
    • Absolute $ Opportunity Analysis By End User, 2025 to 2035
  11. Global Market Analysis 2020 to 2024 and Forecast 2025 to 2035, By Region
    • Introduction
    • Historical Market Size Value (USD Million) & Volume (Units) Analysis By Region, 2020 to 2024
    • Current Market Size Value (USD Million) & Volume (Units) Analysis and Forecast By Region, 2025 to 2035
      • North America
      • Latin America
      • Europe
      • East Asia
      • South Asia & Pacific
      • Middle East and Africa
    • Market Attractiveness Analysis By Region
  12. North America Market Analysis 2020 to 2024 and Forecast 2025 to 2035, By Country
    • Historical Market Size Value (USD Million) & Volume (Units) Trend Analysis By Market Taxonomy, 2020 to 2024
    • Market Size Value (USD Million) & Volume (Units) Forecast By Market Taxonomy, 2025 to 2035
      • By Country
        • USA
        • Canada
      • By Source Plant Type
      • By Active Compound Type
      • By Application
      • By Product Form
      • By Sales Channel
      • By End User
    • Market Attractiveness Analysis
      • By Country
      • By Source Plant Type
      • By Active Compound Type
      • By Application
      • By Product Form
      • By Sales Channel
      • By End User
    • Key Takeaways
  13. Latin America Market Analysis 2020 to 2024 and Forecast 2025 to 2035, By Country
    • Historical Market Size Value (USD Million) & Volume (Units) Trend Analysis By Market Taxonomy, 2020 to 2024
    • Market Size Value (USD Million) & Volume (Units) Forecast By Market Taxonomy, 2025 to 2035
      • By Country
        • Brazil
        • Mexico
        • Colombia
        • Rest of Latin America
      • By Source Plant Type
      • By Active Compound Type
      • By Application
      • By Product Form
      • By Sales Channel
      • By End User
    • Market Attractiveness Analysis
      • By Country
      • By Source Plant Type
      • By Active Compound Type
      • By Application
      • By Product Form
      • By Sales Channel
      • By End User
    • Key Takeaways
  14. Europe Market Analysis 2020 to 2024 and Forecast 2025 to 2035, By Country
    • Historical Market Size Value (USD Million) & Volume (Units) Trend Analysis By Market Taxonomy, 2020 to 2024
    • Market Size Value (USD Million) & Volume (Units) Forecast By Market Taxonomy, 2025 to 2035
      • By Country
        • Germany
        • UK
        • France
        • Italy
        • Spain
        • Belgium
        • Netherlands
        • Nordic
        • Switzerland
        • Russia
        • Poland
        • Rest of Europe
      • By Source Plant Type
      • By Active Compound Type
      • By Application
      • By Product Form
      • By Sales Channel
      • By End User
    • Market Attractiveness Analysis
      • By Country
      • By Source Plant Type
      • By Active Compound Type
      • By Application
      • By Product Form
      • By Sales Channel
      • By End User
    • Key Takeaways
  15. East Asia Market Analysis 2020 to 2024 and Forecast 2025 to 2035, By Country
    • Historical Market Size Value (USD Million) & Volume (Units) Trend Analysis By Market Taxonomy, 2020 to 2024
    • Market Size Value (USD Million) & Volume (Units) Forecast By Market Taxonomy, 2025 to 2035
      • By Country
        • China
        • Japan
        • South Korea
      • By Source Plant Type
      • By Active Compound Type
      • By Application
      • By Product Form
      • By Sales Channel
      • By End User
    • Market Attractiveness Analysis
      • By Country
      • By Source Plant Type
      • By Active Compound Type
      • By Application
      • By Product Form
      • By Sales Channel
      • By End User
    • Key Takeaways
  16. South Asia & Pacific Market Analysis 2020 to 2024 and Forecast 2025 to 2035, By Country
    • Historical Market Size Value (USD Million) & Volume (Units) Trend Analysis By Market Taxonomy, 2020 to 2024
    • Market Size Value (USD Million) & Volume (Units) Forecast By Market Taxonomy, 2025 to 2035
      • By Country
        • India
        • Thailand
        • Malaysia
        • Indonesia
        • Singapore
        • Vietnam
        • Australia
        • New Zealand
        • Rest of South Asia
      • By Source Plant Type
      • By Active Compound Type
      • By Application
      • By Product Form
      • By Sales Channel
      • By End User
    • Market Attractiveness Analysis
      • By Country
      • By Source Plant Type
      • By Active Compound Type
      • By Application
      • By Product Form
      • By Sales Channel
      • By End User
    • Key Takeaways
  17. Middle East and Africa Market Analysis 2020 to 2024 and Forecast 2025 to 2035, By Country
    • Historical Market Size Value (USD Million) & Volume (Units) Trend Analysis By Market Taxonomy, 2020 to 2024
    • Market Size Value (USD Million) & Volume (Units) Forecast By Market Taxonomy, 2025 to 2035
      • By Country
        • Turkey
        • UAE
        • Saudi Arabia
        • Israel
        • Other GCC Countries
        • North Africa
        • South Africa
      • By Source Plant Type
      • By Active Compound Type
      • By Application
      • By Product Form
      • By Sales Channel
      • By End User
    • Market Attractiveness Analysis
      • By Country
      • By Source Plant Type
      • By Active Compound Type
      • By Application
      • By Product Form
      • By Sales Channel
      • By End User
    • Key Takeaways
  18. Key Countries Market Analysis
    • USA
      • Pricing Analysis
      • Market Share Analysis, 2024
        • By Source Plant Type
        • By Active Compound Type
        • By Application
        • By Product Form
        • By Sales Channel
        • By End User
    • Canada
      • Pricing Analysis
      • Market Share Analysis, 2024
        • By Source Plant Type
        • By Active Compound Type
        • By Application
        • By Product Form
        • By Sales Channel
        • By End User
    • Brazil
      • Pricing Analysis
      • Market Share Analysis, 2024
        • By Source Plant Type
        • By Active Compound Type
        • By Application
        • By Product Form
        • By Sales Channel
        • By End User
    • Mexico
      • Pricing Analysis
      • Market Share Analysis, 2024
        • By Source Plant Type
        • By Active Compound Type
        • By Application
        • By Product Form
        • By Sales Channel
        • By End User
    • Colombia
      • Pricing Analysis
      • Market Share Analysis, 2024
        • By Source Plant Type
        • By Active Compound Type
        • By Application
        • By Product Form
        • By Sales Channel
        • By End User
    • Rest of Latin America
      • Pricing Analysis
      • Market Share Analysis, 2024
        • By Source Plant Type
        • By Active Compound Type
        • By Application
        • By Product Form
        • By Sales Channel
        • By End User
    • Germany
      • Pricing Analysis
      • Market Share Analysis, 2024
        • By Source Plant Type
        • By Active Compound Type
        • By Application
        • By Product Form
        • By Sales Channel
        • By End User
    • UK
      • Pricing Analysis
      • Market Share Analysis, 2024
        • By Source Plant Type
        • By Active Compound Type
        • By Application
        • By Product Form
        • By Sales Channel
        • By End User
    • France
      • Pricing Analysis
      • Market Share Analysis, 2024
        • By Source Plant Type
        • By Active Compound Type
        • By Application
        • By Product Form
        • By Sales Channel
        • By End User
    • Italy
      • Pricing Analysis
      • Market Share Analysis, 2024
        • By Source Plant Type
        • By Active Compound Type
        • By Application
        • By Product Form
        • By Sales Channel
        • By End User
    • Spain
      • Pricing Analysis
      • Market Share Analysis, 2024
        • By Source Plant Type
        • By Active Compound Type
        • By Application
        • By Product Form
        • By Sales Channel
        • By End User
    • Belgium
      • Pricing Analysis
      • Market Share Analysis, 2024
        • By Source Plant Type
        • By Active Compound Type
        • By Application
        • By Product Form
        • By Sales Channel
        • By End User
    • Netherlands
      • Pricing Analysis
      • Market Share Analysis, 2024
        • By Source Plant Type
        • By Active Compound Type
        • By Application
        • By Product Form
        • By Sales Channel
        • By End User
    • Nordic
      • Pricing Analysis
      • Market Share Analysis, 2024
        • By Source Plant Type
        • By Active Compound Type
        • By Application
        • By Product Form
        • By Sales Channel
        • By End User
    • Switzerland
      • Pricing Analysis
      • Market Share Analysis, 2024
        • By Source Plant Type
        • By Active Compound Type
        • By Application
        • By Product Form
        • By Sales Channel
        • By End User
    • Russia
      • Pricing Analysis
      • Market Share Analysis, 2024
        • By Source Plant Type
        • By Active Compound Type
        • By Application
        • By Product Form
        • By Sales Channel
        • By End User
    • Poland
      • Pricing Analysis
      • Market Share Analysis, 2024
        • By Source Plant Type
        • By Active Compound Type
        • By Application
        • By Product Form
        • By Sales Channel
        • By End User
    • Rest of Europe
      • Pricing Analysis
      • Market Share Analysis, 2024
        • By Source Plant Type
        • By Active Compound Type
        • By Application
        • By Product Form
        • By Sales Channel
        • By End User
    • China
      • Pricing Analysis
      • Market Share Analysis, 2024
        • By Source Plant Type
        • By Active Compound Type
        • By Application
        • By Product Form
        • By Sales Channel
        • By End User
    • Japan
      • Pricing Analysis
      • Market Share Analysis, 2024
        • By Source Plant Type
        • By Active Compound Type
        • By Application
        • By Product Form
        • By Sales Channel
        • By End User
    • South Korea
      • Pricing Analysis
      • Market Share Analysis, 2024
        • By Source Plant Type
        • By Active Compound Type
        • By Application
        • By Product Form
        • By Sales Channel
        • By End User
    • India
      • Pricing Analysis
      • Market Share Analysis, 2024
        • By Source Plant Type
        • By Active Compound Type
        • By Application
        • By Product Form
        • By Sales Channel
        • By End User
    • Thailand
      • Pricing Analysis
      • Market Share Analysis, 2024
        • By Source Plant Type
        • By Active Compound Type
        • By Application
        • By Product Form
        • By Sales Channel
        • By End User
    • Malaysia
      • Pricing Analysis
      • Market Share Analysis, 2024
        • By Source Plant Type
        • By Active Compound Type
        • By Application
        • By Product Form
        • By Sales Channel
        • By End User
    • Indonesia
      • Pricing Analysis
      • Market Share Analysis, 2024
        • By Source Plant Type
        • By Active Compound Type
        • By Application
        • By Product Form
        • By Sales Channel
        • By End User
    • Singapore
      • Pricing Analysis
      • Market Share Analysis, 2024
        • By Source Plant Type
        • By Active Compound Type
        • By Application
        • By Product Form
        • By Sales Channel
        • By End User
    • Vietnam
      • Pricing Analysis
      • Market Share Analysis, 2024
        • By Source Plant Type
        • By Active Compound Type
        • By Application
        • By Product Form
        • By Sales Channel
        • By End User
    • Australia
      • Pricing Analysis
      • Market Share Analysis, 2024
        • By Source Plant Type
        • By Active Compound Type
        • By Application
        • By Product Form
        • By Sales Channel
        • By End User
    • New Zealand
      • Pricing Analysis
      • Market Share Analysis, 2024
        • By Source Plant Type
        • By Active Compound Type
        • By Application
        • By Product Form
        • By Sales Channel
        • By End User
    • Rest of South Asia
      • Pricing Analysis
      • Market Share Analysis, 2024
        • By Source Plant Type
        • By Active Compound Type
        • By Application
        • By Product Form
        • By Sales Channel
        • By End User
  19. Market Structure Analysis
    • Competition Dashboard
    • Competition Benchmarking
    • Market Share Analysis of Top Players
      • By Regional
      • By Source Plant Type
      • By Active Compound Type
      • By Application
      • By Product Form
      • By Sales Channel
      • By End User
  20. Competition Analysis
    • Competition Deep Dive
      • Indena S.p.A.
        • Overview
        • Product Portfolio
        • Profitability by Market Segments (Product/Age /Sales Channel/Region)
        • Sales Footprint
        • Strategy Overview
          • Marketing Strategy
          • Product Strategy
          • Channel Strategy
      • Naturex (Givaudan)
        • Overview
        • Product Portfolio
        • Profitability by Market Segments (Product/Age /Sales Channel/Region)
        • Sales Footprint
        • Strategy Overview
          • Marketing Strategy
          • Product Strategy
          • Channel Strategy
      • Sabinsa Corporation
        • Overview
        • Product Portfolio
        • Profitability by Market Segments (Product/Age /Sales Channel/Region)
        • Sales Footprint
        • Strategy Overview
          • Marketing Strategy
          • Product Strategy
          • Channel Strategy
      • Euromed S.A.
        • Overview
        • Product Portfolio
        • Profitability by Market Segments (Product/Age /Sales Channel/Region)
        • Sales Footprint
        • Strategy Overview
          • Marketing Strategy
          • Product Strategy
          • Channel Strategy
      • Arjuna Natural Extracts Ltd.
        • Overview
        • Product Portfolio
        • Profitability by Market Segments (Product/Age /Sales Channel/Region)
        • Sales Footprint
        • Strategy Overview
          • Marketing Strategy
          • Product Strategy
          • Channel Strategy
      • Martin Bauer Group
        • Overview
        • Product Portfolio
        • Profitability by Market Segments (Product/Age /Sales Channel/Region)
        • Sales Footprint
        • Strategy Overview
          • Marketing Strategy
          • Product Strategy
          • Channel Strategy
      • Plantextract
        • Overview
        • Product Portfolio
        • Profitability by Market Segments (Product/Age /Sales Channel/Region)
        • Sales Footprint
        • Strategy Overview
          • Marketing Strategy
          • Product Strategy
          • Channel Strategy
      • Frutarom (IFF)
        • Overview
        • Product Portfolio
        • Profitability by Market Segments (Product/Age /Sales Channel/Region)
        • Sales Footprint
        • Strategy Overview
          • Marketing Strategy
          • Product Strategy
          • Channel Strategy
      • NutraScience Labs
        • Overview
        • Product Portfolio
        • Profitability by Market Segments (Product/Age /Sales Channel/Region)
        • Sales Footprint
        • Strategy Overview
          • Marketing Strategy
          • Product Strategy
          • Channel Strategy
      • Gaia Herbs
        • Overview
        • Product Portfolio
        • Profitability by Market Segments (Product/Age /Sales Channel/Region)
        • Sales Footprint
        • Strategy Overview
          • Marketing Strategy
          • Product Strategy
          • Channel Strategy
  21. Assumptions & Acronyms Used
  22. Research Methodology

List of Tables

  • Table 1: Global Market Value (USD Million) Forecast by Region, 2020-2035
  • Table 2: Global Market Volume (Units) Forecast by Region, 2020-2035
  • Table 3: Global Market Value (USD Million) Forecast by Source Plant Type, 2020-2035
  • Table 4: Global Market Volume (Units) Forecast by Source Plant Type, 2020-2035
  • Table 5: Global Market Value (USD Million) Forecast by Active Compound Type, 2020-2035
  • Table 6: Global Market Volume (Units) Forecast by Active Compound Type, 2020-2035
  • Table 7: Global Market Value (USD Million) Forecast by Application, 2020-2035
  • Table 8: Global Market Volume (Units) Forecast by Application, 2020-2035
  • Table 9: Global Market Value (USD Million) Forecast by Product Form, 2020-2035
  • Table 10: Global Market Volume (Units) Forecast by Product Form, 2020-2035
  • Table 11: Global Market Value (USD Million) Forecast by Sales Channel, 2020-2035
  • Table 12: Global Market Volume (Units) Forecast by Sales Channel, 2020-2035
  • Table 13: Global Market Value (USD Million) Forecast by End User, 2020-2035
  • Table 14: Global Market Volume (Units) Forecast by End User, 2020-2035
  • Table 15: North America Market Value (USD Million) Forecast by Country, 2020-2035
  • Table 16: North America Market Volume (Units) Forecast by Country, 2020-2035
  • Table 17: North America Market Value (USD Million) Forecast by Source Plant Type, 2020-2035
  • Table 18: North America Market Volume (Units) Forecast by Source Plant Type, 2020-2035
  • Table 19: North America Market Value (USD Million) Forecast by Active Compound Type, 2020-2035
  • Table 20: North America Market Volume (Units) Forecast by Active Compound Type, 2020-2035
  • Table 21: North America Market Value (USD Million) Forecast by Application, 2020-2035
  • Table 22: North America Market Volume (Units) Forecast by Application, 2020-2035
  • Table 23: North America Market Value (USD Million) Forecast by Product Form, 2020-2035
  • Table 24: North America Market Volume (Units) Forecast by Product Form, 2020-2035
  • Table 25: North America Market Value (USD Million) Forecast by Sales Channel, 2020-2035
  • Table 26: North America Market Volume (Units) Forecast by Sales Channel, 2020-2035
  • Table 27: North America Market Value (USD Million) Forecast by End User, 2020-2035
  • Table 28: North America Market Volume (Units) Forecast by End User, 2020-2035
  • Table 29: Latin America Market Value (USD Million) Forecast by Country, 2020-2035
  • Table 30: Latin America Market Volume (Units) Forecast by Country, 2020-2035
  • Table 31: Latin America Market Value (USD Million) Forecast by Source Plant Type, 2020-2035
  • Table 32: Latin America Market Volume (Units) Forecast by Source Plant Type, 2020-2035
  • Table 33: Latin America Market Value (USD Million) Forecast by Active Compound Type, 2020-2035
  • Table 34: Latin America Market Volume (Units) Forecast by Active Compound Type, 2020-2035
  • Table 35: Latin America Market Value (USD Million) Forecast by Application, 2020-2035
  • Table 36: Latin America Market Volume (Units) Forecast by Application, 2020-2035
  • Table 37: Latin America Market Value (USD Million) Forecast by Product Form, 2020-2035
  • Table 38: Latin America Market Volume (Units) Forecast by Product Form, 2020-2035
  • Table 39: Latin America Market Value (USD Million) Forecast by Sales Channel, 2020-2035
  • Table 40: Latin America Market Volume (Units) Forecast by Sales Channel, 2020-2035
  • Table 41: Latin America Market Value (USD Million) Forecast by End User, 2020-2035
  • Table 42: Latin America Market Volume (Units) Forecast by End User, 2020-2035
  • Table 43: Europe Market Value (USD Million) Forecast by Country, 2020-2035
  • Table 44: Europe Market Volume (Units) Forecast by Country, 2020-2035
  • Table 45: Europe Market Value (USD Million) Forecast by Source Plant Type, 2020-2035
  • Table 46: Europe Market Volume (Units) Forecast by Source Plant Type, 2020-2035
  • Table 47: Europe Market Value (USD Million) Forecast by Active Compound Type, 2020-2035
  • Table 48: Europe Market Volume (Units) Forecast by Active Compound Type, 2020-2035
  • Table 49: Europe Market Value (USD Million) Forecast by Application, 2020-2035
  • Table 50: Europe Market Volume (Units) Forecast by Application, 2020-2035
  • Table 51: Europe Market Value (USD Million) Forecast by Product Form, 2020-2035
  • Table 52: Europe Market Volume (Units) Forecast by Product Form, 2020-2035
  • Table 53: Europe Market Value (USD Million) Forecast by Sales Channel, 2020-2035
  • Table 54: Europe Market Volume (Units) Forecast by Sales Channel, 2020-2035
  • Table 55: Europe Market Value (USD Million) Forecast by End User, 2020-2035
  • Table 56: Europe Market Volume (Units) Forecast by End User, 2020-2035
  • Table 57: East Asia Market Value (USD Million) Forecast by Country, 2020-2035
  • Table 58: East Asia Market Volume (Units) Forecast by Country, 2020-2035
  • Table 59: East Asia Market Value (USD Million) Forecast by Source Plant Type, 2020-2035
  • Table 60: East Asia Market Volume (Units) Forecast by Source Plant Type, 2020-2035
  • Table 61: East Asia Market Value (USD Million) Forecast by Active Compound Type, 2020-2035
  • Table 62: East Asia Market Volume (Units) Forecast by Active Compound Type, 2020-2035
  • Table 63: East Asia Market Value (USD Million) Forecast by Application, 2020-2035
  • Table 64: East Asia Market Volume (Units) Forecast by Application, 2020-2035
  • Table 65: East Asia Market Value (USD Million) Forecast by Product Form, 2020-2035
  • Table 66: East Asia Market Volume (Units) Forecast by Product Form, 2020-2035
  • Table 67: East Asia Market Value (USD Million) Forecast by Sales Channel, 2020-2035
  • Table 68: East Asia Market Volume (Units) Forecast by Sales Channel, 2020-2035
  • Table 69: East Asia Market Value (USD Million) Forecast by End User, 2020-2035
  • Table 70: East Asia Market Volume (Units) Forecast by End User, 2020-2035
  • Table 71: South Asia & Pacific Market Value (USD Million) Forecast by Country, 2020-2035
  • Table 72: South Asia & Pacific Market Volume (Units) Forecast by Country, 2020-2035
  • Table 73: South Asia & Pacific Market Value (USD Million) Forecast by Source Plant Type, 2020-2035
  • Table 74: South Asia & Pacific Market Volume (Units) Forecast by Source Plant Type, 2020-2035
  • Table 75: South Asia & Pacific Market Value (USD Million) Forecast by Active Compound Type, 2020-2035
  • Table 76: South Asia & Pacific Market Volume (Units) Forecast by Active Compound Type, 2020-2035
  • Table 77: South Asia & Pacific Market Value (USD Million) Forecast by Application, 2020-2035
  • Table 78: South Asia & Pacific Market Volume (Units) Forecast by Application, 2020-2035
  • Table 79: South Asia & Pacific Market Value (USD Million) Forecast by Product Form, 2020-2035
  • Table 80: South Asia & Pacific Market Volume (Units) Forecast by Product Form, 2020-2035
  • Table 81: South Asia & Pacific Market Value (USD Million) Forecast by Sales Channel, 2020-2035
  • Table 82: South Asia & Pacific Market Volume (Units) Forecast by Sales Channel, 2020-2035
  • Table 83: South Asia & Pacific Market Value (USD Million) Forecast by End User, 2020-2035
  • Table 84: South Asia & Pacific Market Volume (Units) Forecast by End User, 2020-2035
  • Table 85: Middle East and Africa Market Value (USD Million) Forecast by Country, 2020-2035
  • Table 86: Middle East and Africa Market Volume (Units) Forecast by Country, 2020-2035
  • Table 87: Middle East and Africa Market Value (USD Million) Forecast by Source Plant Type, 2020-2035
  • Table 88: Middle East and Africa Market Volume (Units) Forecast by Source Plant Type, 2020-2035
  • Table 89: Middle East and Africa Market Value (USD Million) Forecast by Active Compound Type, 2020-2035
  • Table 90: Middle East and Africa Market Volume (Units) Forecast by Active Compound Type, 2020-2035
  • Table 91: Middle East and Africa Market Value (USD Million) Forecast by Application, 2020-2035
  • Table 92: Middle East and Africa Market Volume (Units) Forecast by Application, 2020-2035
  • Table 93: Middle East and Africa Market Value (USD Million) Forecast by Product Form, 2020-2035
  • Table 94: Middle East and Africa Market Volume (Units) Forecast by Product Form, 2020-2035
  • Table 95: Middle East and Africa Market Value (USD Million) Forecast by Sales Channel, 2020-2035
  • Table 96: Middle East and Africa Market Volume (Units) Forecast by Sales Channel, 2020-2035
  • Table 97: Middle East and Africa Market Value (USD Million) Forecast by End User, 2020-2035
  • Table 98: Middle East and Africa Market Volume (Units) Forecast by End User, 2020-2035

List of Figures

  • Figure 1: Global Market Value (USD Million) by Source Plant Type, 2025-2035
  • Figure 2: Global Market Value (USD Million) by Active Compound Type, 2025-2035
  • Figure 3: Global Market Value (USD Million) by Application, 2025-2035
  • Figure 4: Global Market Value (USD Million) by Product Form, 2025-2035
  • Figure 5: Global Market Value (USD Million) by Sales Channel, 2025-2035
  • Figure 6: Global Market Value (USD Million) by End User, 2025-2035
  • Figure 7: Global Market Value (USD Million) by Region, 2025-2035
  • Figure 8: Global Market Value (USD Million) Analysis by Region, 2020-2035
  • Figure 9: Global Market Volume (Units) Analysis by Region, 2020-2035
  • Figure 10: Global Market Value Share (%) and BPS Analysis by Region, 2025-2035
  • Figure 11: Global Market Y-o-Y Growth (%) Projections by Region, 2025-2035
  • Figure 12: Global Market Value (USD Million) Analysis by Source Plant Type, 2020-2035
  • Figure 13: Global Market Volume (Units) Analysis by Source Plant Type, 2020-2035
  • Figure 14: Global Market Value Share (%) and BPS Analysis by Source Plant Type, 2025-2035
  • Figure 15: Global Market Y-o-Y Growth (%) Projections by Source Plant Type, 2025-2035
  • Figure 16: Global Market Value (USD Million) Analysis by Active Compound Type, 2020-2035
  • Figure 17: Global Market Volume (Units) Analysis by Active Compound Type, 2020-2035
  • Figure 18: Global Market Value Share (%) and BPS Analysis by Active Compound Type, 2025-2035
  • Figure 19: Global Market Y-o-Y Growth (%) Projections by Active Compound Type, 2025-2035
  • Figure 20: Global Market Value (USD Million) Analysis by Application, 2020-2035
  • Figure 21: Global Market Volume (Units) Analysis by Application, 2020-2035
  • Figure 22: Global Market Value Share (%) and BPS Analysis by Application, 2025-2035
  • Figure 23: Global Market Y-o-Y Growth (%) Projections by Application, 2025-2035
  • Figure 24: Global Market Value (USD Million) Analysis by Product Form, 2020-2035
  • Figure 25: Global Market Volume (Units) Analysis by Product Form, 2020-2035
  • Figure 26: Global Market Value Share (%) and BPS Analysis by Product Form, 2025-2035
  • Figure 27: Global Market Y-o-Y Growth (%) Projections by Product Form, 2025-2035
  • Figure 28: Global Market Value (USD Million) Analysis by Sales Channel, 2020-2035
  • Figure 29: Global Market Volume (Units) Analysis by Sales Channel, 2020-2035
  • Figure 30: Global Market Value Share (%) and BPS Analysis by Sales Channel, 2025-2035
  • Figure 31: Global Market Y-o-Y Growth (%) Projections by Sales Channel, 2025-2035
  • Figure 32: Global Market Value (USD Million) Analysis by End User, 2020-2035
  • Figure 33: Global Market Volume (Units) Analysis by End User, 2020-2035
  • Figure 34: Global Market Value Share (%) and BPS Analysis by End User, 2025-2035
  • Figure 35: Global Market Y-o-Y Growth (%) Projections by End User, 2025-2035
  • Figure 36: Global Market Attractiveness by Source Plant Type, 2025-2035
  • Figure 37: Global Market Attractiveness by Active Compound Type, 2025-2035
  • Figure 38: Global Market Attractiveness by Application, 2025-2035
  • Figure 39: Global Market Attractiveness by Product Form, 2025-2035
  • Figure 40: Global Market Attractiveness by Sales Channel, 2025-2035
  • Figure 41: Global Market Attractiveness by End User, 2025-2035
  • Figure 42: Global Market Attractiveness by Region, 2025-2035
  • Figure 43: North America Market Value (USD Million) by Source Plant Type, 2025-2035
  • Figure 44: North America Market Value (USD Million) by Active Compound Type, 2025-2035
  • Figure 45: North America Market Value (USD Million) by Application, 2025-2035
  • Figure 46: North America Market Value (USD Million) by Product Form, 2025-2035
  • Figure 47: North America Market Value (USD Million) by Sales Channel, 2025-2035
  • Figure 48: North America Market Value (USD Million) by End User, 2025-2035
  • Figure 49: North America Market Value (USD Million) by Country, 2025-2035
  • Figure 50: North America Market Value (USD Million) Analysis by Country, 2020-2035
  • Figure 51: North America Market Volume (Units) Analysis by Country, 2020-2035
  • Figure 52: North America Market Value Share (%) and BPS Analysis by Country, 2025-2035
  • Figure 53: North America Market Y-o-Y Growth (%) Projections by Country, 2025-2035
  • Figure 54: North America Market Value (USD Million) Analysis by Source Plant Type, 2020-2035
  • Figure 55: North America Market Volume (Units) Analysis by Source Plant Type, 2020-2035
  • Figure 56: North America Market Value Share (%) and BPS Analysis by Source Plant Type, 2025-2035
  • Figure 57: North America Market Y-o-Y Growth (%) Projections by Source Plant Type, 2025-2035
  • Figure 58: North America Market Value (USD Million) Analysis by Active Compound Type, 2020-2035
  • Figure 59: North America Market Volume (Units) Analysis by Active Compound Type, 2020-2035
  • Figure 60: North America Market Value Share (%) and BPS Analysis by Active Compound Type, 2025-2035
  • Figure 61: North America Market Y-o-Y Growth (%) Projections by Active Compound Type, 2025-2035
  • Figure 62: North America Market Value (USD Million) Analysis by Application, 2020-2035
  • Figure 63: North America Market Volume (Units) Analysis by Application, 2020-2035
  • Figure 64: North America Market Value Share (%) and BPS Analysis by Application, 2025-2035
  • Figure 65: North America Market Y-o-Y Growth (%) Projections by Application, 2025-2035
  • Figure 66: North America Market Value (USD Million) Analysis by Product Form, 2020-2035
  • Figure 67: North America Market Volume (Units) Analysis by Product Form, 2020-2035
  • Figure 68: North America Market Value Share (%) and BPS Analysis by Product Form, 2025-2035
  • Figure 69: North America Market Y-o-Y Growth (%) Projections by Product Form, 2025-2035
  • Figure 70: North America Market Value (USD Million) Analysis by Sales Channel, 2020-2035
  • Figure 71: North America Market Volume (Units) Analysis by Sales Channel, 2020-2035
  • Figure 72: North America Market Value Share (%) and BPS Analysis by Sales Channel, 2025-2035
  • Figure 73: North America Market Y-o-Y Growth (%) Projections by Sales Channel, 2025-2035
  • Figure 74: North America Market Value (USD Million) Analysis by End User, 2020-2035
  • Figure 75: North America Market Volume (Units) Analysis by End User, 2020-2035
  • Figure 76: North America Market Value Share (%) and BPS Analysis by End User, 2025-2035
  • Figure 77: North America Market Y-o-Y Growth (%) Projections by End User, 2025-2035
  • Figure 78: North America Market Attractiveness by Source Plant Type, 2025-2035
  • Figure 79: North America Market Attractiveness by Active Compound Type, 2025-2035
  • Figure 80: North America Market Attractiveness by Application, 2025-2035
  • Figure 81: North America Market Attractiveness by Product Form, 2025-2035
  • Figure 82: North America Market Attractiveness by Sales Channel, 2025-2035
  • Figure 83: North America Market Attractiveness by End User, 2025-2035
  • Figure 84: North America Market Attractiveness by Country, 2025-2035
  • Figure 85: Latin America Market Value (USD Million) by Source Plant Type, 2025-2035
  • Figure 86: Latin America Market Value (USD Million) by Active Compound Type, 2025-2035
  • Figure 87: Latin America Market Value (USD Million) by Application, 2025-2035
  • Figure 88: Latin America Market Value (USD Million) by Product Form, 2025-2035
  • Figure 89: Latin America Market Value (USD Million) by Sales Channel, 2025-2035
  • Figure 90: Latin America Market Value (USD Million) by End User, 2025-2035
  • Figure 91: Latin America Market Value (USD Million) by Country, 2025-2035
  • Figure 92: Latin America Market Value (USD Million) Analysis by Country, 2020-2035
  • Figure 93: Latin America Market Volume (Units) Analysis by Country, 2020-2035
  • Figure 94: Latin America Market Value Share (%) and BPS Analysis by Country, 2025-2035
  • Figure 95: Latin America Market Y-o-Y Growth (%) Projections by Country, 2025-2035
  • Figure 96: Latin America Market Value (USD Million) Analysis by Source Plant Type, 2020-2035
  • Figure 97: Latin America Market Volume (Units) Analysis by Source Plant Type, 2020-2035
  • Figure 98: Latin America Market Value Share (%) and BPS Analysis by Source Plant Type, 2025-2035
  • Figure 99: Latin America Market Y-o-Y Growth (%) Projections by Source Plant Type, 2025-2035
  • Figure 100: Latin America Market Value (USD Million) Analysis by Active Compound Type, 2020-2035
  • Figure 101: Latin America Market Volume (Units) Analysis by Active Compound Type, 2020-2035
  • Figure 102: Latin America Market Value Share (%) and BPS Analysis by Active Compound Type, 2025-2035
  • Figure 103: Latin America Market Y-o-Y Growth (%) Projections by Active Compound Type, 2025-2035
  • Figure 104: Latin America Market Value (USD Million) Analysis by Application, 2020-2035
  • Figure 105: Latin America Market Volume (Units) Analysis by Application, 2020-2035
  • Figure 106: Latin America Market Value Share (%) and BPS Analysis by Application, 2025-2035
  • Figure 107: Latin America Market Y-o-Y Growth (%) Projections by Application, 2025-2035
  • Figure 108: Latin America Market Value (USD Million) Analysis by Product Form, 2020-2035
  • Figure 109: Latin America Market Volume (Units) Analysis by Product Form, 2020-2035
  • Figure 110: Latin America Market Value Share (%) and BPS Analysis by Product Form, 2025-2035
  • Figure 111: Latin America Market Y-o-Y Growth (%) Projections by Product Form, 2025-2035
  • Figure 112: Latin America Market Value (USD Million) Analysis by Sales Channel, 2020-2035
  • Figure 113: Latin America Market Volume (Units) Analysis by Sales Channel, 2020-2035
  • Figure 114: Latin America Market Value Share (%) and BPS Analysis by Sales Channel, 2025-2035
  • Figure 115: Latin America Market Y-o-Y Growth (%) Projections by Sales Channel, 2025-2035
  • Figure 116: Latin America Market Value (USD Million) Analysis by End User, 2020-2035
  • Figure 117: Latin America Market Volume (Units) Analysis by End User, 2020-2035
  • Figure 118: Latin America Market Value Share (%) and BPS Analysis by End User, 2025-2035
  • Figure 119: Latin America Market Y-o-Y Growth (%) Projections by End User, 2025-2035
  • Figure 120: Latin America Market Attractiveness by Source Plant Type, 2025-2035
  • Figure 121: Latin America Market Attractiveness by Active Compound Type, 2025-2035
  • Figure 122: Latin America Market Attractiveness by Application, 2025-2035
  • Figure 123: Latin America Market Attractiveness by Product Form, 2025-2035
  • Figure 124: Latin America Market Attractiveness by Sales Channel, 2025-2035
  • Figure 125: Latin America Market Attractiveness by End User, 2025-2035
  • Figure 126: Latin America Market Attractiveness by Country, 2025-2035
  • Figure 127: Europe Market Value (USD Million) by Source Plant Type, 2025-2035
  • Figure 128: Europe Market Value (USD Million) by Active Compound Type, 2025-2035
  • Figure 129: Europe Market Value (USD Million) by Application, 2025-2035
  • Figure 130: Europe Market Value (USD Million) by Product Form, 2025-2035
  • Figure 131: Europe Market Value (USD Million) by Sales Channel, 2025-2035
  • Figure 132: Europe Market Value (USD Million) by End User, 2025-2035
  • Figure 133: Europe Market Value (USD Million) by Country, 2025-2035
  • Figure 134: Europe Market Value (USD Million) Analysis by Country, 2020-2035
  • Figure 135: Europe Market Volume (Units) Analysis by Country, 2020-2035
  • Figure 136: Europe Market Value Share (%) and BPS Analysis by Country, 2025-2035
  • Figure 137: Europe Market Y-o-Y Growth (%) Projections by Country, 2025-2035
  • Figure 138: Europe Market Value (USD Million) Analysis by Source Plant Type, 2020-2035
  • Figure 139: Europe Market Volume (Units) Analysis by Source Plant Type, 2020-2035
  • Figure 140: Europe Market Value Share (%) and BPS Analysis by Source Plant Type, 2025-2035
  • Figure 141: Europe Market Y-o-Y Growth (%) Projections by Source Plant Type, 2025-2035
  • Figure 142: Europe Market Value (USD Million) Analysis by Active Compound Type, 2020-2035
  • Figure 143: Europe Market Volume (Units) Analysis by Active Compound Type, 2020-2035
  • Figure 144: Europe Market Value Share (%) and BPS Analysis by Active Compound Type, 2025-2035
  • Figure 145: Europe Market Y-o-Y Growth (%) Projections by Active Compound Type, 2025-2035
  • Figure 146: Europe Market Value (USD Million) Analysis by Application, 2020-2035
  • Figure 147: Europe Market Volume (Units) Analysis by Application, 2020-2035
  • Figure 148: Europe Market Value Share (%) and BPS Analysis by Application, 2025-2035
  • Figure 149: Europe Market Y-o-Y Growth (%) Projections by Application, 2025-2035
  • Figure 150: Europe Market Value (USD Million) Analysis by Product Form, 2020-2035
  • Figure 151: Europe Market Volume (Units) Analysis by Product Form, 2020-2035
  • Figure 152: Europe Market Value Share (%) and BPS Analysis by Product Form, 2025-2035
  • Figure 153: Europe Market Y-o-Y Growth (%) Projections by Product Form, 2025-2035
  • Figure 154: Europe Market Value (USD Million) Analysis by Sales Channel, 2020-2035
  • Figure 155: Europe Market Volume (Units) Analysis by Sales Channel, 2020-2035
  • Figure 156: Europe Market Value Share (%) and BPS Analysis by Sales Channel, 2025-2035
  • Figure 157: Europe Market Y-o-Y Growth (%) Projections by Sales Channel, 2025-2035
  • Figure 158: Europe Market Value (USD Million) Analysis by End User, 2020-2035
  • Figure 159: Europe Market Volume (Units) Analysis by End User, 2020-2035
  • Figure 160: Europe Market Value Share (%) and BPS Analysis by End User, 2025-2035
  • Figure 161: Europe Market Y-o-Y Growth (%) Projections by End User, 2025-2035
  • Figure 162: Europe Market Attractiveness by Source Plant Type, 2025-2035
  • Figure 163: Europe Market Attractiveness by Active Compound Type, 2025-2035
  • Figure 164: Europe Market Attractiveness by Application, 2025-2035
  • Figure 165: Europe Market Attractiveness by Product Form, 2025-2035
  • Figure 166: Europe Market Attractiveness by Sales Channel, 2025-2035
  • Figure 167: Europe Market Attractiveness by End User, 2025-2035
  • Figure 168: Europe Market Attractiveness by Country, 2025-2035
  • Figure 169: East Asia Market Value (USD Million) by Source Plant Type, 2025-2035
  • Figure 170: East Asia Market Value (USD Million) by Active Compound Type, 2025-2035
  • Figure 171: East Asia Market Value (USD Million) by Application, 2025-2035
  • Figure 172: East Asia Market Value (USD Million) by Product Form, 2025-2035
  • Figure 173: East Asia Market Value (USD Million) by Sales Channel, 2025-2035
  • Figure 174: East Asia Market Value (USD Million) by End User, 2025-2035
  • Figure 175: East Asia Market Value (USD Million) by Country, 2025-2035
  • Figure 176: East Asia Market Value (USD Million) Analysis by Country, 2020-2035
  • Figure 177: East Asia Market Volume (Units) Analysis by Country, 2020-2035
  • Figure 178: East Asia Market Value Share (%) and BPS Analysis by Country, 2025-2035
  • Figure 179: East Asia Market Y-o-Y Growth (%) Projections by Country, 2025-2035
  • Figure 180: East Asia Market Value (USD Million) Analysis by Source Plant Type, 2020-2035
  • Figure 181: East Asia Market Volume (Units) Analysis by Source Plant Type, 2020-2035
  • Figure 182: East Asia Market Value Share (%) and BPS Analysis by Source Plant Type, 2025-2035
  • Figure 183: East Asia Market Y-o-Y Growth (%) Projections by Source Plant Type, 2025-2035
  • Figure 184: East Asia Market Value (USD Million) Analysis by Active Compound Type, 2020-2035
  • Figure 185: East Asia Market Volume (Units) Analysis by Active Compound Type, 2020-2035
  • Figure 186: East Asia Market Value Share (%) and BPS Analysis by Active Compound Type, 2025-2035
  • Figure 187: East Asia Market Y-o-Y Growth (%) Projections by Active Compound Type, 2025-2035
  • Figure 188: East Asia Market Value (USD Million) Analysis by Application, 2020-2035
  • Figure 189: East Asia Market Volume (Units) Analysis by Application, 2020-2035
  • Figure 190: East Asia Market Value Share (%) and BPS Analysis by Application, 2025-2035
  • Figure 191: East Asia Market Y-o-Y Growth (%) Projections by Application, 2025-2035
  • Figure 192: East Asia Market Value (USD Million) Analysis by Product Form, 2020-2035
  • Figure 193: East Asia Market Volume (Units) Analysis by Product Form, 2020-2035
  • Figure 194: East Asia Market Value Share (%) and BPS Analysis by Product Form, 2025-2035
  • Figure 195: East Asia Market Y-o-Y Growth (%) Projections by Product Form, 2025-2035
  • Figure 196: East Asia Market Value (USD Million) Analysis by Sales Channel, 2020-2035
  • Figure 197: East Asia Market Volume (Units) Analysis by Sales Channel, 2020-2035
  • Figure 198: East Asia Market Value Share (%) and BPS Analysis by Sales Channel, 2025-2035
  • Figure 199: East Asia Market Y-o-Y Growth (%) Projections by Sales Channel, 2025-2035
  • Figure 200: East Asia Market Value (USD Million) Analysis by End User, 2020-2035
  • Figure 201: East Asia Market Volume (Units) Analysis by End User, 2020-2035
  • Figure 202: East Asia Market Value Share (%) and BPS Analysis by End User, 2025-2035
  • Figure 203: East Asia Market Y-o-Y Growth (%) Projections by End User, 2025-2035
  • Figure 204: East Asia Market Attractiveness by Source Plant Type, 2025-2035
  • Figure 205: East Asia Market Attractiveness by Active Compound Type, 2025-2035
  • Figure 206: East Asia Market Attractiveness by Application, 2025-2035
  • Figure 207: East Asia Market Attractiveness by Product Form, 2025-2035
  • Figure 208: East Asia Market Attractiveness by Sales Channel, 2025-2035
  • Figure 209: East Asia Market Attractiveness by End User, 2025-2035
  • Figure 210: East Asia Market Attractiveness by Country, 2025-2035
  • Figure 211: South Asia & Pacific Market Value (USD Million) by Source Plant Type, 2025-2035
  • Figure 212: South Asia & Pacific Market Value (USD Million) by Active Compound Type, 2025-2035
  • Figure 213: South Asia & Pacific Market Value (USD Million) by Application, 2025-2035
  • Figure 214: South Asia & Pacific Market Value (USD Million) by Product Form, 2025-2035
  • Figure 215: South Asia & Pacific Market Value (USD Million) by Sales Channel, 2025-2035
  • Figure 216: South Asia & Pacific Market Value (USD Million) by End User, 2025-2035
  • Figure 217: South Asia & Pacific Market Value (USD Million) by Country, 2025-2035
  • Figure 218: South Asia & Pacific Market Value (USD Million) Analysis by Country, 2020-2035
  • Figure 219: South Asia & Pacific Market Volume (Units) Analysis by Country, 2020-2035
  • Figure 220: South Asia & Pacific Market Value Share (%) and BPS Analysis by Country, 2025-2035
  • Figure 221: South Asia & Pacific Market Y-o-Y Growth (%) Projections by Country, 2025-2035
  • Figure 222: South Asia & Pacific Market Value (USD Million) Analysis by Source Plant Type, 2020-2035
  • Figure 223: South Asia & Pacific Market Volume (Units) Analysis by Source Plant Type, 2020-2035
  • Figure 224: South Asia & Pacific Market Value Share (%) and BPS Analysis by Source Plant Type, 2025-2035
  • Figure 225: South Asia & Pacific Market Y-o-Y Growth (%) Projections by Source Plant Type, 2025-2035
  • Figure 226: South Asia & Pacific Market Value (USD Million) Analysis by Active Compound Type, 2020-2035
  • Figure 227: South Asia & Pacific Market Volume (Units) Analysis by Active Compound Type, 2020-2035
  • Figure 228: South Asia & Pacific Market Value Share (%) and BPS Analysis by Active Compound Type, 2025-2035
  • Figure 229: South Asia & Pacific Market Y-o-Y Growth (%) Projections by Active Compound Type, 2025-2035
  • Figure 230: South Asia & Pacific Market Value (USD Million) Analysis by Application, 2020-2035
  • Figure 231: South Asia & Pacific Market Volume (Units) Analysis by Application, 2020-2035
  • Figure 232: South Asia & Pacific Market Value Share (%) and BPS Analysis by Application, 2025-2035
  • Figure 233: South Asia & Pacific Market Y-o-Y Growth (%) Projections by Application, 2025-2035
  • Figure 234: South Asia & Pacific Market Value (USD Million) Analysis by Product Form, 2020-2035
  • Figure 235: South Asia & Pacific Market Volume (Units) Analysis by Product Form, 2020-2035
  • Figure 236: South Asia & Pacific Market Value Share (%) and BPS Analysis by Product Form, 2025-2035
  • Figure 237: South Asia & Pacific Market Y-o-Y Growth (%) Projections by Product Form, 2025-2035
  • Figure 238: South Asia & Pacific Market Value (USD Million) Analysis by Sales Channel, 2020-2035
  • Figure 239: South Asia & Pacific Market Volume (Units) Analysis by Sales Channel, 2020-2035
  • Figure 240: South Asia & Pacific Market Value Share (%) and BPS Analysis by Sales Channel, 2025-2035
  • Figure 241: South Asia & Pacific Market Y-o-Y Growth (%) Projections by Sales Channel, 2025-2035
  • Figure 242: South Asia & Pacific Market Value (USD Million) Analysis by End User, 2020-2035
  • Figure 243: South Asia & Pacific Market Volume (Units) Analysis by End User, 2020-2035
  • Figure 244: South Asia & Pacific Market Value Share (%) and BPS Analysis by End User, 2025-2035
  • Figure 245: South Asia & Pacific Market Y-o-Y Growth (%) Projections by End User, 2025-2035
  • Figure 246: South Asia & Pacific Market Attractiveness by Source Plant Type, 2025-2035
  • Figure 247: South Asia & Pacific Market Attractiveness by Active Compound Type, 2025-2035
  • Figure 248: South Asia & Pacific Market Attractiveness by Application, 2025-2035
  • Figure 249: South Asia & Pacific Market Attractiveness by Product Form, 2025-2035
  • Figure 250: South Asia & Pacific Market Attractiveness by Sales Channel, 2025-2035
  • Figure 251: South Asia & Pacific Market Attractiveness by End User, 2025-2035
  • Figure 252: South Asia & Pacific Market Attractiveness by Country, 2025-2035
  • Figure 253: Middle East and Africa Market Value (USD Million) by Source Plant Type, 2025-2035
  • Figure 254: Middle East and Africa Market Value (USD Million) by Active Compound Type, 2025-2035
  • Figure 255: Middle East and Africa Market Value (USD Million) by Application, 2025-2035
  • Figure 256: Middle East and Africa Market Value (USD Million) by Product Form, 2025-2035
  • Figure 257: Middle East and Africa Market Value (USD Million) by Sales Channel, 2025-2035
  • Figure 258: Middle East and Africa Market Value (USD Million) by End User, 2025-2035
  • Figure 259: Middle East and Africa Market Value (USD Million) by Country, 2025-2035
  • Figure 260: Middle East and Africa Market Value (USD Million) Analysis by Country, 2020-2035
  • Figure 261: Middle East and Africa Market Volume (Units) Analysis by Country, 2020-2035
  • Figure 262: Middle East and Africa Market Value Share (%) and BPS Analysis by Country, 2025-2035
  • Figure 263: Middle East and Africa Market Y-o-Y Growth (%) Projections by Country, 2025-2035
  • Figure 264: Middle East and Africa Market Value (USD Million) Analysis by Source Plant Type, 2020-2035
  • Figure 265: Middle East and Africa Market Volume (Units) Analysis by Source Plant Type, 2020-2035
  • Figure 266: Middle East and Africa Market Value Share (%) and BPS Analysis by Source Plant Type, 2025-2035
  • Figure 267: Middle East and Africa Market Y-o-Y Growth (%) Projections by Source Plant Type, 2025-2035
  • Figure 268: Middle East and Africa Market Value (USD Million) Analysis by Active Compound Type, 2020-2035
  • Figure 269: Middle East and Africa Market Volume (Units) Analysis by Active Compound Type, 2020-2035
  • Figure 270: Middle East and Africa Market Value Share (%) and BPS Analysis by Active Compound Type, 2025-2035
  • Figure 271: Middle East and Africa Market Y-o-Y Growth (%) Projections by Active Compound Type, 2025-2035
  • Figure 272: Middle East and Africa Market Value (USD Million) Analysis by Application, 2020-2035
  • Figure 273: Middle East and Africa Market Volume (Units) Analysis by Application, 2020-2035
  • Figure 274: Middle East and Africa Market Value Share (%) and BPS Analysis by Application, 2025-2035
  • Figure 275: Middle East and Africa Market Y-o-Y Growth (%) Projections by Application, 2025-2035
  • Figure 276: Middle East and Africa Market Value (USD Million) Analysis by Product Form, 2020-2035
  • Figure 277: Middle East and Africa Market Volume (Units) Analysis by Product Form, 2020-2035
  • Figure 278: Middle East and Africa Market Value Share (%) and BPS Analysis by Product Form, 2025-2035
  • Figure 279: Middle East and Africa Market Y-o-Y Growth (%) Projections by Product Form, 2025-2035
  • Figure 280: Middle East and Africa Market Value (USD Million) Analysis by Sales Channel, 2020-2035
  • Figure 281: Middle East and Africa Market Volume (Units) Analysis by Sales Channel, 2020-2035
  • Figure 282: Middle East and Africa Market Value Share (%) and BPS Analysis by Sales Channel, 2025-2035
  • Figure 283: Middle East and Africa Market Y-o-Y Growth (%) Projections by Sales Channel, 2025-2035
  • Figure 284: Middle East and Africa Market Value (USD Million) Analysis by End User, 2020-2035
  • Figure 285: Middle East and Africa Market Volume (Units) Analysis by End User, 2020-2035
  • Figure 286: Middle East and Africa Market Value Share (%) and BPS Analysis by End User, 2025-2035
  • Figure 287: Middle East and Africa Market Y-o-Y Growth (%) Projections by End User, 2025-2035
  • Figure 288: Middle East and Africa Market Attractiveness by Source Plant Type, 2025-2035
  • Figure 289: Middle East and Africa Market Attractiveness by Active Compound Type, 2025-2035
  • Figure 290: Middle East and Africa Market Attractiveness by Application, 2025-2035
  • Figure 291: Middle East and Africa Market Attractiveness by Product Form, 2025-2035
  • Figure 292: Middle East and Africa Market Attractiveness by Sales Channel, 2025-2035
  • Figure 293: Middle East and Africa Market Attractiveness by End User, 2025-2035
  • Figure 294: Middle East and Africa Market Attractiveness by Country, 2025-2035

Frequently Asked Questions

How big is the Botanical Bioactive Market in 2025?

The global Botanical Bioactive Market is estimated to be valued at USD 3.4 billion in 2025.

What will be the size of the Botanical Bioactive Market in 2035?

The market size for the Botanical Bioactive Market is projected to reach USD 6.2 billion by 2035.

How much will be the Botanical Bioactive Market growth between 2025 and 2035?

The Botanical Bioactive Market is expected to grow at a 6.1% CAGR between 2025 and 2035.

What are the key active compound types in the Botanical Bioactive Market?

The key active compound types in the Botanical Bioactive Market are Polyphenols & Flavonoids, Alkaloids, Terpenoids & Essential Oils, Saponins, Tannins, Glycosides, Lignans, and Anthocyanins.

Which active compound segment is expected to contribute significant share in the Botanical Bioactive Market in 2025?

In terms of active compound type, Polyphenols & Flavonoids are expected to command 26% share in the Botanical Bioactive Market in 2025.

Explore Similar Insights

Future Market Insights

Botanical Bioactives Market