Reports

- Global Locations -

Headquarters

Future Market Insights, Inc.

Christiana Corporate, 200
Continental Drive, Suite 401,
Newark, Delaware - 19713,
United States

T: +1-845-579-5705

Americas

Future Market Insights, Inc.

616 Corporate Way, Suite 2-9018,
Valley Cottage, NY 10989, United States

T: +1-347-918-3531

MEA

Future Market Insights

1602-6 Jumeirah Bay X2 Tower, Plot No: JLT-PH2-X2A,
Jumeirah Lakes Towers, Dubai,
United Arab Emirates

Europe

Future Market Insights

3rd Floor, 207 Regent Street,
W1B 3HH London
United Kingdom

T: + 44 (0) 20 8123 9659
D: +44 (0) 20 3287 4268

Asia Pacific

Future Market Insights

IndiaLand Global Tech Park, Unit UG-1, Behind Grand HighStreet, Phase 1, Hinjawadi, MH, Pune – 411057, India

Botanical Flavors Market Snapshot (2023 to 2033)

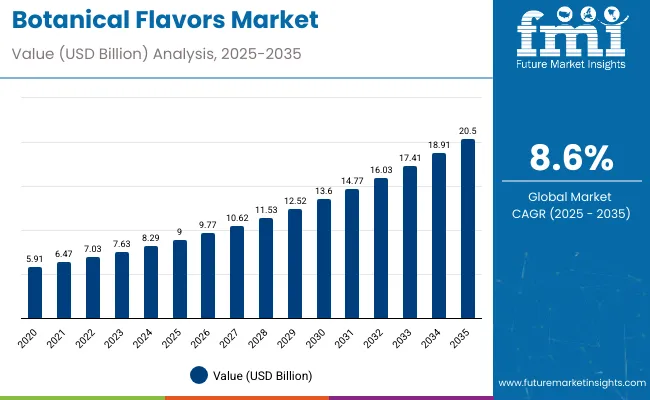
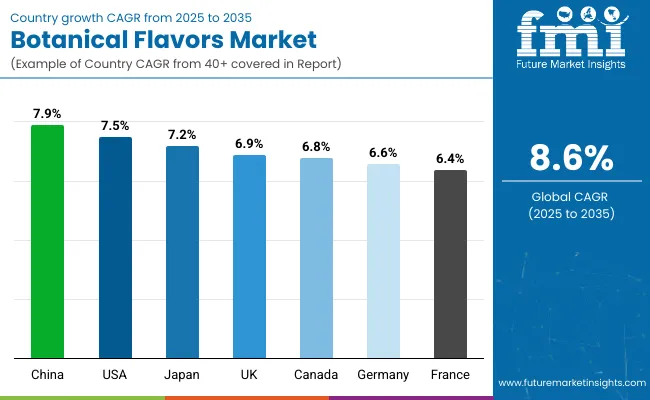
The global botanical flavors demand is anticipated to be valued at US$ 8233.6 million in 2023, forecast to grow at a CAGR of 8.6% to be valued at US$ 18,871 million from 2023 to 2033. Healthy alternatives are becoming more popular among consumers, while preemptive health care has become a necessity for a healthier lifestyle. Due to their bioactive compounds and diversity of biological effects, botanical flavors are increasingly used in food & beverage manufacturing.

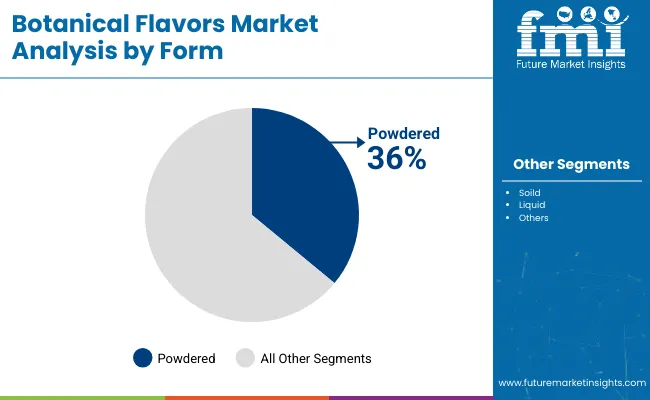
In addition to their shelf life, powdered botanical flavors have proven to be in high demand since consumers demand products with high caffeine content. During COVID-19, the demand for personal hygiene products such as mouthwash, toothpaste, facial toners, etc., increased significantly, resulting in a significant increase in botanical flavors market demand.

Report Attribute Details
Estimated Base Year Value (2022) US$ 7,876.7 million
Expected Market Value (2023) US$ 8233.6 million
Anticipated Forecast Value (2033) US$ 18,871 million
Projected Growth Rate (2023 to 2033) 8.6% CAGR

Over the past decade, the market for botanicals has changed significantly as new segments have emerged, including nutrition, skin care, and animal feed. The advancements in science and technology have also provided manufacturers with a new opportunity to position natural ingredients in products that are not only competing with synthetics but also with medicinal ingredients. In the coming years, botanical ingredients are expected to gain substantial traction in the cosmetic and personal care market. Consumers and healthcare professionals benefit from botanical skincare ingredients' high quality and safety standards.

India is considered one of the most lucrative markets for botanicals and products derived from them because of the widespread use of these Ayurvedic treatments in various industries. With the increase in the e-commerce market, there is also an increase in the market demand for botanical flavors in a wide range of industries in the market.

As small and large businesses have grown, the demand for botanical ingredients has also increased. For instance, New Hope Network discovered numerous products infused with herbal and botanical flavors at the Summer Fancy Food Show. In a variety of products, these natural flavors stood out. New flavors such as Belvoir Farm Sparkling Elderflower Lemonade, Hella Cocktail Co.Bitters & Soda Spritz Aromatic, Clark and Hopkins Laos Hot Sauce with Lemongrss, Cleveland Kitchen Kraut Whiskey Dill, and many more.

Don't pay for what you don't need

Customize your report by selecting specific countries or regions and save 30%!

What Are Factors Driving the Growth of the Botanical Flavors Market?

Food and beverage manufacturers use botanical flavors as natural ingredients and functional ingredients in their recipes, which has fueled demand for botanical flavors worldwide. Companies have integrated botanical flavors into their existing products and are offering where new beverages with botanical flavors are in high demand in the market.

As chronic diseases become more prevalent, the demand for multifunctional products increases significantly. Additionally, it has various healthy attributes, making it an extremely useful product for companies trying to meet consumers' growing demand for healthy and organic foods in the market.

Due to the innovation and formulation of nutritional beverages, the beverage industry is facing stiff competition globally as companies are concentrating on health benefits and flavor options. A variety of plant-based remedies and protections can be obtained from botanical-infused flavors in the market.

As a result of their fragrance, these infusions can alleviate depression and uplift moods. There are many different uses for these infusions, including natural therapies, alternative medicines, and pharmaceutical applications as well. Food and beverage industries are using botanical flavors to enhance the taste and flavor of their products and their nutritional value by adding real botanical flavor.

In addition to the antifungal, antimicrobial, and antibacterial properties, botanically infused flavors also help improve the taste of beverages for easier consumption and a more positive health outcome worldwide. Consumers seeking enhanced health benefits and natural-based products are also increasingly seeking botanical flavors. Besides having a lot of nutritional value, botanical flavors also have protein, vitamins, and other minerals within them. Additionally, consumers are now experiencing a distinct taste of natural ingredients when they eat and drink daily.

By increasing sleep time and promoting a relaxed sleep cycle, these beverages also help reduce weight, chronic inflammation, and insomnia. Natural alternatives are becoming more popular as consumers become more aware of the negative effects of synthesized flavors and products on illnesses such as obesity, diabetes, and heart disease.

What Factors Limit the Growth of the Botanical Flavors in the Market?

Due to the hype around natural and healthy beverages, the market is experiencing many negative health issues associated with these flavors. Several countries have banned flavor enhancers in infant food since they are known to cause serious brain damage and paralysis. In addition to this, these flavors are extremely addictive due to the toxic chemicals tasted by the taste buds, and their desire for more and more will keep increasing over time. A great deal of decline for these flavors in the market has also been seen in the use of preservatives and chemicals to extend shelf life since the outbreak of COVID-19.

These flavors have hidden negative effects on the body, causing diseases such as depression, migraines, insomnia, headaches, nausea, and more. As there are such a large number of products that are or contain a very high percentage of free glutamates, avoiding their consumption may seem impossible. Due to this concern, many people who try to avoid MSG and other natural flavor enhancers, even those who have committed not to consume them, are limiting the growth of botanical flavors.

Nandini Roy Choudhury

Principal Consultant

Talk to Analyst

Find your sweet spots for generating winning opportunities in this market.

How Does North America Dominate the Market for Botanical Flavors in the Market?

North America is expected to have a market share of 29.4% in 2022. According to the forecast, the North American market is expected to account for the majority of growth, both in terms of value and volume, during the forecast period. Plant-based flavors in North America are greatly influenced by the presence of key manufacturers with broad distribution networks. In addition to the growing vegan population, and the rising popularity of natural & organic food products in the market has highly influenced the growth of this market.

A growing market for sports nutrition is expected to increase demand for botanical flavorings, which is expected to be beneficial to the market as a whole. The increasing demand for clean-label products in the market has helped to propel the demand for these products in the market. With more and more people looking for healthy and active lifestyles, along with the COVID-19 spreading across the globe, the demand for botanical flavors is likely to rise in the coming years.

What are the Reasons for the Growth of the European Botanical Flavors Market?

A significant growth rate is being experienced in the European region, which provides manufacturers with an excellent opportunity for growth in the market. According to estimates, the European market share is expected to accumulate a market share worth 27.5% in 2022.

With the increasing demand for cosmetics and anti-aging products in the market, botanical flavors have seen tremendous growth. As a result of growing market demands for natural and fruit-based products, botanical fruit-based products are now on the rise, and their demand is expected to continue to rise in the coming years.

A growing middle-class population, rising disposable income, and diet-conscious consumers are driving product demand in Europe. In addition, the bakery industry in Europe delivers high-quality natural and healthy bakery products containing dietary fibers, which has been contributing to the demand for botanical-based nutrients like dietary fibers in the market. Consumers are increasingly favoring herbal drinks, teas, and infusions. Due to this, companies are introducing new products to satisfy consumers' demands.

Get the data you need at a Fraction of the cost

Personalize your report by choosing insights you need
and save 40%!

How Does Asia Pacific Dominate the Market for Botanical Flavors in the Market?

From 2023 to 2033, Asia-Pacific is predicted to have the fastest growth rate, registering a CAGR of 8.1%. The utilization of portability of food products containing botanical ingredients is being stimulated by factors such as the penetration of organized and e-commerce retail.

The presence of a large number of distributors distinguishes the region. India, China, and Sri Lanka, for example, are the world's foremost tea producers. Furthermore, several other medicinal and non-medicinal botanicals, such as amla, hibiscus flower, and ginger, are widely grown in the region.

Because of the increased consumer preference for organic/natural products and the increased emphasis on healthy lifestyles, Asia Pacific may endure the fastest growth rate in the coming years.

The Start-Up Ecosystem: How Key Players are Opening Frontiers for Future Growth?

Manufacturers are adopting various marketing strategies such as new product launches, geographical expansion, mergers and acquisitions, partnerships, and collaboration to identify the interest of potential buyers and create a larger customer base. For instance,

In 2014, Sapphire Flavors & Fragrances was founded. Sapphire's food-grade botanicals can also be used to flavor food while also contributing a functional and beneficial component to a food or beverage product.

Flavour Bucket Private Limited was incorporated on 23 January 2020. The Flavour Bucket offers a variety of botanical flavors.

Market Competition

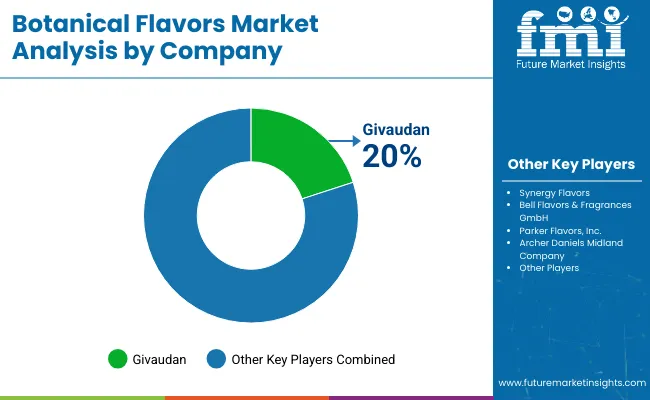
The botanical flavors market is dominated by companies such as Synergy Flavors, Bell Flavors & Fragrances GmbH, Parker Flavors, Inc., Archer Daniels Midland Company, Kanegrade Limited, Carrubba Incorporated, and Sapphire Flavors & Fragrances.

In January 2022, Firmenich announced its 2022 Flavor of the Year, Magical Botanical, addressing the creativity and well-being needs of a transformed society. A new era of inspired flavor creation begins with Firmenich's 2022 Flavor of the Year, Magical Botanical, an ode to Pantone's Color of the Year 2022, as well as botanicals' transformative properties. With their natural ingredients and traceable sourcing, the Magical Botanical flavors were designed around ingredients that support immunity and healing.

In April 2022, Kerry completed an acquisition of botanical extract firm Natreon, a supplier of branded ayurvedic botanical ingredients. In addition to expanding Kerry's ProActive Health portfolio of science-backed branded ingredients, the acquisition furthers the company's technological development. Patents protect several of Natreon's branded ingredients and a total of 52 clinical studies support their efficacy. Kerry’s ProActive Health portfolio will leverage the ingredients to benefit its diverse customer base. Kerry's global application and research network, including continuing investment in the science supporting the brands, will support them.

Key Companies Profiled

  • Synergy Flavors
  • Bell Flavors & Fragrances GmbH
  • Parker Flavors, Inc.
  • Archer Daniels Midland Company
  • Kanegrade Limited
  • Carrubba Incorporated
  • Sapphire Flavors & Fragrances

Recent Development:

  • By using their experience in natural product extraction, International Flavours & Fragrances Inc. (IFF) has made significant breakthroughs in the botanical flavors sector. They provide a diverse array of botanical flavors sourced from several plant sources, allowing for the production of distinct and genuine flavor profiles.
  • Symrise has spent money on research and development to generate cutting-edge botanical flavors. Their product line offers a diverse range of natural flavors derived from botanical components for use in drinks, snacks, and savory goods.
  • Sensient Technologies is a world leader in botanical flavors, providing a wide range of natural flavors derived from plant extracts. Their product line comprises botanical flavors for drinks, pastry, and dairy applications, giving consumers a variety of solutions to fit their needs.

Key Segments Profiled in the Botanical Flavors Industry Report

Botanical Flavors Market by Extraction:

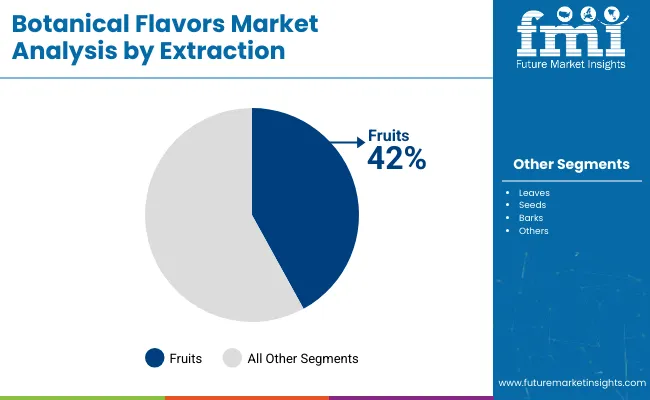
  • Fruits
  • Leaves
  • Seeds
  • Barks
  • Other (Herbs and Roots) Sources

Botanical Flavors Market by Form:

  • Solid Botanical Flavors
  • Fluid Botanical Flavors
  • Powdered Form Botanical Flavors

Botanical Flavors Market by Application:

  • Botanical Flavors for Food
  • Bakery
  • Dairy
  • Savory
  • Confectionery Products
  • Botanical Flavors for Beverages
  • Alcoholic
  • Non-alcoholic
  • Botanical Flavors for Personal Care Industry
  • Cosmetics
  • Hair Care
  • Skin Care Products

Botanical Flavors Market by Region:

  • North America
  • Latin America
  • Europe
  • Asia Pacific
  • Middle East & Africa

Frequently Asked Questions

How Big is the Botanical Flavors Market?

The botanical flavors market is worth US$ 8233.6 million in 2023.

What is the Projected CAGR of the Botanical Flavors Market?

The botanical flavors market may rise at an 8.6% CAGR through 2033.

How Big Will be the Botanical Flavors Market by 2033?

The botanical flavors market could be worth US$ 18,871 million by 2033.

Which Region Will Register Swift Growth in the Botanical Flavors Market?

Asia Pacific’s botanical flavors market is expected to clock an 8.1% CAGR through 2033.

What was Europe’s Share in the Botanical Flavors Market in 2022?

Europe occupied 27.5% of the botanical flavors market shares in 2022.

Table of Content

1. Executive Summary

    1.1. Global Market Outlook

    1.2. Demand-side Trends

    1.3. Supply-side Trends

    1.4. Technology Roadmap Analysis

    1.5. Analysis and Recommendations

2. Market Overview

    2.1. Market Coverage / Taxonomy

    2.2. Market Definition / Scope / Limitations

3. Market Background

    3.1. Market Dynamics

        3.1.1. Drivers

        3.1.2. Restraints

        3.1.3. Opportunity

        3.1.4. Trends

    3.2. Scenario Forecast

        3.2.1. Demand in Optimistic Scenario

        3.2.2. Demand in Likely Scenario

        3.2.3. Demand in Conservative Scenario

    3.3. Opportunity Map Analysis

    3.4. Product Life Cycle Analysis

    3.5. Supply Chain Analysis

        3.5.1. Supply Side Participants and their Roles

            3.5.1.1. Producers

            3.5.1.2. Mid-Level Participants (Traders/ Agents/ Brokers)

            3.5.1.3. Wholesalers and Distributors

        3.5.2. Value Added and Value Created at Node in the Supply Chain

        3.5.3. List of Raw Material Suppliers

        3.5.4. List of Existing and Potential Buyer’s

    3.6. Investment Feasibility Matrix

    3.7. Value Chain Analysis

        3.7.1. Profit Margin Analysis

        3.7.2. Wholesalers and Distributors

        3.7.3. Retailers

    3.8. PESTLE and Porter’s Analysis

    3.9. Regulatory Landscape

        3.9.1. By Key Regions

        3.9.2. By Key Countries

    3.10. Regional Parent Market Outlook

    3.11. Production and Consumption Statistics

    3.12. Import and Export Statistics

4. Global Market Analysis 2018 to 2022 and Forecast, 2023 to 2033

    4.1. Historical Market Size Value (US$ Million) & Volume (Tons) Analysis, 2018 to 2022

    4.2. Current and Future Market Size Value (US$ Million) & Volume (Tons) Projections, 2023 to 2033

        4.2.1. Y-o-Y Growth Trend Analysis

        4.2.2. Absolute $ Opportunity Analysis

5. Global Market Analysis 2018 to 2022 and Forecast 2023 to 2033, By Extraction

    5.1. Introduction / Key Findings

    5.2. Historical Market Size Value (US$ Million) & Volume (Tons) Analysis By Extraction, 2018 to 2022

    5.3. Current and Future Market Size Value (US$ Million) & Volume (Tons) Analysis and Forecast By Extraction, 2023 to 2033

        5.3.1. Fruits

        5.3.2. Leaves

        5.3.3. Seeds

        5.3.4. Barks

        5.3.5. Others

    5.4. Y-o-Y Growth Trend Analysis By Extraction, 2018 to 2022

    5.5. Absolute $ Opportunity Analysis By Extraction, 2023 to 2033

6. Global Market Analysis 2018 to 2022 and Forecast 2023 to 2033, By Form

    6.1. Introduction / Key Findings

    6.2. Historical Market Size Value (US$ Million) & Volume (Tons) Analysis By Form, 2018 to 2022

    6.3. Current and Future Market Size Value (US$ Million) & Volume (Tons) Analysis and Forecast By Form, 2023 to 2033

        6.3.1. Solid 

        6.3.2. Fluid 

        6.3.3. Powdered 

    6.4. Y-o-Y Growth Trend Analysis By Form, 2018 to 2022

    6.5. Absolute $ Opportunity Analysis By Form, 2023 to 2033

7. Global Market Analysis 2018 to 2022 and Forecast 2023 to 2033, By Application

    7.1. Introduction / Key Findings

    7.2. Historical Market Size Value (US$ Million) & Volume (Tons) Analysis By Application, 2018 to 2022

    7.3. Current and Future Market Size Value (US$ Million) & Volume (Tons) Analysis and Forecast By Application, 2023 to 2033

        7.3.1. Food

            7.3.1.1. Bakery

            7.3.1.2. Dairy

            7.3.1.3. Savory

            7.3.1.4. Confectionery Products

        7.3.2. Beverages

            7.3.2.1. Alcoholic

            7.3.2.2. Non-alcoholic

        7.3.3. Personal Care Industry

            7.3.3.1. Cosmetics

            7.3.3.2. Hair Care

            7.3.3.3. Skin Care Products

    7.4. Y-o-Y Growth Trend Analysis By Application, 2018 to 2022

    7.5. Absolute $ Opportunity Analysis By Application, 2023 to 2033

8. Global Market Analysis 2018 to 2022 and Forecast 2023 to 2033, By Region

    8.1. Introduction

    8.2. Historical Market Size Value (US$ Million) & Volume (Tons) Analysis By Region, 2018 to 2022

    8.3. Current Market Size Value (US$ Million) & Volume (Tons) Analysis and Forecast By Region, 2023 to 2033

        8.3.1. North America

        8.3.2. Latin America

        8.3.3. Western Europe

        8.3.4. Eastern Europe

        8.3.5. South Asia and Pacific

        8.3.6. East Asia

        8.3.7. Middle East and Africa

    8.4. Market Attractiveness Analysis By Region

9. North America Market Analysis 2018 to 2022 and Forecast 2023 to 2033, By Country

    9.1. Historical Market Size Value (US$ Million) & Volume (Tons) Trend Analysis By Market Taxonomy, 2018 to 2022

    9.2. Market Size Value (US$ Million) & Volume (Tons) Forecast By Market Taxonomy, 2023 to 2033

        9.2.1. By Country

            9.2.1.1. The USA

            9.2.1.2. Canada

        9.2.2. By Extraction

        9.2.3. By Form

        9.2.4. By Application

    9.3. Market Attractiveness Analysis

        9.3.1. By Country

        9.3.2. By Extraction

        9.3.3. By Form

        9.3.4. By Application

    9.4. Key Takeaways

10. Latin America Market Analysis 2018 to 2022 and Forecast 2023 to 2033, By Country

    10.1. Historical Market Size Value (US$ Million) & Volume (Tons) Trend Analysis By Market Taxonomy, 2018 to 2022

    10.2. Market Size Value (US$ Million) & Volume (Tons) Forecast By Market Taxonomy, 2023 to 2033

        10.2.1. By Country

            10.2.1.1. Brazil

            10.2.1.2. Mexico

            10.2.1.3. Rest of Latin America

        10.2.2. By Extraction

        10.2.3. By Form

        10.2.4. By Application

    10.3. Market Attractiveness Analysis

        10.3.1. By Country

        10.3.2. By Extraction

        10.3.3. By Form

        10.3.4. By Application

    10.4. Key Takeaways

11. Western Europe Market Analysis 2018 to 2022 and Forecast 2023 to 2033, By Country

    11.1. Historical Market Size Value (US$ Million) & Volume (Tons) Trend Analysis By Market Taxonomy, 2018 to 2022

    11.2. Market Size Value (US$ Million) & Volume (Tons) Forecast By Market Taxonomy, 2023 to 2033

        11.2.1. By Country

            11.2.1.1. Germany

            11.2.1.2. United Kingdom

            11.2.1.3. France

            11.2.1.4. Spain

            11.2.1.5. Italy

            11.2.1.6. Rest of Western Europe

        11.2.2. By Extraction

        11.2.3. By Form

        11.2.4. By Application

    11.3. Market Attractiveness Analysis

        11.3.1. By Country

        11.3.2. By Extraction

        11.3.3. By Form

        11.3.4. By Application

    11.4. Key Takeaways

12. Eastern Europe Market Analysis 2018 to 2022 and Forecast 2023 to 2033, By Country

    12.1. Historical Market Size Value (US$ Million) & Volume (Tons) Trend Analysis By Market Taxonomy, 2018 to 2022

    12.2. Market Size Value (US$ Million) & Volume (Tons) Forecast By Market Taxonomy, 2023 to 2033

        12.2.1. By Country

            12.2.1.1. Poland

            12.2.1.2. Russia

            12.2.1.3. Czech Republic

            12.2.1.4. Romania

            12.2.1.5. Rest of Eastern Europe

        12.2.2. By Extraction

        12.2.3. By Form

        12.2.4. By Application

    12.3. Market Attractiveness Analysis

        12.3.1. By Country

        12.3.2. By Extraction

        12.3.3. By Form

        12.3.4. By Application

    12.4. Key Takeaways

13. South Asia and Pacific Market Analysis 2018 to 2022 and Forecast 2023 to 2033, By Country

    13.1. Historical Market Size Value (US$ Million) & Volume (Tons) Trend Analysis By Market Taxonomy, 2018 to 2022

    13.2. Market Size Value (US$ Million) & Volume (Tons) Forecast By Market Taxonomy, 2023 to 2033

        13.2.1. By Country

            13.2.1.1. India

            13.2.1.2. Bangladesh

            13.2.1.3. Australia

            13.2.1.4. New Zealand

            13.2.1.5. Rest of South Asia and Pacific

        13.2.2. By Extraction

        13.2.3. By Form

        13.2.4. By Application

    13.3. Market Attractiveness Analysis

        13.3.1. By Country

        13.3.2. By Extraction

        13.3.3. By Form

        13.3.4. By Application

    13.4. Key Takeaways

14. East Asia Market Analysis 2018 to 2022 and Forecast 2023 to 2033, By Country

    14.1. Historical Market Size Value (US$ Million) & Volume (Tons) Trend Analysis By Market Taxonomy, 2018 to 2022

    14.2. Market Size Value (US$ Million) & Volume (Tons) Forecast By Market Taxonomy, 2023 to 2033

        14.2.1. By Country

            14.2.1.1. China

            14.2.1.2. Japan

            14.2.1.3. South Korea

        14.2.2. By Extraction

        14.2.3. By Form

        14.2.4. By Application

    14.3. Market Attractiveness Analysis

        14.3.1. By Country

        14.3.2. By Extraction

        14.3.3. By Form

        14.3.4. By Application

    14.4. Key Takeaways

15. Middle East and Africa Market Analysis 2018 to 2022 and Forecast 2023 to 2033, By Country

    15.1. Historical Market Size Value (US$ Million) & Volume (Tons) Trend Analysis By Market Taxonomy, 2018 to 2022

    15.2. Market Size Value (US$ Million) & Volume (Tons) Forecast By Market Taxonomy, 2023 to 2033

        15.2.1. By Country

            15.2.1.1. GCC Countries

            15.2.1.2. South Africa

            15.2.1.3. Israel

            15.2.1.4. Rest of MEA

        15.2.2. By Extraction

        15.2.3. By Form

        15.2.4. By Application

    15.3. Market Attractiveness Analysis

        15.3.1. By Country

        15.3.2. By Extraction

        15.3.3. By Form

        15.3.4. By Application

    15.4. Key Takeaways

16. Key Countries Market Analysis

    16.1. USA

        16.1.1. Pricing Analysis

        16.1.2. Market Share Analysis, 2022

            16.1.2.1. By Extraction

            16.1.2.2. By Form

            16.1.2.3. By Application

    16.2. Canada

        16.2.1. Pricing Analysis

        16.2.2. Market Share Analysis, 2022

            16.2.2.1. By Extraction

            16.2.2.2. By Form

            16.2.2.3. By Application

    16.3. Brazil

        16.3.1. Pricing Analysis

        16.3.2. Market Share Analysis, 2022

            16.3.2.1. By Extraction

            16.3.2.2. By Form

            16.3.2.3. By Application

    16.4. Mexico

        16.4.1. Pricing Analysis

        16.4.2. Market Share Analysis, 2022

            16.4.2.1. By Extraction

            16.4.2.2. By Form

            16.4.2.3. By Application

    16.5. Germany

        16.5.1. Pricing Analysis

        16.5.2. Market Share Analysis, 2022

            16.5.2.1. By Extraction

            16.5.2.2. By Form

            16.5.2.3. By Application

    16.6. United Kingdom

        16.6.1. Pricing Analysis

        16.6.2. Market Share Analysis, 2022

            16.6.2.1. By Extraction

            16.6.2.2. By Form

            16.6.2.3. By Application

    16.7. France

        16.7.1. Pricing Analysis

        16.7.2. Market Share Analysis, 2022

            16.7.2.1. By Extraction

            16.7.2.2. By Form

            16.7.2.3. By Application

    16.8. Spain

        16.8.1. Pricing Analysis

        16.8.2. Market Share Analysis, 2022

            16.8.2.1. By Extraction

            16.8.2.2. By Form

            16.8.2.3. By Application

    16.9. Italy

        16.9.1. Pricing Analysis

        16.9.2. Market Share Analysis, 2022

            16.9.2.1. By Extraction

            16.9.2.2. By Form

            16.9.2.3. By Application

    16.10. Poland

        16.10.1. Pricing Analysis

        16.10.2. Market Share Analysis, 2022

            16.10.2.1. By Extraction

            16.10.2.2. By Form

            16.10.2.3. By Application

    16.11. Russia

        16.11.1. Pricing Analysis

        16.11.2. Market Share Analysis, 2022

            16.11.2.1. By Extraction

            16.11.2.2. By Form

            16.11.2.3. By Application

    16.12. Czech Republic

        16.12.1. Pricing Analysis

        16.12.2. Market Share Analysis, 2022

            16.12.2.1. By Extraction

            16.12.2.2. By Form

            16.12.2.3. By Application

    16.13. Romania

        16.13.1. Pricing Analysis

        16.13.2. Market Share Analysis, 2022

            16.13.2.1. By Extraction

            16.13.2.2. By Form

            16.13.2.3. By Application

    16.14. India

        16.14.1. Pricing Analysis

        16.14.2. Market Share Analysis, 2022

            16.14.2.1. By Extraction

            16.14.2.2. By Form

            16.14.2.3. By Application

    16.15. Bangladesh

        16.15.1. Pricing Analysis

        16.15.2. Market Share Analysis, 2022

            16.15.2.1. By Extraction

            16.15.2.2. By Form

            16.15.2.3. By Application

    16.16. Australia

        16.16.1. Pricing Analysis

        16.16.2. Market Share Analysis, 2022

            16.16.2.1. By Extraction

            16.16.2.2. By Form

            16.16.2.3. By Application

    16.17. New Zealand

        16.17.1. Pricing Analysis

        16.17.2. Market Share Analysis, 2022

            16.17.2.1. By Extraction

            16.17.2.2. By Form

            16.17.2.3. By Application

    16.18. China

        16.18.1. Pricing Analysis

        16.18.2. Market Share Analysis, 2022

            16.18.2.1. By Extraction

            16.18.2.2. By Form

            16.18.2.3. By Application

    16.19. Japan

        16.19.1. Pricing Analysis

        16.19.2. Market Share Analysis, 2022

            16.19.2.1. By Extraction

            16.19.2.2. By Form

            16.19.2.3. By Application

    16.20. South Korea

        16.20.1. Pricing Analysis

        16.20.2. Market Share Analysis, 2022

            16.20.2.1. By Extraction

            16.20.2.2. By Form

            16.20.2.3. By Application

    16.21. GCC Countries

        16.21.1. Pricing Analysis

        16.21.2. Market Share Analysis, 2022

            16.21.2.1. By Extraction

            16.21.2.2. By Form

            16.21.2.3. By Application

    16.22. South Africa

        16.22.1. Pricing Analysis

        16.22.2. Market Share Analysis, 2022

            16.22.2.1. By Extraction

            16.22.2.2. By Form

            16.22.2.3. By Application

    16.23. Israel

        16.23.1. Pricing Analysis

        16.23.2. Market Share Analysis, 2022

            16.23.2.1. By Extraction

            16.23.2.2. By Form

            16.23.2.3. By Application

17. Market Structure Analysis

    17.1. Competition Dashboard

    17.2. Competition Benchmarking

    17.3. Market Share Analysis of Top Players

        17.3.1. By Regional

        17.3.2. By Extraction

        17.3.3. By Form

        17.3.4. By Application

18. Competition Analysis

    18.1. Competition Deep Dive

        18.1.1. Synergy Flavors

            18.1.1.1. Overview

            18.1.1.2. Product Portfolio

            18.1.1.3. Profitability by Market Segments

            18.1.1.4. Sales Footprint

            18.1.1.5. Strategy Overview

                18.1.1.5.1. Marketing Strategy

                18.1.1.5.2. Product Strategy

                18.1.1.5.3. Channel Strategy

        18.1.2. Bell Flavors & Fragrances GmbH

            18.1.2.1. Overview

            18.1.2.2. Product Portfolio

            18.1.2.3. Profitability by Market Segments

            18.1.2.4. Sales Footprint

            18.1.2.5. Strategy Overview

                18.1.2.5.1. Marketing Strategy

                18.1.2.5.2. Product Strategy

                18.1.2.5.3. Channel Strategy

        18.1.3. Parker Flavors, Inc.

            18.1.3.1. Overview

            18.1.3.2. Product Portfolio

            18.1.3.3. Profitability by Market Segments

            18.1.3.4. Sales Footprint

            18.1.3.5. Strategy Overview

                18.1.3.5.1. Marketing Strategy

                18.1.3.5.2. Product Strategy

                18.1.3.5.3. Channel Strategy

        18.1.4. Archer Daniels Midland Company

            18.1.4.1. Overview

            18.1.4.2. Product Portfolio

            18.1.4.3. Profitability by Market Segments

            18.1.4.4. Sales Footprint

            18.1.4.5. Strategy Overview

                18.1.4.5.1. Marketing Strategy

                18.1.4.5.2. Product Strategy

                18.1.4.5.3. Channel Strategy

        18.1.5. Kanegrade Limited

            18.1.5.1. Overview

            18.1.5.2. Product Portfolio

            18.1.5.3. Profitability by Market Segments

            18.1.5.4. Sales Footprint

            18.1.5.5. Strategy Overview

                18.1.5.5.1. Marketing Strategy

                18.1.5.5.2. Product Strategy

                18.1.5.5.3. Channel Strategy

        18.1.6. Carrubba Incorporated

            18.1.6.1. Overview

            18.1.6.2. Product Portfolio

            18.1.6.3. Profitability by Market Segments

            18.1.6.4. Sales Footprint

            18.1.6.5. Strategy Overview

                18.1.6.5.1. Marketing Strategy

                18.1.6.5.2. Product Strategy

                18.1.6.5.3. Channel Strategy

        18.1.7. Sapphire Flavors & Fragrances

            18.1.7.1. Overview

            18.1.7.2. Product Portfolio

            18.1.7.3. Profitability by Market Segments

            18.1.7.4. Sales Footprint

            18.1.7.5. Strategy Overview

                18.1.7.5.1. Marketing Strategy

                18.1.7.5.2. Product Strategy

                18.1.7.5.3. Channel Strategy

        18.1.8. Givaudan

            18.1.8.1. Overview

            18.1.8.2. Product Portfolio

            18.1.8.3. Profitability by Market Segments

            18.1.8.4. Sales Footprint

            18.1.8.5. Strategy Overview

                18.1.8.5.1. Marketing Strategy

                18.1.8.5.2. Product Strategy

                18.1.8.5.3. Channel Strategy

        18.1.9. Firmenich SA

            18.1.9.1. Overview

            18.1.9.2. Product Portfolio

            18.1.9.3. Profitability by Market Segments

            18.1.9.4. Sales Footprint

            18.1.9.5. Strategy Overview

                18.1.9.5.1. Marketing Strategy

                18.1.9.5.2. Product Strategy

                18.1.9.5.3. Channel Strategy

        18.1.10. International Flavors & Fragrances Inc. (IFF

            18.1.10.1. Overview

            18.1.10.2. Product Portfolio

            18.1.10.3. Profitability by Market Segments

            18.1.10.4. Sales Footprint

            18.1.10.5. Strategy Overview

                18.1.10.5.1. Marketing Strategy

                18.1.10.5.2. Product Strategy

                18.1.10.5.3. Channel Strategy

19. Assumptions & Acronyms Used

20. Research Methodology

Don't pay for what you don't need

Customize your report by selecting specific countries or regions and save 30%!

List of Tables

Table 1: Global Market Value (US$ Million) Forecast by Region, 2018 to 2033

Table 2: Global Market Volume (Tons) Forecast by Region, 2018 to 2033

Table 3: Global Market Value (US$ Million) Forecast by Extraction, 2018 to 2033

Table 4: Global Market Volume (Tons) Forecast by Extraction, 2018 to 2033

Table 5: Global Market Value (US$ Million) Forecast by Form, 2018 to 2033

Table 6: Global Market Volume (Tons) Forecast by Form, 2018 to 2033

Table 7: Global Market Value (US$ Million) Forecast by Application, 2018 to 2033

Table 8: Global Market Volume (Tons) Forecast by Application, 2018 to 2033

Table 9: North America Market Value (US$ Million) Forecast by Country, 2018 to 2033

Table 10: North America Market Volume (Tons) Forecast by Country, 2018 to 2033

Table 11: North America Market Value (US$ Million) Forecast by Extraction, 2018 to 2033

Table 12: North America Market Volume (Tons) Forecast by Extraction, 2018 to 2033

Table 13: North America Market Value (US$ Million) Forecast by Form, 2018 to 2033

Table 14: North America Market Volume (Tons) Forecast by Form, 2018 to 2033

Table 15: North America Market Value (US$ Million) Forecast by Application, 2018 to 2033

Table 16: North America Market Volume (Tons) Forecast by Application, 2018 to 2033

Table 17: Latin America Market Value (US$ Million) Forecast by Country, 2018 to 2033

Table 18: Latin America Market Volume (Tons) Forecast by Country, 2018 to 2033

Table 19: Latin America Market Value (US$ Million) Forecast by Extraction, 2018 to 2033

Table 20: Latin America Market Volume (Tons) Forecast by Extraction, 2018 to 2033

Table 21: Latin America Market Value (US$ Million) Forecast by Form, 2018 to 2033

Table 22: Latin America Market Volume (Tons) Forecast by Form, 2018 to 2033

Table 23: Latin America Market Value (US$ Million) Forecast by Application, 2018 to 2033

Table 24: Latin America Market Volume (Tons) Forecast by Application, 2018 to 2033

Table 25: Western Europe Market Value (US$ Million) Forecast by Country, 2018 to 2033

Table 26: Western Europe Market Volume (Tons) Forecast by Country, 2018 to 2033

Table 27: Western Europe Market Value (US$ Million) Forecast by Extraction, 2018 to 2033

Table 28: Western Europe Market Volume (Tons) Forecast by Extraction, 2018 to 2033

Table 29: Western Europe Market Value (US$ Million) Forecast by Form, 2018 to 2033

Table 30: Western Europe Market Volume (Tons) Forecast by Form, 2018 to 2033

Table 31: Western Europe Market Value (US$ Million) Forecast by Application, 2018 to 2033

Table 32: Western Europe Market Volume (Tons) Forecast by Application, 2018 to 2033

Table 33: Eastern Europe Market Value (US$ Million) Forecast by Country, 2018 to 2033

Table 34: Eastern Europe Market Volume (Tons) Forecast by Country, 2018 to 2033

Table 35: Eastern Europe Market Value (US$ Million) Forecast by Extraction, 2018 to 2033

Table 36: Eastern Europe Market Volume (Tons) Forecast by Extraction, 2018 to 2033

Table 37: Eastern Europe Market Value (US$ Million) Forecast by Form, 2018 to 2033

Table 38: Eastern Europe Market Volume (Tons) Forecast by Form, 2018 to 2033

Table 39: Eastern Europe Market Value (US$ Million) Forecast by Application, 2018 to 2033

Table 40: Eastern Europe Market Volume (Tons) Forecast by Application, 2018 to 2033

Table 41: South Asia and Pacific Market Value (US$ Million) Forecast by Country, 2018 to 2033

Table 42: South Asia and Pacific Market Volume (Tons) Forecast by Country, 2018 to 2033

Table 43: South Asia and Pacific Market Value (US$ Million) Forecast by Extraction, 2018 to 2033

Table 44: South Asia and Pacific Market Volume (Tons) Forecast by Extraction, 2018 to 2033

Table 45: South Asia and Pacific Market Value (US$ Million) Forecast by Form, 2018 to 2033

Table 46: South Asia and Pacific Market Volume (Tons) Forecast by Form, 2018 to 2033

Table 47: South Asia and Pacific Market Value (US$ Million) Forecast by Application, 2018 to 2033

Table 48: South Asia and Pacific Market Volume (Tons) Forecast by Application, 2018 to 2033

Table 49: East Asia Market Value (US$ Million) Forecast by Country, 2018 to 2033

Table 50: East Asia Market Volume (Tons) Forecast by Country, 2018 to 2033

Table 51: East Asia Market Value (US$ Million) Forecast by Extraction, 2018 to 2033

Table 52: East Asia Market Volume (Tons) Forecast by Extraction, 2018 to 2033

Table 53: East Asia Market Value (US$ Million) Forecast by Form, 2018 to 2033

Table 54: East Asia Market Volume (Tons) Forecast by Form, 2018 to 2033

Table 55: East Asia Market Value (US$ Million) Forecast by Application, 2018 to 2033

Table 56: East Asia Market Volume (Tons) Forecast by Application, 2018 to 2033

Table 57: Middle East and Africa Market Value (US$ Million) Forecast by Country, 2018 to 2033

Table 58: Middle East and Africa Market Volume (Tons) Forecast by Country, 2018 to 2033

Table 59: Middle East and Africa Market Value (US$ Million) Forecast by Extraction, 2018 to 2033

Table 60: Middle East and Africa Market Volume (Tons) Forecast by Extraction, 2018 to 2033

Table 61: Middle East and Africa Market Value (US$ Million) Forecast by Form, 2018 to 2033

Table 62: Middle East and Africa Market Volume (Tons) Forecast by Form, 2018 to 2033

Table 63: Middle East and Africa Market Value (US$ Million) Forecast by Application, 2018 to 2033

Table 64: Middle East and Africa Market Volume (Tons) Forecast by Application, 2018 to 2033
Nandini Roy Choudhury

Principal Consultant

Talk to Analyst

Find your sweet spots for generating winning opportunities in this market.

List of Charts

Figure 1: Global Market Value (US$ Million) by Extraction, 2023 to 2033

Figure 2: Global Market Value (US$ Million) by Form, 2023 to 2033

Figure 3: Global Market Value (US$ Million) by Application, 2023 to 2033

Figure 4: Global Market Value (US$ Million) by Region, 2023 to 2033

Figure 5: Global Market Value (US$ Million) Analysis by Region, 2018 to 2033

Figure 6: Global Market Volume (Tons) Analysis by Region, 2018 to 2033

Figure 7: Global Market Value Share (%) and BPS Analysis by Region, 2023 to 2033

Figure 8: Global Market Y-o-Y Growth (%) Projections by Region, 2023 to 2033

Figure 9: Global Market Value (US$ Million) Analysis by Extraction, 2018 to 2033

Figure 10: Global Market Volume (Tons) Analysis by Extraction, 2018 to 2033

Figure 11: Global Market Value Share (%) and BPS Analysis by Extraction, 2023 to 2033

Figure 12: Global Market Y-o-Y Growth (%) Projections by Extraction, 2023 to 2033

Figure 13: Global Market Value (US$ Million) Analysis by Form, 2018 to 2033

Figure 14: Global Market Volume (Tons) Analysis by Form, 2018 to 2033

Figure 15: Global Market Value Share (%) and BPS Analysis by Form, 2023 to 2033

Figure 16: Global Market Y-o-Y Growth (%) Projections by Form, 2023 to 2033

Figure 17: Global Market Value (US$ Million) Analysis by Application, 2018 to 2033

Figure 18: Global Market Volume (Tons) Analysis by Application, 2018 to 2033

Figure 19: Global Market Value Share (%) and BPS Analysis by Application, 2023 to 2033

Figure 20: Global Market Y-o-Y Growth (%) Projections by Application, 2023 to 2033

Figure 21: Global Market Attractiveness by Extraction, 2023 to 2033

Figure 22: Global Market Attractiveness by Form, 2023 to 2033

Figure 23: Global Market Attractiveness by Application, 2023 to 2033

Figure 24: Global Market Attractiveness by Region, 2023 to 2033

Figure 25: North America Market Value (US$ Million) by Extraction, 2023 to 2033

Figure 26: North America Market Value (US$ Million) by Form, 2023 to 2033

Figure 27: North America Market Value (US$ Million) by Application, 2023 to 2033

Figure 28: North America Market Value (US$ Million) by Country, 2023 to 2033

Figure 29: North America Market Value (US$ Million) Analysis by Country, 2018 to 2033

Figure 30: North America Market Volume (Tons) Analysis by Country, 2018 to 2033

Figure 31: North America Market Value Share (%) and BPS Analysis by Country, 2023 to 2033

Figure 32: North America Market Y-o-Y Growth (%) Projections by Country, 2023 to 2033

Figure 33: North America Market Value (US$ Million) Analysis by Extraction, 2018 to 2033

Figure 34: North America Market Volume (Tons) Analysis by Extraction, 2018 to 2033

Figure 35: North America Market Value Share (%) and BPS Analysis by Extraction, 2023 to 2033

Figure 36: North America Market Y-o-Y Growth (%) Projections by Extraction, 2023 to 2033

Figure 37: North America Market Value (US$ Million) Analysis by Form, 2018 to 2033

Figure 38: North America Market Volume (Tons) Analysis by Form, 2018 to 2033

Figure 39: North America Market Value Share (%) and BPS Analysis by Form, 2023 to 2033

Figure 40: North America Market Y-o-Y Growth (%) Projections by Form, 2023 to 2033

Figure 41: North America Market Value (US$ Million) Analysis by Application, 2018 to 2033

Figure 42: North America Market Volume (Tons) Analysis by Application, 2018 to 2033

Figure 43: North America Market Value Share (%) and BPS Analysis by Application, 2023 to 2033

Figure 44: North America Market Y-o-Y Growth (%) Projections by Application, 2023 to 2033

Figure 45: North America Market Attractiveness by Extraction, 2023 to 2033

Figure 46: North America Market Attractiveness by Form, 2023 to 2033

Figure 47: North America Market Attractiveness by Application, 2023 to 2033

Figure 48: North America Market Attractiveness by Country, 2023 to 2033

Figure 49: Latin America Market Value (US$ Million) by Extraction, 2023 to 2033

Figure 50: Latin America Market Value (US$ Million) by Form, 2023 to 2033

Figure 51: Latin America Market Value (US$ Million) by Application, 2023 to 2033

Figure 52: Latin America Market Value (US$ Million) by Country, 2023 to 2033

Figure 53: Latin America Market Value (US$ Million) Analysis by Country, 2018 to 2033

Figure 54: Latin America Market Volume (Tons) Analysis by Country, 2018 to 2033

Figure 55: Latin America Market Value Share (%) and BPS Analysis by Country, 2023 to 2033

Figure 56: Latin America Market Y-o-Y Growth (%) Projections by Country, 2023 to 2033

Figure 57: Latin America Market Value (US$ Million) Analysis by Extraction, 2018 to 2033

Figure 58: Latin America Market Volume (Tons) Analysis by Extraction, 2018 to 2033

Figure 59: Latin America Market Value Share (%) and BPS Analysis by Extraction, 2023 to 2033

Figure 60: Latin America Market Y-o-Y Growth (%) Projections by Extraction, 2023 to 2033

Figure 61: Latin America Market Value (US$ Million) Analysis by Form, 2018 to 2033

Figure 62: Latin America Market Volume (Tons) Analysis by Form, 2018 to 2033

Figure 63: Latin America Market Value Share (%) and BPS Analysis by Form, 2023 to 2033

Figure 64: Latin America Market Y-o-Y Growth (%) Projections by Form, 2023 to 2033

Figure 65: Latin America Market Value (US$ Million) Analysis by Application, 2018 to 2033

Figure 66: Latin America Market Volume (Tons) Analysis by Application, 2018 to 2033

Figure 67: Latin America Market Value Share (%) and BPS Analysis by Application, 2023 to 2033

Figure 68: Latin America Market Y-o-Y Growth (%) Projections by Application, 2023 to 2033

Figure 69: Latin America Market Attractiveness by Extraction, 2023 to 2033

Figure 70: Latin America Market Attractiveness by Form, 2023 to 2033

Figure 71: Latin America Market Attractiveness by Application, 2023 to 2033

Figure 72: Latin America Market Attractiveness by Country, 2023 to 2033

Figure 73: Western Europe Market Value (US$ Million) by Extraction, 2023 to 2033

Figure 74: Western Europe Market Value (US$ Million) by Form, 2023 to 2033

Figure 75: Western Europe Market Value (US$ Million) by Application, 2023 to 2033

Figure 76: Western Europe Market Value (US$ Million) by Country, 2023 to 2033

Figure 77: Western Europe Market Value (US$ Million) Analysis by Country, 2018 to 2033

Figure 78: Western Europe Market Volume (Tons) Analysis by Country, 2018 to 2033

Figure 79: Western Europe Market Value Share (%) and BPS Analysis by Country, 2023 to 2033

Figure 80: Western Europe Market Y-o-Y Growth (%) Projections by Country, 2023 to 2033

Figure 81: Western Europe Market Value (US$ Million) Analysis by Extraction, 2018 to 2033

Figure 82: Western Europe Market Volume (Tons) Analysis by Extraction, 2018 to 2033

Figure 83: Western Europe Market Value Share (%) and BPS Analysis by Extraction, 2023 to 2033

Figure 84: Western Europe Market Y-o-Y Growth (%) Projections by Extraction, 2023 to 2033

Figure 85: Western Europe Market Value (US$ Million) Analysis by Form, 2018 to 2033

Figure 86: Western Europe Market Volume (Tons) Analysis by Form, 2018 to 2033

Figure 87: Western Europe Market Value Share (%) and BPS Analysis by Form, 2023 to 2033

Figure 88: Western Europe Market Y-o-Y Growth (%) Projections by Form, 2023 to 2033

Figure 89: Western Europe Market Value (US$ Million) Analysis by Application, 2018 to 2033

Figure 90: Western Europe Market Volume (Tons) Analysis by Application, 2018 to 2033

Figure 91: Western Europe Market Value Share (%) and BPS Analysis by Application, 2023 to 2033

Figure 92: Western Europe Market Y-o-Y Growth (%) Projections by Application, 2023 to 2033

Figure 93: Western Europe Market Attractiveness by Extraction, 2023 to 2033

Figure 94: Western Europe Market Attractiveness by Form, 2023 to 2033

Figure 95: Western Europe Market Attractiveness by Application, 2023 to 2033

Figure 96: Western Europe Market Attractiveness by Country, 2023 to 2033

Figure 97: Eastern Europe Market Value (US$ Million) by Extraction, 2023 to 2033

Figure 98: Eastern Europe Market Value (US$ Million) by Form, 2023 to 2033

Figure 99: Eastern Europe Market Value (US$ Million) by Application, 2023 to 2033

Figure 100: Eastern Europe Market Value (US$ Million) by Country, 2023 to 2033

Figure 101: Eastern Europe Market Value (US$ Million) Analysis by Country, 2018 to 2033

Figure 102: Eastern Europe Market Volume (Tons) Analysis by Country, 2018 to 2033

Figure 103: Eastern Europe Market Value Share (%) and BPS Analysis by Country, 2023 to 2033

Figure 104: Eastern Europe Market Y-o-Y Growth (%) Projections by Country, 2023 to 2033

Figure 105: Eastern Europe Market Value (US$ Million) Analysis by Extraction, 2018 to 2033

Figure 106: Eastern Europe Market Volume (Tons) Analysis by Extraction, 2018 to 2033

Figure 107: Eastern Europe Market Value Share (%) and BPS Analysis by Extraction, 2023 to 2033

Figure 108: Eastern Europe Market Y-o-Y Growth (%) Projections by Extraction, 2023 to 2033

Figure 109: Eastern Europe Market Value (US$ Million) Analysis by Form, 2018 to 2033

Figure 110: Eastern Europe Market Volume (Tons) Analysis by Form, 2018 to 2033

Figure 111: Eastern Europe Market Value Share (%) and BPS Analysis by Form, 2023 to 2033

Figure 112: Eastern Europe Market Y-o-Y Growth (%) Projections by Form, 2023 to 2033

Figure 113: Eastern Europe Market Value (US$ Million) Analysis by Application, 2018 to 2033

Figure 114: Eastern Europe Market Volume (Tons) Analysis by Application, 2018 to 2033

Figure 115: Eastern Europe Market Value Share (%) and BPS Analysis by Application, 2023 to 2033

Figure 116: Eastern Europe Market Y-o-Y Growth (%) Projections by Application, 2023 to 2033

Figure 117: Eastern Europe Market Attractiveness by Extraction, 2023 to 2033

Figure 118: Eastern Europe Market Attractiveness by Form, 2023 to 2033

Figure 119: Eastern Europe Market Attractiveness by Application, 2023 to 2033

Figure 120: Eastern Europe Market Attractiveness by Country, 2023 to 2033

Figure 121: South Asia and Pacific Market Value (US$ Million) by Extraction, 2023 to 2033

Figure 122: South Asia and Pacific Market Value (US$ Million) by Form, 2023 to 2033

Figure 123: South Asia and Pacific Market Value (US$ Million) by Application, 2023 to 2033

Figure 124: South Asia and Pacific Market Value (US$ Million) by Country, 2023 to 2033

Figure 125: South Asia and Pacific Market Value (US$ Million) Analysis by Country, 2018 to 2033

Figure 126: South Asia and Pacific Market Volume (Tons) Analysis by Country, 2018 to 2033

Figure 127: South Asia and Pacific Market Value Share (%) and BPS Analysis by Country, 2023 to 2033

Figure 128: South Asia and Pacific Market Y-o-Y Growth (%) Projections by Country, 2023 to 2033

Figure 129: South Asia and Pacific Market Value (US$ Million) Analysis by Extraction, 2018 to 2033

Figure 130: South Asia and Pacific Market Volume (Tons) Analysis by Extraction, 2018 to 2033

Figure 131: South Asia and Pacific Market Value Share (%) and BPS Analysis by Extraction, 2023 to 2033

Figure 132: South Asia and Pacific Market Y-o-Y Growth (%) Projections by Extraction, 2023 to 2033

Figure 133: South Asia and Pacific Market Value (US$ Million) Analysis by Form, 2018 to 2033

Figure 134: South Asia and Pacific Market Volume (Tons) Analysis by Form, 2018 to 2033

Figure 135: South Asia and Pacific Market Value Share (%) and BPS Analysis by Form, 2023 to 2033

Figure 136: South Asia and Pacific Market Y-o-Y Growth (%) Projections by Form, 2023 to 2033

Figure 137: South Asia and Pacific Market Value (US$ Million) Analysis by Application, 2018 to 2033

Figure 138: South Asia and Pacific Market Volume (Tons) Analysis by Application, 2018 to 2033

Figure 139: South Asia and Pacific Market Value Share (%) and BPS Analysis by Application, 2023 to 2033

Figure 140: South Asia and Pacific Market Y-o-Y Growth (%) Projections by Application, 2023 to 2033

Figure 141: South Asia and Pacific Market Attractiveness by Extraction, 2023 to 2033

Figure 142: South Asia and Pacific Market Attractiveness by Form, 2023 to 2033

Figure 143: South Asia and Pacific Market Attractiveness by Application, 2023 to 2033

Figure 144: South Asia and Pacific Market Attractiveness by Country, 2023 to 2033

Figure 145: East Asia Market Value (US$ Million) by Extraction, 2023 to 2033

Figure 146: East Asia Market Value (US$ Million) by Form, 2023 to 2033

Figure 147: East Asia Market Value (US$ Million) by Application, 2023 to 2033

Figure 148: East Asia Market Value (US$ Million) by Country, 2023 to 2033

Figure 149: East Asia Market Value (US$ Million) Analysis by Country, 2018 to 2033

Figure 150: East Asia Market Volume (Tons) Analysis by Country, 2018 to 2033

Figure 151: East Asia Market Value Share (%) and BPS Analysis by Country, 2023 to 2033

Figure 152: East Asia Market Y-o-Y Growth (%) Projections by Country, 2023 to 2033

Figure 153: East Asia Market Value (US$ Million) Analysis by Extraction, 2018 to 2033

Figure 154: East Asia Market Volume (Tons) Analysis by Extraction, 2018 to 2033

Figure 155: East Asia Market Value Share (%) and BPS Analysis by Extraction, 2023 to 2033

Figure 156: East Asia Market Y-o-Y Growth (%) Projections by Extraction, 2023 to 2033

Figure 157: East Asia Market Value (US$ Million) Analysis by Form, 2018 to 2033

Figure 158: East Asia Market Volume (Tons) Analysis by Form, 2018 to 2033

Figure 159: East Asia Market Value Share (%) and BPS Analysis by Form, 2023 to 2033

Figure 160: East Asia Market Y-o-Y Growth (%) Projections by Form, 2023 to 2033

Figure 161: East Asia Market Value (US$ Million) Analysis by Application, 2018 to 2033

Figure 162: East Asia Market Volume (Tons) Analysis by Application, 2018 to 2033

Figure 163: East Asia Market Value Share (%) and BPS Analysis by Application, 2023 to 2033

Figure 164: East Asia Market Y-o-Y Growth (%) Projections by Application, 2023 to 2033

Figure 165: East Asia Market Attractiveness by Extraction, 2023 to 2033

Figure 166: East Asia Market Attractiveness by Form, 2023 to 2033

Figure 167: East Asia Market Attractiveness by Application, 2023 to 2033

Figure 168: East Asia Market Attractiveness by Country, 2023 to 2033

Figure 169: Middle East and Africa Market Value (US$ Million) by Extraction, 2023 to 2033

Figure 170: Middle East and Africa Market Value (US$ Million) by Form, 2023 to 2033

Figure 171: Middle East and Africa Market Value (US$ Million) by Application, 2023 to 2033

Figure 172: Middle East and Africa Market Value (US$ Million) by Country, 2023 to 2033

Figure 173: Middle East and Africa Market Value (US$ Million) Analysis by Country, 2018 to 2033

Figure 174: Middle East and Africa Market Volume (Tons) Analysis by Country, 2018 to 2033

Figure 175: Middle East and Africa Market Value Share (%) and BPS Analysis by Country, 2023 to 2033

Figure 176: Middle East and Africa Market Y-o-Y Growth (%) Projections by Country, 2023 to 2033

Figure 177: Middle East and Africa Market Value (US$ Million) Analysis by Extraction, 2018 to 2033

Figure 178: Middle East and Africa Market Volume (Tons) Analysis by Extraction, 2018 to 2033

Figure 179: Middle East and Africa Market Value Share (%) and BPS Analysis by Extraction, 2023 to 2033

Figure 180: Middle East and Africa Market Y-o-Y Growth (%) Projections by Extraction, 2023 to 2033

Figure 181: Middle East and Africa Market Value (US$ Million) Analysis by Form, 2018 to 2033

Figure 182: Middle East and Africa Market Volume (Tons) Analysis by Form, 2018 to 2033

Figure 183: Middle East and Africa Market Value Share (%) and BPS Analysis by Form, 2023 to 2033

Figure 184: Middle East and Africa Market Y-o-Y Growth (%) Projections by Form, 2023 to 2033

Figure 185: Middle East and Africa Market Value (US$ Million) Analysis by Application, 2018 to 2033

Figure 186: Middle East and Africa Market Volume (Tons) Analysis by Application, 2018 to 2033

Figure 187: Middle East and Africa Market Value Share (%) and BPS Analysis by Application, 2023 to 2033

Figure 188: Middle East and Africa Market Y-o-Y Growth (%) Projections by Application, 2023 to 2033

Figure 189: Middle East and Africa Market Attractiveness by Extraction, 2023 to 2033

Figure 190: Middle East and Africa Market Attractiveness by Form, 2023 to 2033

Figure 191: Middle East and Africa Market Attractiveness by Application, 2023 to 2033

Figure 192: Middle East and Africa Market Attractiveness by Country, 2023 to 2033

Recommendations

Food and Beverage

Flavored Milk Market

Published : February 2023

Food and Beverage

Flavor and Flavor Enhancers Market

Published : September 2022

Explore Food and Beverage Insights

View Reports