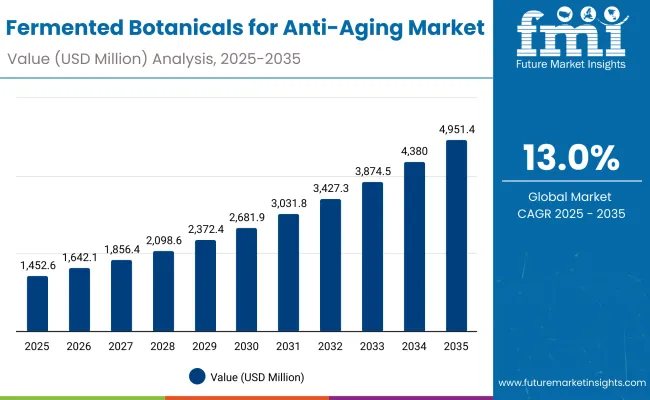
The Fermented Botanicals for Anti-Aging Market is expected to record a valuation of USD 1,452.6 million in 2025 and USD 4,951.4 million in 2035, with an increase of USD 3,498.8 million, which equals a growth of 193% over the decade. The overall expansion represents a CAGR of 13.0% and a 2X increase in market size.
Fermented Botanicals for Anti-Aging Market Key Takeaways
| Metric | Value |
|---|---|
| Fermented Botanicals for Anti-Aging Market Estimated Value in (2025E) | USD 1,452.6 million |
| Fermented Botanicals for Anti-Aging Market Forecast Value in (2035F) | USD 4,951.4 million |
| Forecast CAGR (2025 to 2035) | 13.0% |
During the first five-year period from 2025 to 2030, the market increases from USD 1,452.6 million to USD 2,681.9 million, adding USD 1,229.3 million, which accounts for 35.1% of the total decade growth. This phase records steady adoption in automotive prototyping, aerospace design, and healthcare imaging, driven by the need for precision. Short-range scanners dominate this period as they cater to over 60% of industrial applications requiring micron-level accuracy.
The second half from 2030 to 2035 contributes USD 2,269.5 million, equal to 64.9% of total growth, as the market jumps from USD 2,681.9 million to USD 4,951.4 million. This acceleration is powered by widespread deployment of digital twins, AI-based inspection systems, and robotics-driven scanning in smart factories. Long-range and mid-range scanners together capture a larger share above 50% by the end of the decade. Software-led analytics and cloud platforms add recurring revenue, increasing the software share beyond 40% in total value.
From 2020 to 2024, the Fermented Botanicals for Anti-Aging Market grew from USD 787.4 million to USD 1,308.2 million, driven by ingredient innovation and firming/elasticity-focused formulations. During this period, the competitive landscape was dominated by Korean and Japanese skincare brands, which controlled nearly 85% of regional revenues. Leaders such as Amorepacific, Missha, and SK-II focused on anti-aging serums and essences leveraging fermented botanicals for enhanced efficacy. Competitive differentiation relied on brand credibility, skin compatibility, and science-backed claims, while clinical validation played a limited role.
Demand for fermented anti-aging formulations is projected to expand to USD 1,452.6 million in 2025, and the revenue mix will shift as clean-label, vegan, and fermentation-derived claims grow to over 55% share. Traditional beauty giants now face rising competition from premium indie brands and biotech-driven cosmetic labs offering clinical-grade fermentation platforms, AI-formulated skincare, and adaptive microbiome repair solutions. Competitive advantage is moving away from legacy brand power to formulation transparency, claim credibility, and cross-channel personalization strategies.
Fermentation not only preserves botanical actives but amplifies their bioavailability by breaking down larger molecules into skin-penetrable micro-compounds. This transformation boosts the potency of natural anti-aging actives like polyphenols, flavonoids, and peptides. Unlike traditional formulations that rely on synthetic emulsifiers or encapsulation, fermentation allows for deeper dermal absorption and enhanced cellular communication, making it a preferred choice for brands seeking clean-label performance without compromising on clinical-grade results.
The rise of microbiome-aware skincare has propelled fermented botanicals into dermatological and professional skin care channels. These ingredients support skin flora balance, reduce sensitivity, and enable skin barrier repair, making them ideal for post-procedure recovery and chronic conditions like eczema or rosacea. Dermatology clinics and premium spas are increasingly prescribing fermented serums and creams for both preventive aging and reparative treatments, positioning the segment as both functionally advanced and therapeutically relevant.
The market is segmented by function, product type, channel, claim, and region. Functional classifications include anti-aging & wrinkle reduction, firming & elasticity, brightening, and hydration & barrier repair, reflecting targeted outcomes prioritized in consumer routines. Product types span serums, creams/lotions, ampoules, and masks, with serums commanding strong traction due to their high concentration and clinical efficacy.
In terms of distribution channel, segmentation covers e-commerce, specialty beauty retail, pharmacies, and premium spas & clinics, each representing different trust and convenience vectors. Claims include fermentation-derived, vegan, natural/organic, clean-label, and clinical-grade, emphasizing the market’s alignment with sustainability and safety expectations.
Regionally, the scope includes key countries such as China, USA, India, UK, Germany, and Japan, along with aggregated analysis for Europe. Growth varies by maturity, regulatory openness, and local innovation pipelines, with Asia-Pacific leading due to brand heritage, ingredient sourcing, and fermentation R&D strength.
| Claim | Value Share % 2025 |
|---|---|
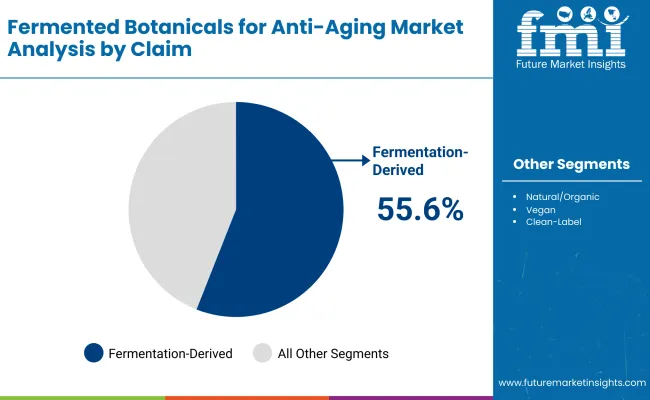
| Fermentation-derived | 55.6% |
| Others | 44.4% |
The fermentation-derived segment is projected to account for 55.6% of the Fermented Botanicals for Anti-Aging Market revenue in 2025, reinforcing its lead as the most trusted claim among ingredient-conscious consumers. The dominance of this segment stems from the increased awareness around bio-enhancement, wherein fermentation transforms botanical extracts into more potent, absorbable, and skin-compatible actives. These enhanced compounds offer superior anti-aging performance without relying on synthetic stabilizers, aligning well with clean beauty principles.
This claim’s appeal also lies in its microbiome-friendly positioning, which has resonated strongly with dermatology clinics and cosmeceutical brands looking for ingredients that support barrier health and post-treatment recovery. As major players formulate new products highlighting fermentation on-pack, the segment is poised to remain a central narrative in both premium and clinical skincare marketing across regions.
| Function | Value Share % 2025 |
|---|---|
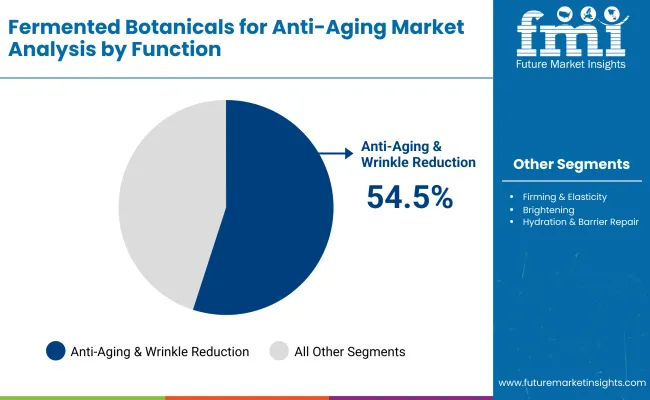
| Anti-aging & wrinkle reduction | 54.5% |
| Others | 45.5% |
The anti-aging & wrinkle reduction segment is projected to lead the Fermented Botanicals for Anti-Aging Market with 54.5% share in 2025. This dominance is driven by the rising preference for efficacy-backed natural formulations that specifically target signs of aging such as fine lines, elasticity loss, and collagen degradation. Fermented botanicals enhance the bioavailability of active compounds, offering deeper penetration and faster skin renewal effectskey benefits for anti-aging performance claims.
This segment’s strength is also fueled by the growing demand for preventive skincare among younger demographics and the expansion of anti-aging SKUs into mainstream and masstige brands. Clinical studies supporting the performance of fermented ingredients in wrinkle reduction have further legitimized their use in dermatology-backed formulations. As product innovations continue to center around skin longevity and cell regeneration, this function will remain at the forefront of category growth.
| Product Type | Value Share % 2025 |
|---|---|
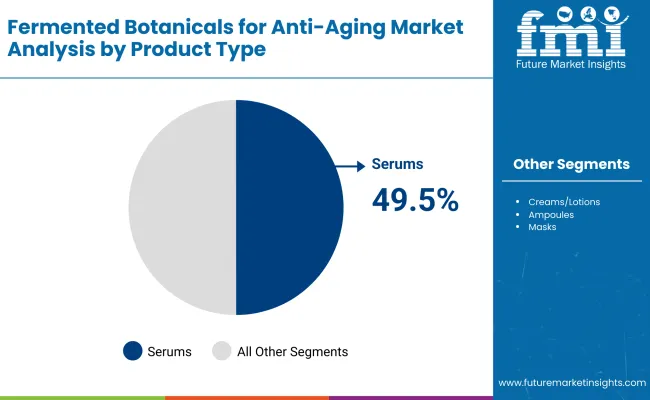
| Serums | 49.5% |
| Others | 50.5% |
The serums segment is projected to dominate the Fermented Botanicals for Anti-Aging Market in 2025, accounting for 49.5% of the global value share. Serums are favored for their lightweight texture and high concentration of active ingredients, making them ideal carriers for fermented botanical extracts that target aging at a cellular level.
Their ability to deliver potent anti-aging benefits with fast absorption and deep skin penetration aligns with consumer demand for effective, non-greasy formulations. Fermented serums are especially popular in nighttime skincare routines and among consumers seeking functional performance with visible results. The clean-label trend and rising demand for minimalistic beauty regimes are further reinforcing the serum format as the preferred delivery system for advanced anti-aging solutions.
Consumer Shift Toward Biocompatible and Potent Natural Ingredients
Growing consumer awareness around ingredient safety and skin compatibility is driving the adoption of fermented botanicals in anti-aging products. Unlike synthetic actives, fermented extracts improve bioavailability, allowing for deeper skin penetration and enhanced efficacy with minimal irritation.
This aligns with the global clean beauty movement, where consumers prefer plant-derived, eco-conscious formulations. Additionally, fermentation unlocks new phytochemical properties in botanical ingredients, enhancing antioxidant, anti-inflammatory, and barrier-repair functions. Brands are leveraging this functionality to replace traditional anti-aging actives in both clinical and luxury skincare lines.
Rise of East Asian Beauty Innovation and Ingredient Export
K-beauty and J-beauty brands have positioned fermented botanicals at the forefront of global skincare innovation, sparking international demand for ingredient-led anti-aging products. This regional influence has expanded into Western markets via cross-border e-commerce and global product launches.
Leading Asian manufacturers are exporting fermentation know-how and patented botanical extracts to USA and European brands. As Western consumers embrace the "skin-first" philosophy and multi-step routines inspired by Asian beauty, fermented formulations are gaining traction not just for face care, but also in body care and scalp wellness segments.
High Production Costs and Ingredient Stability Challenges
Fermentation of botanical extracts is a resource-intensive process involving precise microbial cultures, controlled bioreactor conditions, and post-fermentation stabilization. This adds to the production cost compared to conventional botanical ingredients. Furthermore, ensuring long-term stability and compatibility of fermented actives with emulsifiers, preservatives, and other formulation elements poses R&D challenges.
Brands aiming to market clean-label, synthetic-free formulas often face difficulty maintaining product shelf life and efficacy. These complexities limit mass-market affordability and slow down scalability for indie and mid-tier skincare companies entering the anti-aging space.
Hybrid Formulations Combining Fermented Botanicals with Biotech Actives
A notable trend in the Fermented Botanicals for Anti-Aging Market is the emergence of hybrid formulations blending time-tested botanicals with biotech-derived actives such as peptides, probiotics, and encapsulated retinoids. These combinations aim to deliver multifunctional performancesuch as brightening, wrinkle reduction, and microbiome supportin a single product.
This trend caters to consumer demand for simplified yet potent skincare routines. Brands are also using fermentation to increase the stability of sensitive ingredients like vitamin C or to reduce the irritation potential of traditionally harsh compounds, creating next-generation anti-aging formulations.
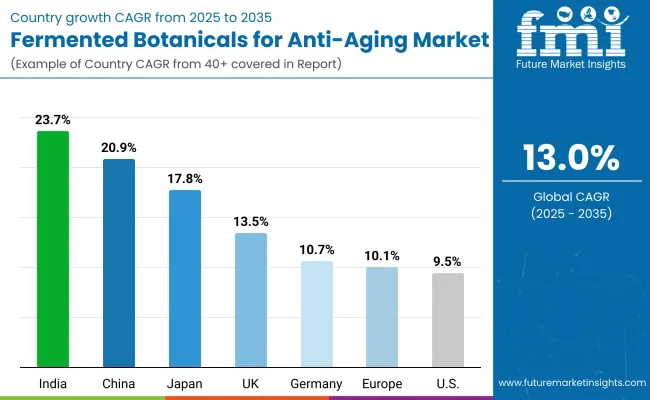
| Country | Estimated CAGR (2025 to 2035) |
|---|---|
| China | 20.9% |
| USA | 9.5% |
| India | 23.7% |
| UK | 13.5% |
| Germany | 10.7% |
| Japan | 17.8% |
| Europe | 10.1% |
The global Fermented Botanicals for Anti-Aging Market exhibits strong growth potential across diverse geographies, with Asia-Pacific countries taking the lead due to cultural alignment with fermented ingredients, rising skincare expenditure, and dominance of innovation-driven K-beauty and J-beauty ecosystems. India, with the highest CAGR of 23.7%, is witnessing an explosion in clean beauty demand from Gen Z and millennial consumers. Domestic brands are increasingly incorporating Ayurvedic botanicals enhanced through fermentation, creating hybrid formats that resonate with local tradition and global efficacy expectations.
China follows closely with a CAGR of 20.9%, driven by wellness-focused premium skincare consumption and a thriving direct-to-consumer ecosystem via Tmall, Douyin, and Xiaohongshu. Domestic giants are heavily investing in biotech-based fermented actives to serve both local and export markets.
Japan’s growth at 17.8% is fueled by long-standing expertise in fermentation sciences, with heritage brands integrating new biofermentation techniques into anti-aging and sensitive-skin formulations. In Europe, Germany (10.7%), UK (13.5%), and the wider European region (10.1%) show steady expansion supported by growing clean-label demand and consumer preference for clinical-grade performance. Regulatory pressure around ingredient transparency and sustainability further boosts the appeal of naturally derived, microbiome-friendly formulations.
The United States, while growing at a relatively moderate 9.5%, remains a high-value market where innovation is focused on clinical positioning, influencer-driven marketing, and skin microbiome compatibility. Adoption of fermented botanicals is rising in dermatologist-backed brands and premium hybrid serums, especially those targeting menopausal and mature skin demographics.
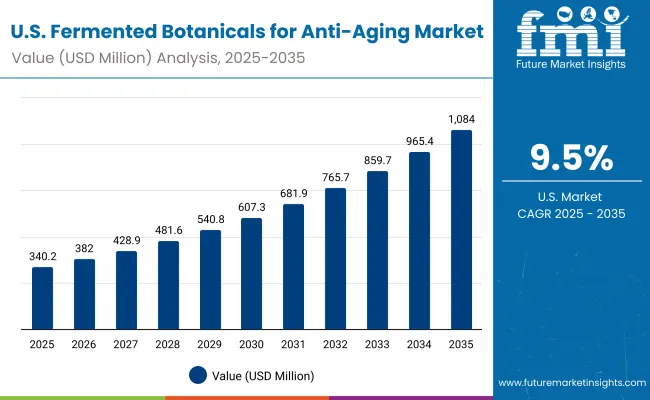
| Year | USA Fermented Botanicals for Anti-Aging Market (USD Million) |
|---|---|
| 2025 | 340.24 |
| 2026 | 382.04 |
| 2027 | 428.98 |
| 2028 | 481.69 |
| 2029 | 540.87 |
| 2030 | 607.32 |
| 2031 | 681.93 |
| 2032 | 765.71 |
| 2033 | 859.79 |
| 2034 | 965.42 |
| 2035 | 1,084.03 |
The Fermented Botanicals for Anti-Aging Market in the United States is projected to grow steadily, reaching a value of USD 1,084.03 million by 2035, up from USD 340.24 million in 2025. This growth reflects broad-based adoption across clinical beauty, premium skincare, and wellness formulations. USA consumers are increasingly prioritizing microbiome-safe and bioactive-rich products, driving demand for serums and creams containing fermentation-derived botanicals.
A key growth driver is the clinical positioning of fermented ingredients, especially those targeting mature and sensitive skin. Dermatology clinics and pharmacies are incorporating these formulas into post-treatment routines for barrier repair and elasticity. Direct-to-consumer brands are also driving awareness through targeted marketing and influencer-led product education campaigns. The expanding e-commerce landscape, supported by Amazon Beauty, Ulta, and premium clean-label platforms, is accelerating both reach and repeat purchases.
Additionally, the rise in menopausal skincare ranges has opened new application areas, with fermented actives now being used for hormonal skin balance. The USA market is also seeing a shift toward clean-label and vegan-certified positioning, aligning with the values of eco-conscious consumers.
The Fermented Botanicals for Anti-Aging Market in the United Kingdom is forecast to grow steadily over the next decade, driven by the convergence of wellness innovation, natural formulation demand, and premium consumer preferences. Brands in the UK are rapidly expanding product lines that incorporate fermentation-derived botanicals for anti-aging, brightening, and hydration. These ingredients are favored for their enhanced bioavailability, skin barrier support, and compatibility with sensitive skin.
Increased consumer awareness around microbiome-friendly skincare, along with the popularity of clean-label and vegan beauty, has pushed both mainstream and indie brands to invest in R&D collaborations with fermentation labs. Additionally, clinical beauty retailers and dermatology-led skincare chains are creating demand for evidence-backed, functional products with visible anti-aging effects.
The UK's regulatory alignment with EU cosmetic safety laws and increasing transparency around ingredient sourcing also bolster adoption. The market benefits from a strong e-commerce infrastructure and active beauty-tech platforms promoting virtual consultations and customized skincare routines.
India is experiencing robust growth in the Fermented Botanicals for Anti-Aging Market, supported by a growing shift toward natural, science-backed skincare formulations. The rise of domestic clean beauty brands, greater urbanization in Tier-2 and Tier-3 cities, and increasing female consumer spending on premium skincare are driving strong demand for fermented botanicals with proven efficacy. These ingredients are highly favored for their bioactive potency, gentle action on sensitive skin, and compatibility with Ayurveda-inspired routines.
Local cosmetic formulators are partnering with biotech startups to introduce fermentation-derived actives into products like serums, ampoules, and creams, particularly targeting anti-aging and skin brightening benefits. India's digital beauty retail ecosystem (especially D2C platforms and online pharmacies) is enabling rapid product discovery and adoption. At the same time, influencer-led education campaigns are boosting awareness of microbiome-supportive skincare and the superior absorption of fermented ingredients.
The regulatory ecosystem is also maturing, with BIS standards and labeling guidelines increasingly focused on ingredient transparency, which supports broader market credibility.
The Fermented Botanicals for Anti-Aging Market in China is forecast to grow at the fastest pace among major global economies, driven by a convergence of biotechnology innovation, heritage ingredient revival, and premiumization trends in skincare. Fermented botanical ingredients are increasingly viewed as a next-generation solution combining Traditional Chinese Medicine (TCM) wisdom with modern dermatology, especially for anti-aging, skin firming, and barrier repair.
Domestic beauty giants and indie brands are formulating with fermented ginseng, mushroom extracts, and probiotics, leveraging consumer demand for natural yet potent products. Government-backed cosmeceutical innovation clusters in cities like Guangzhou and Hangzhou are fostering collaborations between biotech labs and skincare companies. In addition, cross-border beauty platforms such as Tmall Global and JD Worldwide are expanding the reach of fermented skincare brands to younger consumers across lower-tier cities.
The rise of clinical skincare chains and dermocosmetic stores in urban hubs is further supporting growth, as are Chinese consumers' increasing familiarity with ingredient lists, which fuels demand for fermentation-derived and clean-label claims.
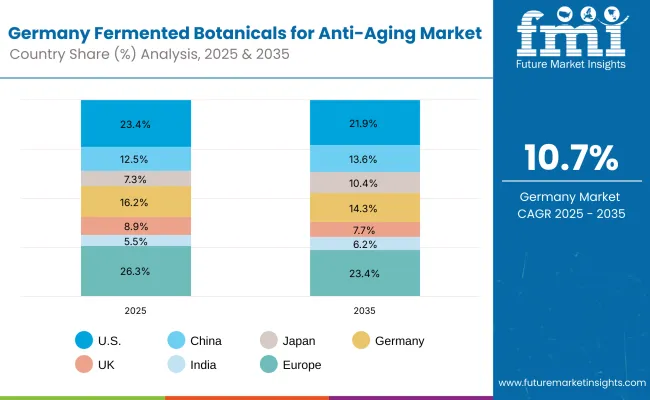
| Country | 2025 Share (%) |
|---|---|
| USA | 23.4% |
| China | 12.5% |
| Japan | 7.3% |
| Germany | 16.2% |
| UK | 8.9% |
| India | 5.5% |
| Europe | 26.3% |
| Country | 2035 Share (%) |
|---|---|
| USA | 21.9% |
| China | 13.6% |
| Japan | 10.4% |
| Germany | 14.3% |
| UK | 7.7% |
| India | 6.2% |
| Europe | 23.4% |
The Fermented Botanicals for Anti-Aging Market in Germany is projected to grow at a CAGR of 10.7% between 2025 and 2035. This growth is supported by Germany’s robust dermocosmetic heritage, high consumer preference for clinically validated natural products, and its expanding organic beauty retail ecosystem. German consumers prioritize ingredients with microbiome balance, clean-label claims, and clinical-grade efficacy, creating strong momentum for fermented botanicals.
Manufacturers are leveraging fermentation to boost bioavailability of active compounds such as ginseng, centellaasiatica, and chamomile. These ingredients are increasingly featured in anti-aging formulations that offer barrier repair, elasticity improvement, and skin brighteningespecially in serums and creams, which are popular among German consumers aged 30+. The growing demand for vegan, hypoallergenic, and preservative-free anti-aging solutions further propels the adoption of fermentation-derived ingredients in skincare.
Sales are mainly driven by pharmacies and specialty beauty retail, where brands with science-forward storytelling and transparent ingredient sourcing thrive. Regulatory confidence in Germany, aided by EU Cosmetic Directives, ensures sustained consumer trust in fermented formulations. Innovation hubs in Berlin and Munich are also seeing biotech startups collaborating with skincare brands, introducing next-gen fermented botanicals powered by precision fermentation.
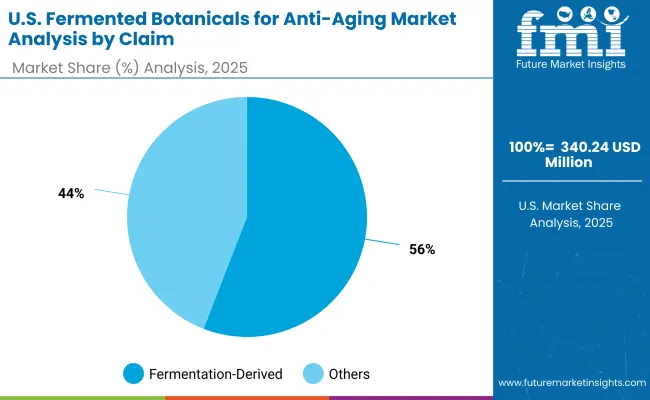
| USA by Claim | Value Share % 2025 |
|---|---|
| Fermentation-derived | 55.9% |
| Others | 44.1% |
The Fermented Botanicals for Anti-Aging Market in the United States is projected at USD 340.24 million in 2025. Fermentation-derived claims account for 55.9% of sales, indicating growing consumer preference for naturally processed, microbiome-friendly formulations that align with clean beauty values. The USA market favors serums, ampoules, and creams formulated with fermented botanicals that enhance anti-aging efficacy, improve absorption, and reduce skin sensitivity.
Premium and dermocosmetic brands are leading the way by incorporating fermented ginseng, rice, and soy extracts into formulations that target wrinkle reduction, barrier repair, and radiance boosting. E-commerce and specialty beauty retailers remain the dominant channels, supported by social media-driven consumer education, clean-label transparency, and dermatologist endorsements. Brands that combine traditional Asian fermentation techniques with Western scientific positioning are gaining traction.
Additionally, the market is seeing increased segmentation by skin concern and age group, leading to tailored anti-aging solutions. Demand for vegan, non-toxic, and biotechnology-inspired skincare is influencing both product development and consumer loyalty strategies in the USA
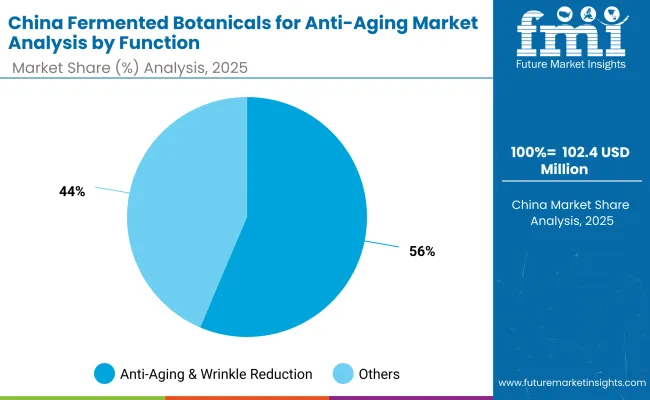
| China by Functions | Value Share % 2025 |
|---|---|
| Anti-aging & wrinkle reduction | 56.4% |
| Others | 43.6% |
The Fermented Botanicals for Anti-Aging Market in China offers one of the strongest growth opportunities globally, with anti-aging and wrinkle reduction accounting for 56.4% of the segment’s value share in 2025. This leadership is driven by China’s aging population, rising disposable incomes, and growing demand for preventive skincare among consumers in their 20s and 30s.
Chinese consumers are increasingly seeking high-efficacy skincare solutions that combine traditional Eastern ingredients with modern fermentation science. Brands leveraging fermented rice water, ginseng, mushrooms, and red algae have seen success through their enhanced nutrient bioavailability and superior skin absorption. Domestic brands are quickly innovating, while K-beauty and J-beauty imports continue to shape consumer expectations.
China’s beauty tech sector is also influencing growth. AI-powered skin diagnostics, livestream consultations, and ingredient transparency apps have made it easier for consumers to understand the value of fermented botanicals. The “guochao” (national wave) trend has further boosted local brands that merge traditional Chinese medicine (TCM) with modern biotech.
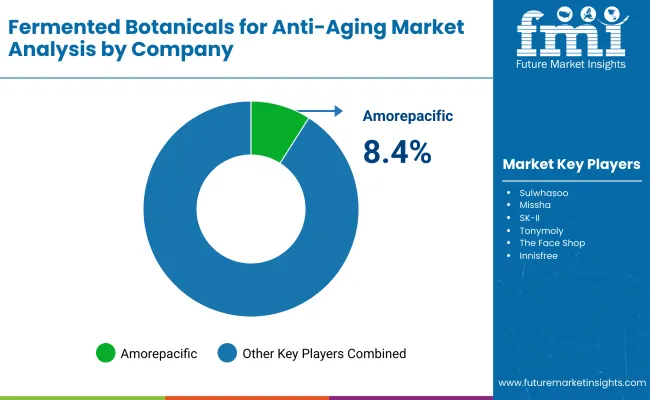
| Company | Global Value Share 2025 |
|---|---|
| Amorepacific | 8.4% |
| Others | 91.6% |
The Fermented Botanicals for Anti-Aging Market is moderately fragmented, with global leaders, mid-sized innovators, and niche-focused specialists competing across diverse product formats and retail channels. Global skincare brands such as Amorepacific, Shiseido, and L’Oréal are at the forefront of innovation in fermentation-based actives, leveraging R&D in natural bioactives and clinical-grade efficacy. Their advantage lies in scale, proprietary fermentation platforms, and integrated ingredient-to-formula pipelines.
Amorepacific leads with a wide range of products infused with fermented ginseng and green tea extracts, contributing significantly to the global market share through its flagship brands such as Sulwhasoo and Laneige. Established mid-sized companies including DSM-Firmenich, Givaudan Active Beauty, and Croda are expanding their B2B fermentation ingredient portfolios, catering to clean-label demands and microbiome-centered formulations. These players also focus on postbiotic and enzymatically-enhanced botanical actives, offering tailored solutions for premium skincare brands.
Specialist firms and emerging brands are gaining traction by using traditional fermentation methods for localized botanical ingredients like rice, kombucha, and centellaasiatica. These products are especially popular in clinical and e-commerce segments where hypoallergenic, vegan, and minimalist skincare claims resonate strongly. Competitive differentiation is gradually shifting from traditional formulation expertise to holistic platform strategies combining fermentation technology, AI-driven ingredient development, clinical testing, and omnichannel storytelling.
Key Developments in Fermented Botanicals for Anti-Aging Market
| Item | Value |
|---|---|
| Quantitative Units | USD 1,452.6 Million |
| Function | Anti-aging & wrinkle reduction, Firming & elasticity, Brightening, Hydration & barrier repair |
| Product Type | Serums, Creams/lotions, Ampoules, Masks |
| Channel | E-commerce, Specialty beauty retail, Pharmacies, Premium spas & clinics |
| Claim | Natural/organic, Fermentation-derived, Vegan, Clean-label |
| Regions Covered | North America, Europe, Asia-Pacific, Latin America, Middle East & Africa |
| Country Covered | United States, Canada, Germany, France, United Kingdom, China, Japan, India, Brazil, South Africa |
| Key Companies Profiled | Amorepacific , Sulwhasoo , Missha , SK-II, Tonymoly , The Face Shop, Innisfree, Cosrx , Shiseido, Whamisa |
| Additional Attributes | Dollar sales by function and product type, consumer preferences across clean-label and fermentation-derived claims, increasing adoption in premium skincare regimens, channel-wise performance across e-commerce and specialty beauty retail, segmentation of revenue by serums, ampoules, and creams/lotions, ingredient innovation in probiotics and postbiotics for skin microbiome support, country-level growth driven by aging populations and wellness trends, rising usage in dermatology-led premium spas and clinics, and competitive differentiation through vegan formulation, biotech fermentation processes, and sustainability-led marketing strategies. |
The global Fermented Botanicals for Anti-Aging Market is estimated to be valued at USD 1,452.6 million in 2025.
The market size for the Fermented Botanicals for Anti-Aging Market is projected to reach USD 4,951.4 million by 2035.
The Fermented Botanicals for Anti-Aging Market is expected to grow at a 13.0% CAGR between 2025 and 2035.
The key product types in the Fermented Botanicals for Anti-Aging Market are serums, creams/lotions, ampoules, and masks.
In terms of function, the anti-aging & wrinkle reduction segment is expected to command 56.4% share in the Fermented Botanicals for Anti-Aging Market in 2025.


Full Research Suite comprises of:
Market outlook & trends analysis
Interviews & case studies
Strategic recommendations
Vendor profiles & capabilities analysis
5-year forecasts
8 regions and 60+ country-level data splits
Market segment data splits
12 months of continuous data updates
DELIVERED AS:
PDF EXCEL ONLINE
Fermented Coffee Market Size and Share Forecast Outlook 2025 to 2035
Fermented Vitamins Market Analysis - Size and Share Forecast Outlook 2025 to 2035
Fermented Amino Acid Complex Market Size and Share Forecast Outlook 2025 to 2035
Fermented Beverages Market Size and Share Forecast Outlook 2025 to 2035
Fermented Rice Extracts Market Size and Share Forecast Outlook 2025 to 2035
Fermented Pet Ingredient Market Size and Share Forecast Outlook 2025 to 2035
Fermented Food and Beverage Market Analysis - Size, Share, and Forecast Outlook 2025 to 2035
Fermented Extracts Market Size and Share Forecast Outlook 2025 to 2035
Fermented Face Mask Market Size and Share Forecast Outlook 2025 to 2035
Fermented Processed Food Market Size and Share Forecast Outlook 2025 to 2035
Fermented Dairy Products Market Analysis - Size, Share, & Forecast Outlook 2025 to 2035
Fermented Dairy Ingredient Market Analysis - Size, Share, & Forecast Outlook 2025 to 2035
Fermented Seaweed Market Analysis - Size, Share, and Forecast Outlook 2025 to 2035
Fermented Chymosin Market Analysis - Size, Share, & Forecast Outlook 2025 to 2035
Fermented Flavours Market Size, Growth, and Forecast for 2025 to 2035
Fermented Ingredient Market Size, Growth, and Forecast for 2025 to 2035
Fermented Feed Market Analysis by Product Type, Livestock and Fermentation Process Through 2035
Market Share Breakdown of Fermented Ingredients
Fermented Cucumber Market Trends - Growth & Consumer Demand 2025 to 2035
Fermented Protein Market Trends - Innovations & Growth 2025 to 2035

Thank you!
You will receive an email from our Business Development Manager. Please be sure to check your SPAM/JUNK folder too.
Chat With
MaRIA