Fermented Seaweed Market Size, Share, and Forecast Outlook 2025 to 2035

The fermented seaweed market is projected to grow from USD 354.5 million in 2025 to USD 540.1 million by 2035 at a CAGR of 4.3%. Over 60% of current demand originates from functional food, supplement, and fermented snack applications, with East Asia contributing over 40% of total volume.
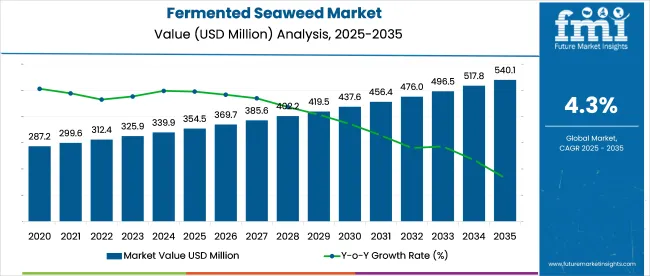
Quick Stats of the Fermented Seaweed Market

  • Fermented Seaweed Market Size (2025): USD 354.5 million
  • Projected Fermented Seaweed Market Size (2035): USD 540.1 million
  • Forecast CAGR of Fermented Seaweed Market (2025 to 2035): 4.3%
  • Leading Segment of Fermented Seaweed Market (2025): Brown Seaweed (46%)
  • Key Growth Regions of Fermented Seaweed Market: East Asia, South Asia & Pacific, Europe
  • Top Key Players of Fermented Seaweed Market: Seaweed & Co., Oceanium Ltd., Seakura Ltd., Macro Oceans Inc., Phytality (PhycoDigest)

Fermented Seaweed Market

Metric Value
Market Size in 2025 USD 354.5 million
Projected Market Size in 2035 USD 540.1 million
CAGR (2025 to 2035) 4.3%

India, China, and South Korea are scaling coastal fermentation hubs to meet rising B2B demand. Cost per kilogram has declined by 12-15% since 2022 due to shorter microbial fermentation cycles. Growth is being influenced by supply chain consolidation, bioactive strain development, and demand for marine-derived gut health ingredients across OECD and ASEAN markets.

“Seaweed is this bountiful resource. It doesn’t require any fertilizers or pesticides. It doesn’t need fresh water. It doesn’t compete with land-based crops. We still need to feed a lot of people,” said Matthew Perkins, founder and CEO of Macro Oceans.

“We thought there was an opportunity to take this really scalable, interesting, sustainable resource and transform it into materials, and we began in beauty because beauty is a wonderful place that needs high-performance materials that are sustainable.”(Beauty Independent, October 28, 2024)

The fermented seaweed market is valued at approximately USD 354.5 million in 2025, representing a niche segment across its broader parent categories. It accounts for nearly 6-8% of the seaweed-based products market, which includes unfermented food, hydrocolloids, and personal care extracts. Within the global fermented food and beverage market estimated at over USD 28 billion its share remains under 1.5%.

In the functional ingredients market, which exceeds USD 70 billion, fermented seaweed captures less than 0.5%, reflecting its early-stage adoption. In the nutraceutical and dietary supplements sector (valued at over USD 300 billion), its share is fractional below 0.1%. Despite the low volume share, fermented seaweed holds strategic importance as a high-value, clean-label bioactive with growing relevance in gut health, immunity, and detox product categories.

Analyzing Fermented Seaweed Market by Top Investment Segments

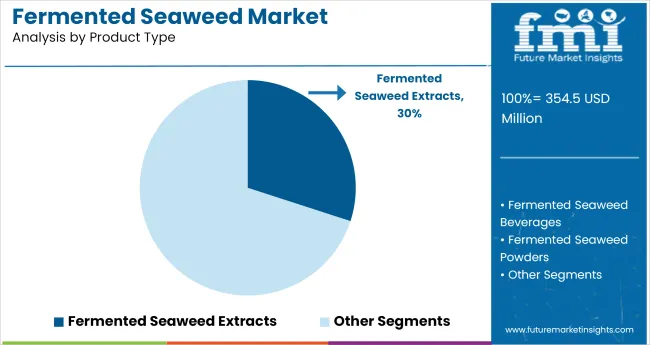
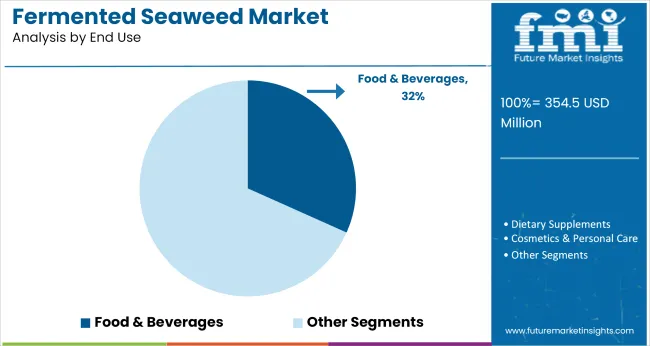
In 2025, brown seaweed leads by seaweed type with 46% share. Fermented seaweed extracts hold 30% in product type, while food & beverages dominate end use with 32%. B2B accounts for 52% in sales channel. Lactic acid fermentation holds 38.4%, gut health claims lead with 28%, and liquid form dominates with 34%. East Asia leads regional demand, followed by South Asia & Pacific and Europe. Regional analysis includes North America, Europe, East Asia, South Asia & Pacific, Latin America, and Middle East & Africa.
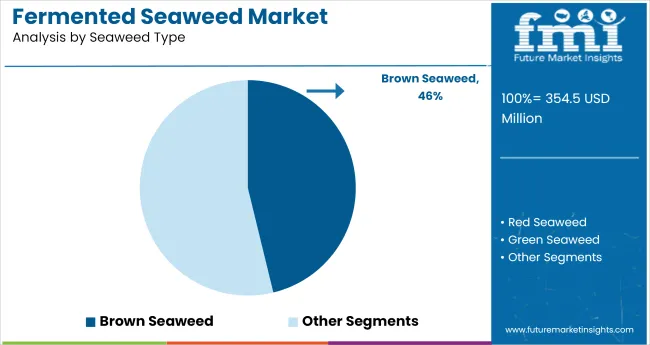
Brown Seaweed Preferred for Fermentation Substrates

Fermented Seaweed Market Analysis By Seaweed Type

Brown seaweed accounted for 46% of usage in 2025 due to its higher yield of fermentable polysaccharides such as fucoidan and alginate. Its structural integrity and nutrient retention post-fermentation have increased its use in food-grade concentrates and cosmetic emulsions. Sourcing from East Asian coastlines, particularly Korea and Japan, has remained consistent. Among the three types, brown seaweed offers the most cost-effective base for commercial fermentation, with broader application across gut health formulations and prebiotic-enhanced nutrition.
  • Korean and Japanese companies rely on brown seaweed for fermented beverage lines.
  • Bio-stimulant firms prefer brown seaweed for high polysaccharide yield.
  • Brown seaweed paste is being integrated into functional pet nutrition.

Fermented Extracts Chosen for Cross-Industry Integration

Fermented Seaweed Market Analysis By Product Type

Fermented seaweed extracts held 30% share, favored for their high concentration of active compounds, solubility, and formulation adaptability. These extracts have been used across dietary supplements, facial serums, and beverage additives, where controlled potency is essential. Their low viscosity allows for seamless blending into B2B ingredient systems. Extracts from red and brown seaweed have outperformed other formats in export-led demand due to reduced transport weight and increased shelf stability, especially in Asia-Pacific and Western European supply networks.
  • Extracts are infused in antioxidant-rich drinks and digestive tonics.
  • Skincare manufacturers use them in hydrating gels and anti-aging serums.
  • Nutraceutical firms deploy fermented extracts in probiotic capsule formulations.

Food & Beverage Sector Drives End-Use Expansion

Fermented Seaweed Market Analysis By End Use

Food and beverage applications contributed 32% to total demand, where fermented seaweed has been positioned for digestive health, savory enhancement, and functional snacking. It has been embedded in liquid concentrates, seasoning blends, and nutritional bars targeting microbiome modulation. The umami flavor of seaweed combined with postbiotics from fermentation makes it suitable for clean-label product development. Formulation trials by beverage start-ups and snack manufacturers across Japan, Singapore, and Australia have fueled regional product innovations using fermented macroalgae.
  • Fermented seaweed snacks are retailing in Korea and Singapore supermarkets.
  • Kombucha brands are testing brown seaweed ferments for added fiber.
  • Fermented flakes are used in seasoning blends for functional ready meals.

B2B Procurement Dominates Commercial Transactions

Fermented Seaweed Market Analysis By Sales Channel

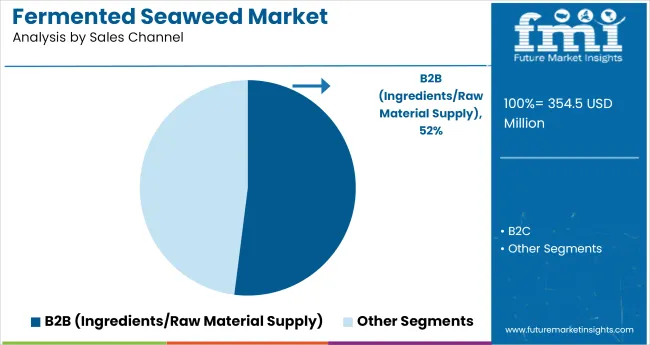
A 52% share was held by B2B supply channels in 2025, driven by bulk ingredient demand in personal care, nutraceutical, and food manufacturing. Large-scale fermentation operations have preferred direct contracts with buyers seeking custom viscosity, pH, and nutrient concentration. Ingredient processors across the US, France, and South Korea have structured multi-year agreements for fermented extracts and powders. In contrast, fragmented retail distribution has remained limited to specialty wellness stores and online natural product platforms.

  • Multinationals procure seaweed inputs for gut health product lines.
  • Cosmetics companies embed fermented concentrates in liquid skincare bases.
  • Feed producers use seaweed pastes for livestock and aquaculture nutrition.

Lactic Acid Method Favored for Bioactive Stability

Lactic acid fermentation captured 38.4% of the market, recognized for preserving phenolic content, reducing microbial risk, and aligning with organic product certifications. The method has been used for both low-acid beverages and water-soluble pastes in the gut-health segment. Its compatibility with cold-fill processing and high bioavailability outcomes has increased adoption. Manufacturers in Germany, Taiwan, and India have upgraded fermentation capacity specifically for lactic-based seaweed processing to meet rising contract manufacturing demand from supplement and beverage brands.
  • Dietary supplements in Europe use lactic-fermented red seaweed extracts.
  • Ready-to-drink detox beverages favor this method for improved texture.
  • Lactic fermentation enhances antioxidant retention in cosmetic formulations.

Gut Health Claim Leads Functional Applications

Fermented Seaweed Market Analysis By Functional Claims

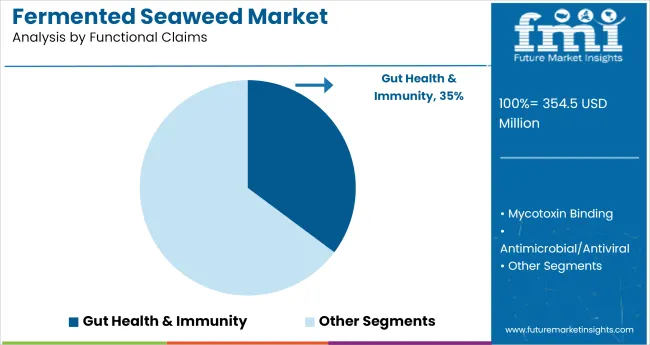
Functional positioning around gut health made up 35% of the market, supported by high consumer awareness of digestive well-being and microbiome support. Fermented seaweed has delivered prebiotic fiber, marine polyphenols, and beneficial bacterial metabolites in both capsule and drinkable formats. Claims on packaging now emphasize bowel regularity, immune regulation, and microbial balance. Formulators in the United States and South Korea have focused on blending seaweed fermentates with inulin and other fiber-based carriers to broaden the claim stack.
  • Seaweed-based prebiotic shots target microbiome modulation in adults.
  • Capsules with fermented seaweed address bloating and GI support.
  • Functional yogurts include gut-health blends with fermented seaweed base.

Liquid Formats Lead in Multi-Use Applications

Fermented Seaweed Market Analysis By Form

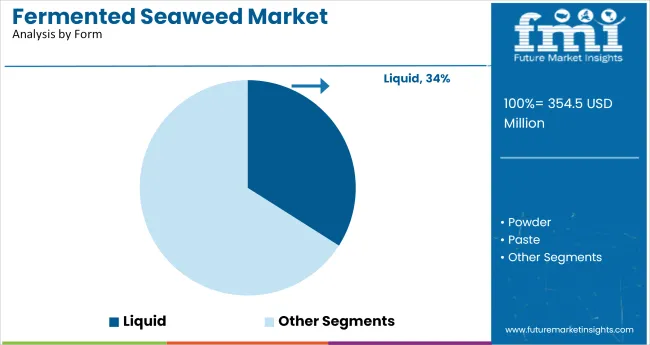
Liquid forms held 34% of the total segment, attributed to their dispersibility, formulation flexibility, and high absorption rates. Liquid seaweed fermentates have been used in agricultural foliar sprays, cosmeceutical mists, and drinkable dietary supplements. Their ease of handling in manufacturing pipelines has reduced dosing variability and storage complexity. Producers in France, Japan, and New Zealand have prioritized liquid fermentation batches, using them as base inputs for downstream processing in both functional beverage and biostimulant categories.

  • Liquid seaweed emulsions are supplied to skincare manufacturers in Europe.
  • Herbal tonic makers use liquid seaweed ferments for taste and nutrition.
  • Agricultural input firms apply liquid seaweed in bio-stimulant foliar sprays.

Top Fermented Seaweed Market Dynamics

The industry is being shaped by evolving nutritional preferences, bioactive ingredient exploration, and a widening scope of fermentation technologies. Rising demand from the dietary supplement, functional foods, and cosmetics industries has strengthened the commercial case for fermented seaweed. However, variability in seaweed biomass quality and regional supply imbalances remain key barriers for consistent scale-up.

Functional Nutrition Driving Fermented Seaweed Integration

The increasing inclusion of fermented seaweed in dietary supplements and fortified foods is driven by its ability to enhance mineral absorption and antioxidant activity. Lactic acid and yeast fermentation methods are being deployed to create seaweed powders and extracts with higher polyphenol and prebiotic content. By 2025, dietary supplements captured 23.4% of end-use share, while B2B ingredient sales through functional food brands remained dominant across East Asia and Europe.

  • Seaweed-fermented extracts used in immunity-focused supplements rose 5.8% YoY from 2023 to 2025
  • Food and beverage manufacturers in Japan and South Korea adopted seaweed extracts in over 60 new SKUs in 2024
  • Lactic acid fermentation accounted for over 42.1% of total fermented product output in 2025

Supply-Driven Volatility Limiting Scale-Up Potential

Fermented product consistency is affected by oceanic biomass variability, which impacts fermentation efficiency and compound profiles. Green seaweed showed a 12–17% lower fermentation yield than brown variants. Regulatory misalignment across ASEAN and EU zones delayed market entry of over 40 new fermented seaweed formulations between 2022 and 2024. The B2B supply chain continues to be fragmented, with over 70% of raw seaweed sourced from artisanal producers lacking standardized quality protocols.
  • Brown seaweed provides 1.4x higher phlorotannin concentration post-fermentation compared to red varieties
  • EU regulatory holds on fermented marine extracts increased average launch timelines by 6–9 months
  • East Asia controlled 47.6% of total fermented seaweed output in 2025, but relied on imports for 31.5% of biomass inputs

Top Countries Scaling, Commercializing, and Regulating Fermented Seaweed Demand

Country Wise Analysis Of Fermented Seaweed Market

Countries CAGR (2025 to 2035)
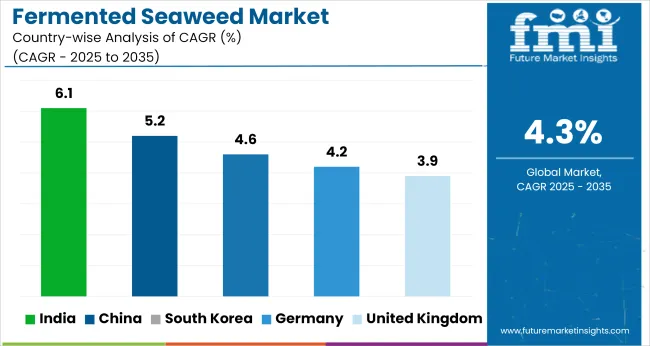
India 6.1%
China 5.2%
South Korea 4.6%
Germany 4.2%
United Kingdom 3.9%

The global fermented seaweed market is forecast to grow at a 4.3% CAGR from 2025 to 2035. Among the forty countries analyzed, India leads at 6.1%, followed by China at 5.2% and South Korea at 4.6%. Germany and the United Kingdom, both OECD members, trail with CAGRs of 4.2% and 3.9% respectively.

BRICS nations like India and China outperform the global average by notable margins, while advanced economies in the OECD cluster show more restrained expansion. The report covers detailed analysis of 40+ countries and the top five countries have been shared as a reference.

The report provides a detailed analysis of 40+ countries, with the top five countries listed as a reference.

India Fermented Seaweed Market Growth Trajectory

India is projected to register a 6.1% CAGR between 2025 and 2035, surpassing global and BRICS averages. Early adoption during 2020 to 2024 was shaped by functional food experiments among Ayurveda-focused startups. Between 2025 and 2035, momentum has shifted toward B2C nutrition brands using red seaweed in gut-health drinks and fortified powders.

State-backed seaweed farming programs in Tamil Nadu and Gujarat have enabled consistent supply, reducing dependency on imported raw biomass. Category expansion beyond coastal regions has been achieved through D2C subscription bundles and vernacular influencer outreach.

  • Tamil Nadu and Gujarat accounted for 61% of domestically farmed seaweed by 2028
  • Red seaweed featured in over 50% of functional launches in 2027
  • Ayurveda-integrated nutrition blends grew 3.4× between 2025 and 2029

China Fermented Seaweed Market Growth Outlook

China is forecast to expand at a CAGR of 5.2% from 2025 to 2035. During 2020 to 2024, fermented seaweed remained an ingredient in traditional condiments and preserved foods. The current decade has seen rapid expansion into fortified beverages and dietary supplements.

Domestic marine biotech firms have integrated kelp and wakame strains into value-added food formats, often enabled by mobile health platforms. New regulatory guidance in 2026 on functional claims allowed full-scale retail distribution through pharmacy chains and wellness stores.

  • Functional fermented drinks using kelp made up 62% of launches by 2028
  • Over 430 new fermentation patents were filed between 2025 and 2030
  • Chain pharmacies expanded shelf space for seaweed products by 2,000+ SKUs in 2029

South Korea Fermented Seaweed Market Expansion

A CAGR of 4.6% has been projected for South Korea through 2035. Growth during 2020 to 2024 was tied to preserved food traditions. From 2025 onward, clinical skincare and digestive wellness categories began integrating encapsulated seaweed ferments and hydrogel-based formats. K-beauty brands commercialized cosmetic formats with dual health and aesthetic claims. Regulatory filters introduced by MFDS in 2027 strengthened compliance for products positioned under health and functional labeling frameworks.

  • Encapsulated ferments made up 36% of new health launches in 2027
  • MFDS-compliant fermented products expanded 4× from 2026 to 2029
  • Export-ready formulations entered 19 new regional markets by 2030

Germany Fermented Seaweed Market Outlook

Germany is projected to achieve a 4.2% CAGR between 2025 and 2035. Prior to this, fermented seaweed use was concentrated in select cosmeceuticals and organic food SKUs. Since 2025, interest has shifted toward fermented brown seaweed in digestive and immune-support supplements.

Food producers aligned with EU health claim mandates have invested in validated bioactive extractions. Schleswig-Holstein localized aquaculture output has reduced reliance on imports and supported retail expansion in functional beverages and skincare channels.

  • Brown seaweed accounted for 48% of functional food applications in 2026
  • Schleswig-Holstein contributed 55% of raw supply in 2030
  • Fermented seaweed featured in 60% of new cosmeceutical SKUs in 2028

United Kingdom Fermented Seaweed Market Forecast

The United Kingdom is expected to grow at a 3.9% CAGR during the 2025 to 2035 period. Early-stage demand remained limited to vegan food and supplement startups operating in niche health channels. Supermarket private labels have since scaled production of fermented seaweed snacks and capsules, particularly from native red algae.

Government-backed aquaculture pilots in Wales and Scotland improved ingredient availability for domestic processing. NHS-endorsed pilot kits incorporating prebiotic seaweed blends accelerated legitimacy for gut-health aligned supplementation.
  • Red seaweed represented 58% of UK-cultivated seaweed in 2028
  • NHS-linked wellness pilots distributed seaweed ferments from 2027
  • Private label seaweed snacks expanded by 3.2× between 2025 and 2030

Competitive Landscape in the Fermented Seaweed Market

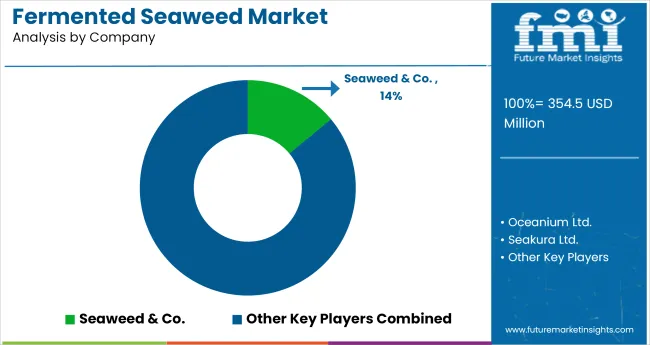
Fermented Seaweed Market Analysis By Company

The fermented seaweed market is led by companies focused on high-value bioactives, precision fermentation, and traceable marine inputs. Seaweed & Co. (UK) and Oceanium (Scotland) dominate B2B ingredient supply through patented extraction and gut-health positioning. Seakura (Israel) and Macro Oceans (USA) invest in scalable low-sodium formulations for food and personal care use. Phytality (Australia) targets vegan nutraceuticals in APAC via its PhycoDigest platform.

Competition is intensifying as fermented seaweed gains traction in clean-label wellness products and cosmeceuticals. Industry players are adopting three core strategies: proprietary biorefinery development, biotech-algae collaborations for consistent raw material supply, and expansion into digital and therapeutic retail formats. Traceability, functionality, and platform compatibility remain essential to defending premium shelf space in this evolving industry.

Leading Company - Seaweed & Co.Market Share - 14%

Recent Fermented Seaweed Industry News

  • In May 2025, Channelled Atlantic introduced its fermented liquid seaweed formulation to support farmers in Southwest England during prolonged dry periods forecasted by the MET Office. Designed to enhance crop drought resilience and yield, the product targets both conventional and organic growers across Devon, Cornwall, and Somerset, following successful 2023 to 2024 field trials on cereals and legumes.
  • In June 2025, Macro Oceans launched Big Kelp Flex at NYSCC Suppliers’ Day in New York a seaweed-derived polymer intended to replace microplastics in cosmetics. The product enables high-density particle suspension in mineral sunscreen formulations while delivering a natural, zero-waste alternative to synthetic texturizers.

Leading Companies in Fermented Seaweed Market

  • Seaweed & Co.
  • Oceanium Ltd.
  • Seakura Ltd.
  • Macro Oceans Inc.
  • Phytality (PhycoDigest)
  • Others

Research Coverage and Scope Summary

Report Attributes Details
Market Size (2025) USD 354.5 million
Projected Market Size (2035) USD 540.1 million
CAGR (2025 to 2035) 4.3%
Base Year for Estimation 2024
Historical Period 2020 to 2024
Projections Period 2025 to 2035
Quantitative Units USD million for value and thousand metric tons for volume
Seaweed Types Analyzed (Segment 1) Red Seaweed, Brown Seaweed, Green Seaweed
Product Types Analyzed (Segment 2) Fermented Seaweed Extracts, Fermented Seaweed Beverages, Fermented Seaweed Powders, Fermented Seaweed Pastes
End Uses Analyzed (Segment 3) Food & Beverages, Dietary Supplements, Cosmetics & Personal Care, Animal Feed & Pet Food, Fertilizers & Bio-stimulants
Sales Channels Analyzed (Segment 4) B2B (Ingredients/Raw Material Supply), Supermarkets/Hypermarkets, Specialty Stores, Online Retail
Functionality/Claims Analyzed (Segment 5) Gut Health, Antioxidant, Detoxification, Immunity Support, Skin Health
Forms Analyzed (Segment 6) Liquid, Powder, Paste, Capsule/Tablets (for supplements)
Fermentation Methods Analyzed (Segment 7) Lactic Acid Fermentation, Yeast Fermentation, Mixed Culture Fermentation
Regions Covered North America, Latin America, Europe, East Asia, South Asia & Pacific, Middle East & Africa
Countries Covered United States, Canada, Germany, United Kingdom, France, Italy, Spain, China, India, Japan, South Korea, Australia, Brazil, Mexico, Argentina, Saudi Arabia, UAE, South Africa
Key Players Seaweed & Co., Oceanium Ltd., Seakura Ltd., Macro Oceans Inc., Phytality ( PhycoDigest ), Others
Additional Attributes Dollar sales, share by seaweed type and end use, demand rise in gut health and immunity segments, fermentation innovation using mixed cultures, regional variation in ingredient sourcing and distribution channels

Key Segments

By Seaweed Type:

The segment includes Red Seaweed, Brown Seaweed, and Green Seaweed.

By Product Type:

This includes Fermented Seaweed Extracts, Fermented Seaweed Beverages, Fermented Seaweed Powders, and Fermented Seaweed Pastes.

By End Use:

This segment covers Food & Beverages, Dietary Supplements, Cosmetics & Personal Care, Animal Feed & Pet Food, and Fertilizers & Bio-stimulants.

By Sales Channel:

The industry is segmented into B2B (Ingredients/Raw Material Supply), Supermarkets/Hypermarkets, Specialty Stores, and Online Retail.

By Functionality/Claims:

This includes Gut Health, Antioxidant, Detoxification, Immunity Support, and Skin Health.

By Form:

The segment includes Liquid, Powder, Paste, and Capsule/Tablets (for supplements).

By Fermentation Method:

This includes Lactic Acid Fermentation, Yeast Fermentation, and Mixed Culture Fermentation.

By Region:

Regional analysis includes North America, Latin America, Europe, East Asia, South Asia & Pacific, and Middle East & Africa.

Table of Content

  1. Executive Summary
    • Global Market Outlook
    • Demand-side Trends
    • Supply-side Trends
    • Technology Roadmap Analysis
    • Analysis and Recommendations
  2. Market Overview
    • Market Coverage / Taxonomy
    • Market Definition / Scope / Limitations
  3. Market Background
    • Market Dynamics
      • Drivers
      • Restraints
      • Opportunity
      • Trends
    • Scenario Forecast
      • Demand in Optimistic Scenario
      • Demand in Likely Scenario
      • Demand in Conservative Scenario
    • Opportunity Map Analysis
    • Product Life Cycle Analysis
    • Supply Chain Analysis
      • Supply Side Participants and their Roles
        • Producers
        • Mid-Level Participants (Traders/ Agents/ Brokers)
        • Wholesalers and Distributors
      • Value Added and Value Created at Node in the Supply Chain
      • List of Raw Material Suppliers
      • List of Existing and Potential Buyer’s
    • Investment Feasibility Matrix
    • Value Chain Analysis
      • Profit Margin Analysis
      • Wholesalers and Distributors
      • Retailers
    • PESTLE and Porter’s Analysis
    • Regulatory Landscape
      • By Key Regions
      • By Key Countries
    • Regional Parent Market Outlook
    • Production and Consumption Statistics
    • Import and Export Statistics
  4. Global Market Analysis 2020 to 2024 and Forecast, 2025 to 2035
    • Historical Market Size Value (USD Million) & Volume (Thousand MT) Analysis, 2020 to 2024
    • Current and Future Market Size Value (USD Million) & Volume (Thousand MT) Projections, 2025 to 2035
      • Y-o-Y Growth Trend Analysis
      • Absolute $ Opportunity Analysis
  5. Global Market Pricing Analysis 2020 to 2024 and Forecast 2025 to 2035
  6. Global Market Analysis 2020 to 2024 and Forecast 2025 to 2035, By Seaweed Type
    • Introduction / Key Findings
    • Historical Market Size Value (USD Million) & Volume (Thousand MT) Analysis By Seaweed Type, 2020 to 2024
    • Current and Future Market Size Value (USD Million) & Volume (Thousand MT) Analysis and Forecast By Seaweed Type, 2025 to 2035
      • Red Seaweed
      • Brown Seaweed
      • Green Seaweed
    • Y-o-Y Growth Trend Analysis By Seaweed Type, 2020 to 2024
    • Absolute $ Opportunity Analysis By Seaweed Type, 2025 to 2035
  7. Global Market Analysis 2020 to 2024 and Forecast 2025 to 2035, By Product Type
    • Introduction / Key Findings
    • Historical Market Size Value (USD Million) & Volume (Thousand MT) Analysis By Product Type, 2020 to 2024
    • Current and Future Market Size Value (USD Million) & Volume (Thousand MT) Analysis and Forecast By Product Type, 2025 to 2035
      • Extracts
      • Beverages
      • Powders
      • Powders
    • Y-o-Y Growth Trend Analysis By Product Type, 2020 to 2024
    • Absolute $ Opportunity Analysis By Product Type, 2025 to 2035
  8. Global Market Analysis 2020 to 2024 and Forecast 2025 to 2035, By Sales Channel
    • Introduction / Key Findings
    • Historical Market Size Value (USD Million) & Volume (Thousand MT) Analysis By Sales Channel, 2020 to 2024
    • Current and Future Market Size Value (USD Million) & Volume (Thousand MT) Analysis and Forecast By Sales Channel, 2025 to 2035
      • B2B (Ingredients/Raw Material Supply)
      • B2C
        • Supermarkets/Hypermarkets
        • Specialty Stores
        • Online Retail
    • Y-o-Y Growth Trend Analysis By Sales Channel, 2020 to 2024
    • Absolute $ Opportunity Analysis By Sales Channel, 2025 to 2035
  9. Global Market Analysis 2020 to 2024 and Forecast 2025 to 2035, By Functionality/Claims
    • Introduction / Key Findings
    • Historical Market Size Value (USD Million) & Volume (Thousand MT) Analysis By Functionality/Claims, 2020 to 2024
    • Current and Future Market Size Value (USD Million) & Volume (Thousand MT) Analysis and Forecast By Functionality/Claims, 2025 to 2035
      • Gut Health
      • Antioxidant
      • Detoxification
      • Immunity Support
      • Skin Health
    • Y-o-Y Growth Trend Analysis By Functionality/Claims, 2020 to 2024
    • Absolute $ Opportunity Analysis By Functionality/Claims, 2025 to 2035
  10. Global Market Analysis 2020 to 2024 and Forecast 2025 to 2035, By Form
    • Introduction / Key Findings
    • Historical Market Size Value (USD Million) & Volume (Thousand MT) Analysis By Form, 2020 to 2024
    • Current and Future Market Size Value (USD Million) & Volume (Thousand MT) Analysis and Forecast By Form, 2025 to 2035
      • Liquid
      • Powder
      • Paste
      • Capsule/Tablets
    • Y-o-Y Growth Trend Analysis By Form, 2020 to 2024
    • Absolute $ Opportunity Analysis By Form, 2025 to 2035
  11. Global Market Analysis 2020 to 2024 and Forecast 2025 to 2035, By Fermentation Method
    • Introduction / Key Findings
    • Historical Market Size Value (USD Million) & Volume (Thousand MT) Analysis By Fermentation Method, 2020 to 2024
    • Current and Future Market Size Value (USD Million) & Volume (Thousand MT) Analysis and Forecast By Fermentation Method, 2025 to 2035
      • Lactic Acid Fermentation
      • Yeast Fermentation
      • Mixed Culture Fermentation
    • Y-o-Y Growth Trend Analysis By Fermentation Method, 2020 to 2024
    • Absolute $ Opportunity Analysis By Fermentation Method, 2025 to 2035
  12. Global Market Analysis 2020 to 2024 and Forecast 2025 to 2035, By End Use
    • Introduction / Key Findings
    • Historical Market Size Value (USD Million) & Volume (Thousand MT) Analysis By End Use, 2020 to 2024
    • Current and Future Market Size Value (USD Million) & Volume (Thousand MT) Analysis and Forecast By End Use, 2025 to 2035
      • Food & Beverages
      • Dietary Supplements
      • Cosmetics & Personal Care
      • Animal Feed & Pet Food
      • Fertilizers & Bio-stimulants
    • Y-o-Y Growth Trend Analysis By End Use, 2020 to 2024
    • Absolute $ Opportunity Analysis By End Use, 2025 to 2035
  13. Global Market Analysis 2020 to 2024 and Forecast 2025 to 2035, By Region
    • Introduction
    • Historical Market Size Value (USD Million) & Volume (Thousand MT) Analysis By Region, 2020 to 2024
    • Current Market Size Value (USD Million) & Volume (Thousand MT) Analysis and Forecast By Region, 2025 to 2035
      • North America
      • Latin America
      • Western Europe
      • Eastern Europe
      • East Asia
      • South Asia & Pacific
      • Middle East and Africa
    • Market Attractiveness Analysis By Region
  14. North America Market Analysis 2020 to 2024 and Forecast 2025 to 2035, By Country
    • Historical Market Size Value (USD Million) & Volume (Thousand MT) Trend Analysis By Market Taxonomy, 2020 to 2024
    • Market Size Value (USD Million) & Volume (Thousand MT) Forecast By Market Taxonomy, 2025 to 2035
      • By Country
        • USA
        • Canada
        • Mexico
      • By Seaweed Type
      • By Product Type
      • By Sales Channel
      • By Functionality/Claims
      • By Form
      • By Fermentation Method
      • By End Use
    • Market Attractiveness Analysis
      • By Country
      • By Seaweed Type
      • By Product Type
      • By Sales Channel
      • By Functionality/Claims
      • By Form
      • By Fermentation Method
      • By End Use
    • Key Takeaways
  15. Latin America Market Analysis 2020 to 2024 and Forecast 2025 to 2035, By Country
    • Historical Market Size Value (USD Million) & Volume (Thousand MT) Trend Analysis by Market Taxonomy, 2020 to 2024
    • Market Size Value (USD Million) & Volume (Thousand MT) Forecast By Market Taxonomy, 2025 to 2035
      • By Country
        • Brazil
        • Argentina
        • Rest of LATAM
      • By Seaweed Type
      • By Product Type
      • By Sales Channel
      • By Functionality/Claims
      • By Form
      • By Fermentation Method
      • By End Use
    • Market Attractiveness Analysis
      • By Country
      • By Seaweed Type
      • By Product Type
      • By Sales Channel
      • By Functionality/Claims
      • By Form
      • By Fermentation Method
      • By End Use
    • Key Takeaways
  16. Western Europe Market Analysis 2020 to 2024 and Forecast 2025 to 2035, By Country
    • Historical Market Size Value (USD Million) & Volume (Thousand MT) Trend Analysis By Market Taxonomy, 2020 to 2024
    • Market Size Value (USD Million) & Volume (Thousand MT) Forecast By Market Taxonomy, 2025 to 2035
      • By Country
        • Germany
        • Italy
        • France
        • UK
        • Spain
        • BENELUX
        • Nordic
        • Rest of W.Europe
      • By Seaweed Type
      • By Product Type
      • By Sales Channel
      • By Functionality/Claims
      • By Form
      • By Fermentation Method
      • By End Use
    • Market Attractiveness Analysis
      • By Country
      • By Seaweed Type
      • By Product Type
      • By Sales Channel
      • By Functionality/Claims
      • By Form
      • By Fermentation Method
      • By End Use
    • Key Takeaways
  17. Eastern Europe Market Analysis 2020 to 2024 and Forecast 2025 to 2035, By Country
    • Historical Market Size Value (USD Million) & Volume (Thousand MT) Trend Analysis By Market Taxonomy, 2020 to 2024
    • Market Size Value (USD Million) & Volume (Thousand MT) Forecast By Market Taxonomy, 2025 to 2035
      • By Country
        • Russia
        • Hungary
        • Poland
        • Balkan & Baltics
        • Rest of E. Europe
      • By Seaweed Type
      • By Product Type
      • By Sales Channel
      • By Functionality/Claims
      • By Form
      • By Fermentation Method
      • By End Use
    • Market Attractiveness Analysis
      • By Country
      • By Seaweed Type
      • By Product Type
      • By Sales Channel
      • By Functionality/Claims
      • By Form
      • By Fermentation Method
      • By End Use
    • Key Takeaways
  18. East Asia Market Analysis 2020 to 2024 and Forecast 2025 to 2035, By Country
    • Historical Market Size Value (USD Million) & Volume (Thousand MT) Trend Analysis By Market Taxonomy, 2020 to 2024
    • Market Size Value (USD Million) & Volume (Thousand MT) Forecast By Market Taxonomy, 2025 to 2035
      • By Country
        • China
        • Japan
        • South Korea
      • By Seaweed Type
      • By Product Type
      • By Sales Channel
      • By Functionality/Claims
      • By Form
      • By Fermentation Method
      • By End Use
    • Market Attractiveness Analysis
      • By Country
      • By Seaweed Type
      • By Product Type
      • By Sales Channel
      • By Functionality/Claims
      • By Form
      • By Fermentation Method
      • By End Use
    • Key Takeaways
  19. South Asia & Pacific Market Analysis 2020 to 2024 and Forecast 2025 to 2035, By Country
    • Historical Market Size Value (USD Million) & Volume (Thousand MT) Trend Analysis By Market Taxonomy, 2020 to 2024
    • Market Size Value (USD Million) & Volume (Thousand MT) Forecast By Market Taxonomy, 2025 to 2035
      • By Country
        • India
        • Australia & New Zealand
        • ASEAN
        • Rest of SAP
      • By Seaweed Type
      • By Product Type
      • By Sales Channel
      • By Functionality/Claims
      • By Form
      • By Fermentation Method
      • By End Use
    • Market Attractiveness Analysis
      • By Country
      • By Seaweed Type
      • By Product Type
      • By Sales Channel
      • By Functionality/Claims
      • By Form
      • By Fermentation Method
      • By End Use
    • Key Takeaways
  20. Middle East and Africa Market Analysis 2020 to 2024 and Forecast 2025 to 2035, By Country
    • Historical Market Size Value (USD Million) & Volume (Thousand MT) Trend Analysis By Market Taxonomy, 2020 to 2024
    • Market Size Value (USD Million) & Volume (Thousand MT) Forecast by Market Taxonomy, 2025 to 2035
      • By Country
        • GCC Countries
        • Northern Africa
        • South Africa
        • Turkiye
        • Rest of MEA
      • By Seaweed Type
      • By Product Type
      • By Sales Channel
      • By Functionality/Claims
      • By Form
      • By Fermentation Method
      • By End Use
    • Market Attractiveness Analysis
      • By Country
      • By Seaweed Type
      • By Product Type
      • By Sales Channel
      • By Functionality/Claims
      • By Form
      • By Fermentation Method
      • By End Use
    • Key Takeaways
  21. Key Countries Market Analysis
    • USA
      • Pricing Analysis
      • Market Share Analysis, 2024
        • By Seaweed Type
        • By Product Type
        • By Sales Channel
        • By Functionality/Claims
        • By Form
        • By Fermentation Method
        • By End Use
    • Canada
      • Pricing Analysis
      • Market Share Analysis, 2024
        • By Seaweed Type
        • By Product Type
        • By Sales Channel
        • By Functionality/Claims
        • By Form
        • By Fermentation Method
        • By End Use
    • Brazil
      • Pricing Analysis
      • Market Share Analysis, 2024
        • By Seaweed Type
        • By Product Type
        • By Sales Channel
        • By Functionality/Claims
        • By Form
        • By Fermentation Method
        • By End Use
    • Mexico
      • Pricing Analysis
      • Market Share Analysis, 2024
        • By Seaweed Type
        • By Product Type
        • By Sales Channel
        • By Functionality/Claims
        • By Form
        • By Fermentation Method
        • By End Use
    • Argentina
      • Pricing Analysis
      • Market Share Analysis, 2024
        • By Seaweed Type
        • By Product Type
        • By Sales Channel
        • By Functionality/Claims
        • By Form
        • By Fermentation Method
        • By End Use
  22. Market Structure Analysis
    • Competition Dashboard
    • Competition Benchmarking
    • Market Share Analysis of Top Players
      • By Regional
      • By Seaweed Type
      • By Product Type
      • By Sales Channel
      • By Functionality/Claims
      • By Form
      • By Fermentation Method
      • By End Use
  23. Competition Analysis
    • Competition Deep Dive
      • Seaweed & Co.
        • Overview
        • Product Portfolio
        • Profitability by Market Segments (Product/Age /Sales Channel/Region)
        • Sales Footprint
        • Strategy Overview
          • Marketing Strategy
          • Product Strategy
          • Channel Strategy
      • Oceanium Ltd.
        • Overview
        • Product Portfolio
        • Profitability by Market Segments (Product/Age /Sales Channel/Region)
        • Sales Footprint
        • Strategy Overview
          • Marketing Strategy
          • Product Strategy
          • Channel Strategy
      • Seakura Ltd.
        • Overview
        • Product Portfolio
        • Profitability by Market Segments (Product/Age /Sales Channel/Region)
        • Sales Footprint
        • Strategy Overview
          • Marketing Strategy
          • Product Strategy
          • Channel Strategy
      • Macro Oceans Inc.
        • Overview
        • Product Portfolio
        • Profitability by Market Segments (Product/Age /Sales Channel/Region)
        • Sales Footprint
        • Strategy Overview
          • Marketing Strategy
          • Product Strategy
          • Channel Strategy
      • Phytality (PhycoDigest)
        • Overview
        • Product Portfolio
        • Profitability by Market Segments (Product/Age /Sales Channel/Region)
        • Sales Footprint
        • Strategy Overview
          • Marketing Strategy
          • Product Strategy
          • Channel Strategy
  24. Assumptions & Acronyms Used
  25. Research Methodology

List of Tables

  • Table 1: Global Market Value (USD Million) Forecast by Region, 2020-2035
  • Table 2: Global Market Volume (Thousand MT) Forecast by Region, 2020-2035
  • Table 3: Global Market Value (USD Million) Forecast by Seaweed Type, 2020-2035
  • Table 4: Global Market Volume (Thousand MT) Forecast by Seaweed Type, 2020-2035
  • Table 5: Global Market Value (USD Million) Forecast by Product Type, 2020-2035
  • Table 6: Global Market Volume (Thousand MT) Forecast by Product Type, 2020-2035
  • Table 7: Global Market Value (USD Million) Forecast by Sales Channel, 2020-2035
  • Table 8: Global Market Volume (Thousand MT) Forecast by Sales Channel, 2020-2035
  • Table 9: Global Market Value (USD Million) Forecast by Functionality/Claims, 2020-2035
  • Table 10: Global Market Volume (Thousand MT) Forecast by Functionality/Claims, 2020-2035
  • Table 11: Global Market Value (USD Million) Forecast by Form, 2020-2035
  • Table 12: Global Market Volume (Thousand MT) Forecast by Form, 2020-2035
  • Table 13: Global Market Value (USD Million) Forecast by Fermentation Method, 2020-2035
  • Table 14: Global Market Volume (Thousand MT) Forecast by Fermentation Method, 2020-2035
  • Table 15: Global Market Value (USD Million) Forecast by End Use, 2020-2035
  • Table 16: Global Market Volume (Thousand MT) Forecast by End Use, 2020-2035
  • Table 17: North America Market Value (USD Million) Forecast by Country, 2020-2035
  • Table 18: North America Market Volume (Thousand MT) Forecast by Country, 2020-2035
  • Table 19: North America Market Value (USD Million) Forecast by Seaweed Type, 2020-2035
  • Table 20: North America Market Volume (Thousand MT) Forecast by Seaweed Type, 2020-2035
  • Table 21: North America Market Value (USD Million) Forecast by Product Type, 2020-2035
  • Table 22: North America Market Volume (Thousand MT) Forecast by Product Type, 2020-2035
  • Table 23: North America Market Value (USD Million) Forecast by Sales Channel, 2020-2035
  • Table 24: North America Market Volume (Thousand MT) Forecast by Sales Channel, 2020-2035
  • Table 25: North America Market Value (USD Million) Forecast by Functionality/Claims, 2020-2035
  • Table 26: North America Market Volume (Thousand MT) Forecast by Functionality/Claims, 2020-2035
  • Table 27: North America Market Value (USD Million) Forecast by Form, 2020-2035
  • Table 28: North America Market Volume (Thousand MT) Forecast by Form, 2020-2035
  • Table 29: North America Market Value (USD Million) Forecast by Fermentation Method, 2020-2035
  • Table 30: North America Market Volume (Thousand MT) Forecast by Fermentation Method, 2020-2035
  • Table 31: North America Market Value (USD Million) Forecast by End Use, 2020-2035
  • Table 32: North America Market Volume (Thousand MT) Forecast by End Use, 2020-2035
  • Table 33: Latin America Market Value (USD Million) Forecast by Country, 2020-2035
  • Table 34: Latin America Market Volume (Thousand MT) Forecast by Country, 2020-2035
  • Table 35: Latin America Market Value (USD Million) Forecast by Seaweed Type, 2020-2035
  • Table 36: Latin America Market Volume (Thousand MT) Forecast by Seaweed Type, 2020-2035
  • Table 37: Latin America Market Value (USD Million) Forecast by Product Type, 2020-2035
  • Table 38: Latin America Market Volume (Thousand MT) Forecast by Product Type, 2020-2035
  • Table 39: Latin America Market Value (USD Million) Forecast by Sales Channel, 2020-2035
  • Table 40: Latin America Market Volume (Thousand MT) Forecast by Sales Channel, 2020-2035
  • Table 41: Latin America Market Value (USD Million) Forecast by Functionality/Claims, 2020-2035
  • Table 42: Latin America Market Volume (Thousand MT) Forecast by Functionality/Claims, 2020-2035
  • Table 43: Latin America Market Value (USD Million) Forecast by Form, 2020-2035
  • Table 44: Latin America Market Volume (Thousand MT) Forecast by Form, 2020-2035
  • Table 45: Latin America Market Value (USD Million) Forecast by Fermentation Method, 2020-2035
  • Table 46: Latin America Market Volume (Thousand MT) Forecast by Fermentation Method, 2020-2035
  • Table 47: Latin America Market Value (USD Million) Forecast by End Use, 2020-2035
  • Table 48: Latin America Market Volume (Thousand MT) Forecast by End Use, 2020-2035
  • Table 49: Western Europe Market Value (USD Million) Forecast by Country, 2020-2035
  • Table 50: Western Europe Market Volume (Thousand MT) Forecast by Country, 2020-2035
  • Table 51: Western Europe Market Value (USD Million) Forecast by Seaweed Type, 2020-2035
  • Table 52: Western Europe Market Volume (Thousand MT) Forecast by Seaweed Type, 2020-2035
  • Table 53: Western Europe Market Value (USD Million) Forecast by Product Type, 2020-2035
  • Table 54: Western Europe Market Volume (Thousand MT) Forecast by Product Type, 2020-2035
  • Table 55: Western Europe Market Value (USD Million) Forecast by Sales Channel, 2020-2035
  • Table 56: Western Europe Market Volume (Thousand MT) Forecast by Sales Channel, 2020-2035
  • Table 57: Western Europe Market Value (USD Million) Forecast by Functionality/Claims, 2020-2035
  • Table 58: Western Europe Market Volume (Thousand MT) Forecast by Functionality/Claims, 2020-2035
  • Table 59: Western Europe Market Value (USD Million) Forecast by Form, 2020-2035
  • Table 60: Western Europe Market Volume (Thousand MT) Forecast by Form, 2020-2035
  • Table 61: Western Europe Market Value (USD Million) Forecast by Fermentation Method, 2020-2035
  • Table 62: Western Europe Market Volume (Thousand MT) Forecast by Fermentation Method, 2020-2035
  • Table 63: Western Europe Market Value (USD Million) Forecast by End Use, 2020-2035
  • Table 64: Western Europe Market Volume (Thousand MT) Forecast by End Use, 2020-2035
  • Table 65: Eastern Europe Market Value (USD Million) Forecast by Country, 2020-2035
  • Table 66: Eastern Europe Market Volume (Thousand MT) Forecast by Country, 2020-2035
  • Table 67: Eastern Europe Market Value (USD Million) Forecast by Seaweed Type, 2020-2035
  • Table 68: Eastern Europe Market Volume (Thousand MT) Forecast by Seaweed Type, 2020-2035
  • Table 69: Eastern Europe Market Value (USD Million) Forecast by Product Type, 2020-2035
  • Table 70: Eastern Europe Market Volume (Thousand MT) Forecast by Product Type, 2020-2035
  • Table 71: Eastern Europe Market Value (USD Million) Forecast by Sales Channel, 2020-2035
  • Table 72: Eastern Europe Market Volume (Thousand MT) Forecast by Sales Channel, 2020-2035
  • Table 73: Eastern Europe Market Value (USD Million) Forecast by Functionality/Claims, 2020-2035
  • Table 74: Eastern Europe Market Volume (Thousand MT) Forecast by Functionality/Claims, 2020-2035
  • Table 75: Eastern Europe Market Value (USD Million) Forecast by Form, 2020-2035
  • Table 76: Eastern Europe Market Volume (Thousand MT) Forecast by Form, 2020-2035
  • Table 77: Eastern Europe Market Value (USD Million) Forecast by Fermentation Method, 2020-2035
  • Table 78: Eastern Europe Market Volume (Thousand MT) Forecast by Fermentation Method, 2020-2035
  • Table 79: Eastern Europe Market Value (USD Million) Forecast by End Use, 2020-2035
  • Table 80: Eastern Europe Market Volume (Thousand MT) Forecast by End Use, 2020-2035
  • Table 81: East Asia Market Value (USD Million) Forecast by Country, 2020-2035
  • Table 82: East Asia Market Volume (Thousand MT) Forecast by Country, 2020-2035
  • Table 83: East Asia Market Value (USD Million) Forecast by Seaweed Type, 2020-2035
  • Table 84: East Asia Market Volume (Thousand MT) Forecast by Seaweed Type, 2020-2035
  • Table 85: East Asia Market Value (USD Million) Forecast by Product Type, 2020-2035
  • Table 86: East Asia Market Volume (Thousand MT) Forecast by Product Type, 2020-2035
  • Table 87: East Asia Market Value (USD Million) Forecast by Sales Channel, 2020-2035
  • Table 88: East Asia Market Volume (Thousand MT) Forecast by Sales Channel, 2020-2035
  • Table 89: East Asia Market Value (USD Million) Forecast by Functionality/Claims, 2020-2035
  • Table 90: East Asia Market Volume (Thousand MT) Forecast by Functionality/Claims, 2020-2035
  • Table 91: East Asia Market Value (USD Million) Forecast by Form, 2020-2035
  • Table 92: East Asia Market Volume (Thousand MT) Forecast by Form, 2020-2035
  • Table 93: East Asia Market Value (USD Million) Forecast by Fermentation Method, 2020-2035
  • Table 94: East Asia Market Volume (Thousand MT) Forecast by Fermentation Method, 2020-2035
  • Table 95: East Asia Market Value (USD Million) Forecast by End Use, 2020-2035
  • Table 96: East Asia Market Volume (Thousand MT) Forecast by End Use, 2020-2035
  • Table 97: South Asia & Pacific Market Value (USD Million) Forecast by Country, 2020-2035
  • Table 98: South Asia & Pacific Market Volume (Thousand MT) Forecast by Country, 2020-2035
  • Table 99: South Asia & Pacific Market Value (USD Million) Forecast by Seaweed Type, 2020-2035
  • Table 100: South Asia & Pacific Market Volume (Thousand MT) Forecast by Seaweed Type, 2020-2035
  • Table 101: South Asia & Pacific Market Value (USD Million) Forecast by Product Type, 2020-2035
  • Table 102: South Asia & Pacific Market Volume (Thousand MT) Forecast by Product Type, 2020-2035
  • Table 103: South Asia & Pacific Market Value (USD Million) Forecast by Sales Channel, 2020-2035
  • Table 104: South Asia & Pacific Market Volume (Thousand MT) Forecast by Sales Channel, 2020-2035
  • Table 105: South Asia & Pacific Market Value (USD Million) Forecast by Functionality/Claims, 2020-2035
  • Table 106: South Asia & Pacific Market Volume (Thousand MT) Forecast by Functionality/Claims, 2020-2035
  • Table 107: South Asia & Pacific Market Value (USD Million) Forecast by Form, 2020-2035
  • Table 108: South Asia & Pacific Market Volume (Thousand MT) Forecast by Form, 2020-2035
  • Table 109: South Asia & Pacific Market Value (USD Million) Forecast by Fermentation Method, 2020-2035
  • Table 110: South Asia & Pacific Market Volume (Thousand MT) Forecast by Fermentation Method, 2020-2035
  • Table 111: South Asia & Pacific Market Value (USD Million) Forecast by End Use, 2020-2035
  • Table 112: South Asia & Pacific Market Volume (Thousand MT) Forecast by End Use, 2020-2035
  • Table 113: Middle East and Africa Market Value (USD Million) Forecast by Country, 2020-2035
  • Table 114: Middle East and Africa Market Volume (Thousand MT) Forecast by Country, 2020-2035
  • Table 115: Middle East and Africa Market Value (USD Million) Forecast by Seaweed Type, 2020-2035
  • Table 116: Middle East and Africa Market Volume (Thousand MT) Forecast by Seaweed Type, 2020-2035
  • Table 117: Middle East and Africa Market Value (USD Million) Forecast by Product Type, 2020-2035
  • Table 118: Middle East and Africa Market Volume (Thousand MT) Forecast by Product Type, 2020-2035
  • Table 119: Middle East and Africa Market Value (USD Million) Forecast by Sales Channel, 2020-2035
  • Table 120: Middle East and Africa Market Volume (Thousand MT) Forecast by Sales Channel, 2020-2035
  • Table 121: Middle East and Africa Market Value (USD Million) Forecast by Functionality/Claims, 2020-2035
  • Table 122: Middle East and Africa Market Volume (Thousand MT) Forecast by Functionality/Claims, 2020-2035
  • Table 123: Middle East and Africa Market Value (USD Million) Forecast by Form, 2020-2035
  • Table 124: Middle East and Africa Market Volume (Thousand MT) Forecast by Form, 2020-2035
  • Table 125: Middle East and Africa Market Value (USD Million) Forecast by Fermentation Method, 2020-2035
  • Table 126: Middle East and Africa Market Volume (Thousand MT) Forecast by Fermentation Method, 2020-2035
  • Table 127: Middle East and Africa Market Value (USD Million) Forecast by End Use, 2020-2035
  • Table 128: Middle East and Africa Market Volume (Thousand MT) Forecast by End Use, 2020-2035

List of Figures

  • Figure 1: Global Market Volume (Thousand MT) Forecast 2020-2035
  • Figure 2: Global Market Pricing Analysis
  • Figure 3: Global Market Value (USD Million) Forecast 2020-2035
  • Figure 4: Global Market Value Share and BPS Analysis by Seaweed Type, 2025 and 2035
  • Figure 5: Global Market Y-o-Y Growth Comparison by Seaweed Type, 2025-2035
  • Figure 6: Global Market Attractiveness Analysis by Seaweed Type
  • Figure 7: Global Market Value Share and BPS Analysis by Product Type, 2025 and 2035
  • Figure 8: Global Market Y-o-Y Growth Comparison by Product Type, 2025-2035
  • Figure 9: Global Market Attractiveness Analysis by Product Type
  • Figure 10: Global Market Value Share and BPS Analysis by Sales Channel, 2025 and 2035
  • Figure 11: Global Market Y-o-Y Growth Comparison by Sales Channel, 2025-2035
  • Figure 12: Global Market Attractiveness Analysis by Sales Channel
  • Figure 13: Global Market Value Share and BPS Analysis by Functionality/Claims, 2025 and 2035
  • Figure 14: Global Market Y-o-Y Growth Comparison by Functionality/Claims, 2025-2035
  • Figure 15: Global Market Attractiveness Analysis by Functionality/Claims
  • Figure 16: Global Market Value Share and BPS Analysis by Form, 2025 and 2035
  • Figure 17: Global Market Y-o-Y Growth Comparison by Form, 2025-2035
  • Figure 18: Global Market Attractiveness Analysis by Form
  • Figure 19: Global Market Value Share and BPS Analysis by Fermentation Method, 2025 and 2035
  • Figure 20: Global Market Y-o-Y Growth Comparison by Fermentation Method, 2025-2035
  • Figure 21: Global Market Attractiveness Analysis by Fermentation Method
  • Figure 22: Global Market Value Share and BPS Analysis by End Use, 2025 and 2035
  • Figure 23: Global Market Y-o-Y Growth Comparison by End Use, 2025-2035
  • Figure 24: Global Market Attractiveness Analysis by End Use
  • Figure 25: Global Market Value (USD Million) Share and BPS Analysis by Region, 2025 and 2035
  • Figure 26: Global Market Y-o-Y Growth Comparison by Region, 2025-2035
  • Figure 27: Global Market Attractiveness Analysis by Region
  • Figure 28: North America Market Incremental $ Opportunity, 2025-2035
  • Figure 29: Latin America Market Incremental $ Opportunity, 2025-2035
  • Figure 30: Western Europe Market Incremental $ Opportunity, 2025-2035
  • Figure 31: Eastern Europe Market Incremental $ Opportunity, 2025-2035
  • Figure 32: East Asia Market Incremental $ Opportunity, 2025-2035
  • Figure 33: South Asia & Pacific Market Incremental $ Opportunity, 2025-2035
  • Figure 34: Middle East and Africa Market Incremental $ Opportunity, 2025-2035
  • Figure 35: North America Market Value Share and BPS Analysis by Country, 2025 and 2035
  • Figure 36: North America Market Value Share and BPS Analysis by Seaweed Type, 2025 and 2035
  • Figure 37: North America Market Y-o-Y Growth Comparison by Seaweed Type, 2025-2035
  • Figure 38: North America Market Attractiveness Analysis by Seaweed Type
  • Figure 39: North America Market Value Share and BPS Analysis by Product Type, 2025 and 2035
  • Figure 40: North America Market Y-o-Y Growth Comparison by Product Type, 2025-2035
  • Figure 41: North America Market Attractiveness Analysis by Product Type
  • Figure 42: North America Market Value Share and BPS Analysis by Sales Channel, 2025 and 2035
  • Figure 43: North America Market Y-o-Y Growth Comparison by Sales Channel, 2025-2035
  • Figure 44: North America Market Attractiveness Analysis by Sales Channel
  • Figure 45: North America Market Value Share and BPS Analysis by Functionality/Claims, 2025 and 2035
  • Figure 46: North America Market Y-o-Y Growth Comparison by Functionality/Claims, 2025-2035
  • Figure 47: North America Market Attractiveness Analysis by Functionality/Claims
  • Figure 48: North America Market Value Share and BPS Analysis by Form, 2025 and 2035
  • Figure 49: North America Market Y-o-Y Growth Comparison by Form, 2025-2035
  • Figure 50: North America Market Attractiveness Analysis by Form
  • Figure 51: North America Market Value Share and BPS Analysis by Fermentation Method, 2025 and 2035
  • Figure 52: North America Market Y-o-Y Growth Comparison by Fermentation Method, 2025-2035
  • Figure 53: North America Market Attractiveness Analysis by Fermentation Method
  • Figure 54: North America Market Value Share and BPS Analysis by End Use, 2025 and 2035
  • Figure 55: North America Market Y-o-Y Growth Comparison by End Use, 2025-2035
  • Figure 56: North America Market Attractiveness Analysis by End Use
  • Figure 57: Latin America Market Value Share and BPS Analysis by Country, 2025 and 2035
  • Figure 58: Latin America Market Value Share and BPS Analysis by Seaweed Type, 2025 and 2035
  • Figure 59: Latin America Market Y-o-Y Growth Comparison by Seaweed Type, 2025-2035
  • Figure 60: Latin America Market Attractiveness Analysis by Seaweed Type
  • Figure 61: Latin America Market Value Share and BPS Analysis by Product Type, 2025 and 2035
  • Figure 62: Latin America Market Y-o-Y Growth Comparison by Product Type, 2025-2035
  • Figure 63: Latin America Market Attractiveness Analysis by Product Type
  • Figure 64: Latin America Market Value Share and BPS Analysis by Sales Channel, 2025 and 2035
  • Figure 65: Latin America Market Y-o-Y Growth Comparison by Sales Channel, 2025-2035
  • Figure 66: Latin America Market Attractiveness Analysis by Sales Channel
  • Figure 67: Latin America Market Value Share and BPS Analysis by Functionality/Claims, 2025 and 2035
  • Figure 68: Latin America Market Y-o-Y Growth Comparison by Functionality/Claims, 2025-2035
  • Figure 69: Latin America Market Attractiveness Analysis by Functionality/Claims
  • Figure 70: Latin America Market Value Share and BPS Analysis by Form, 2025 and 2035
  • Figure 71: Latin America Market Y-o-Y Growth Comparison by Form, 2025-2035
  • Figure 72: Latin America Market Attractiveness Analysis by Form
  • Figure 73: Latin America Market Value Share and BPS Analysis by Fermentation Method, 2025 and 2035
  • Figure 74: Latin America Market Y-o-Y Growth Comparison by Fermentation Method, 2025-2035
  • Figure 75: Latin America Market Attractiveness Analysis by Fermentation Method
  • Figure 76: Latin America Market Value Share and BPS Analysis by End Use, 2025 and 2035
  • Figure 77: Latin America Market Y-o-Y Growth Comparison by End Use, 2025-2035
  • Figure 78: Latin America Market Attractiveness Analysis by End Use
  • Figure 79: Western Europe Market Value Share and BPS Analysis by Country, 2025 and 2035
  • Figure 80: Western Europe Market Value Share and BPS Analysis by Seaweed Type, 2025 and 2035
  • Figure 81: Western Europe Market Y-o-Y Growth Comparison by Seaweed Type, 2025-2035
  • Figure 82: Western Europe Market Attractiveness Analysis by Seaweed Type
  • Figure 83: Western Europe Market Value Share and BPS Analysis by Product Type, 2025 and 2035
  • Figure 84: Western Europe Market Y-o-Y Growth Comparison by Product Type, 2025-2035
  • Figure 85: Western Europe Market Attractiveness Analysis by Product Type
  • Figure 86: Western Europe Market Value Share and BPS Analysis by Sales Channel, 2025 and 2035
  • Figure 87: Western Europe Market Y-o-Y Growth Comparison by Sales Channel, 2025-2035
  • Figure 88: Western Europe Market Attractiveness Analysis by Sales Channel
  • Figure 89: Western Europe Market Value Share and BPS Analysis by Functionality/Claims, 2025 and 2035
  • Figure 90: Western Europe Market Y-o-Y Growth Comparison by Functionality/Claims, 2025-2035
  • Figure 91: Western Europe Market Attractiveness Analysis by Functionality/Claims
  • Figure 92: Western Europe Market Value Share and BPS Analysis by Form, 2025 and 2035
  • Figure 93: Western Europe Market Y-o-Y Growth Comparison by Form, 2025-2035
  • Figure 94: Western Europe Market Attractiveness Analysis by Form
  • Figure 95: Western Europe Market Value Share and BPS Analysis by Fermentation Method, 2025 and 2035
  • Figure 96: Western Europe Market Y-o-Y Growth Comparison by Fermentation Method, 2025-2035
  • Figure 97: Western Europe Market Attractiveness Analysis by Fermentation Method
  • Figure 98: Western Europe Market Value Share and BPS Analysis by End Use, 2025 and 2035
  • Figure 99: Western Europe Market Y-o-Y Growth Comparison by End Use, 2025-2035
  • Figure 100: Western Europe Market Attractiveness Analysis by End Use
  • Figure 101: Eastern Europe Market Value Share and BPS Analysis by Country, 2025 and 2035
  • Figure 102: Eastern Europe Market Value Share and BPS Analysis by Seaweed Type, 2025 and 2035
  • Figure 103: Eastern Europe Market Y-o-Y Growth Comparison by Seaweed Type, 2025-2035
  • Figure 104: Eastern Europe Market Attractiveness Analysis by Seaweed Type
  • Figure 105: Eastern Europe Market Value Share and BPS Analysis by Product Type, 2025 and 2035
  • Figure 106: Eastern Europe Market Y-o-Y Growth Comparison by Product Type, 2025-2035
  • Figure 107: Eastern Europe Market Attractiveness Analysis by Product Type
  • Figure 108: Eastern Europe Market Value Share and BPS Analysis by Sales Channel, 2025 and 2035
  • Figure 109: Eastern Europe Market Y-o-Y Growth Comparison by Sales Channel, 2025-2035
  • Figure 110: Eastern Europe Market Attractiveness Analysis by Sales Channel
  • Figure 111: Eastern Europe Market Value Share and BPS Analysis by Functionality/Claims, 2025 and 2035
  • Figure 112: Eastern Europe Market Y-o-Y Growth Comparison by Functionality/Claims, 2025-2035
  • Figure 113: Eastern Europe Market Attractiveness Analysis by Functionality/Claims
  • Figure 114: Eastern Europe Market Value Share and BPS Analysis by Form, 2025 and 2035
  • Figure 115: Eastern Europe Market Y-o-Y Growth Comparison by Form, 2025-2035
  • Figure 116: Eastern Europe Market Attractiveness Analysis by Form
  • Figure 117: Eastern Europe Market Value Share and BPS Analysis by Fermentation Method, 2025 and 2035
  • Figure 118: Eastern Europe Market Y-o-Y Growth Comparison by Fermentation Method, 2025-2035
  • Figure 119: Eastern Europe Market Attractiveness Analysis by Fermentation Method
  • Figure 120: Eastern Europe Market Value Share and BPS Analysis by End Use, 2025 and 2035
  • Figure 121: Eastern Europe Market Y-o-Y Growth Comparison by End Use, 2025-2035
  • Figure 122: Eastern Europe Market Attractiveness Analysis by End Use
  • Figure 123: East Asia Market Value Share and BPS Analysis by Country, 2025 and 2035
  • Figure 124: East Asia Market Value Share and BPS Analysis by Seaweed Type, 2025 and 2035
  • Figure 125: East Asia Market Y-o-Y Growth Comparison by Seaweed Type, 2025-2035
  • Figure 126: East Asia Market Attractiveness Analysis by Seaweed Type
  • Figure 127: East Asia Market Value Share and BPS Analysis by Product Type, 2025 and 2035
  • Figure 128: East Asia Market Y-o-Y Growth Comparison by Product Type, 2025-2035
  • Figure 129: East Asia Market Attractiveness Analysis by Product Type
  • Figure 130: East Asia Market Value Share and BPS Analysis by Sales Channel, 2025 and 2035
  • Figure 131: East Asia Market Y-o-Y Growth Comparison by Sales Channel, 2025-2035
  • Figure 132: East Asia Market Attractiveness Analysis by Sales Channel
  • Figure 133: East Asia Market Value Share and BPS Analysis by Functionality/Claims, 2025 and 2035
  • Figure 134: East Asia Market Y-o-Y Growth Comparison by Functionality/Claims, 2025-2035
  • Figure 135: East Asia Market Attractiveness Analysis by Functionality/Claims
  • Figure 136: East Asia Market Value Share and BPS Analysis by Form, 2025 and 2035
  • Figure 137: East Asia Market Y-o-Y Growth Comparison by Form, 2025-2035
  • Figure 138: East Asia Market Attractiveness Analysis by Form
  • Figure 139: East Asia Market Value Share and BPS Analysis by Fermentation Method, 2025 and 2035
  • Figure 140: East Asia Market Y-o-Y Growth Comparison by Fermentation Method, 2025-2035
  • Figure 141: East Asia Market Attractiveness Analysis by Fermentation Method
  • Figure 142: East Asia Market Value Share and BPS Analysis by End Use, 2025 and 2035
  • Figure 143: East Asia Market Y-o-Y Growth Comparison by End Use, 2025-2035
  • Figure 144: East Asia Market Attractiveness Analysis by End Use
  • Figure 145: South Asia & Pacific Market Value Share and BPS Analysis by Country, 2025 and 2035
  • Figure 146: South Asia & Pacific Market Value Share and BPS Analysis by Seaweed Type, 2025 and 2035
  • Figure 147: South Asia & Pacific Market Y-o-Y Growth Comparison by Seaweed Type, 2025-2035
  • Figure 148: South Asia & Pacific Market Attractiveness Analysis by Seaweed Type
  • Figure 149: South Asia & Pacific Market Value Share and BPS Analysis by Product Type, 2025 and 2035
  • Figure 150: South Asia & Pacific Market Y-o-Y Growth Comparison by Product Type, 2025-2035
  • Figure 151: South Asia & Pacific Market Attractiveness Analysis by Product Type
  • Figure 152: South Asia & Pacific Market Value Share and BPS Analysis by Sales Channel, 2025 and 2035
  • Figure 153: South Asia & Pacific Market Y-o-Y Growth Comparison by Sales Channel, 2025-2035
  • Figure 154: South Asia & Pacific Market Attractiveness Analysis by Sales Channel
  • Figure 155: South Asia & Pacific Market Value Share and BPS Analysis by Functionality/Claims, 2025 and 2035
  • Figure 156: South Asia & Pacific Market Y-o-Y Growth Comparison by Functionality/Claims, 2025-2035
  • Figure 157: South Asia & Pacific Market Attractiveness Analysis by Functionality/Claims
  • Figure 158: South Asia & Pacific Market Value Share and BPS Analysis by Form, 2025 and 2035
  • Figure 159: South Asia & Pacific Market Y-o-Y Growth Comparison by Form, 2025-2035
  • Figure 160: South Asia & Pacific Market Attractiveness Analysis by Form
  • Figure 161: South Asia & Pacific Market Value Share and BPS Analysis by Fermentation Method, 2025 and 2035
  • Figure 162: South Asia & Pacific Market Y-o-Y Growth Comparison by Fermentation Method, 2025-2035
  • Figure 163: South Asia & Pacific Market Attractiveness Analysis by Fermentation Method
  • Figure 164: South Asia & Pacific Market Value Share and BPS Analysis by End Use, 2025 and 2035
  • Figure 165: South Asia & Pacific Market Y-o-Y Growth Comparison by End Use, 2025-2035
  • Figure 166: South Asia & Pacific Market Attractiveness Analysis by End Use
  • Figure 167: Middle East and Africa Market Value Share and BPS Analysis by Country, 2025 and 2035
  • Figure 168: Middle East and Africa Market Value Share and BPS Analysis by Seaweed Type, 2025 and 2035
  • Figure 169: Middle East and Africa Market Y-o-Y Growth Comparison by Seaweed Type, 2025-2035
  • Figure 170: Middle East and Africa Market Attractiveness Analysis by Seaweed Type
  • Figure 171: Middle East and Africa Market Value Share and BPS Analysis by Product Type, 2025 and 2035
  • Figure 172: Middle East and Africa Market Y-o-Y Growth Comparison by Product Type, 2025-2035
  • Figure 173: Middle East and Africa Market Attractiveness Analysis by Product Type
  • Figure 174: Middle East and Africa Market Value Share and BPS Analysis by Sales Channel, 2025 and 2035
  • Figure 175: Middle East and Africa Market Y-o-Y Growth Comparison by Sales Channel, 2025-2035
  • Figure 176: Middle East and Africa Market Attractiveness Analysis by Sales Channel
  • Figure 177: Middle East and Africa Market Value Share and BPS Analysis by Functionality/Claims, 2025 and 2035
  • Figure 178: Middle East and Africa Market Y-o-Y Growth Comparison by Functionality/Claims, 2025-2035
  • Figure 179: Middle East and Africa Market Attractiveness Analysis by Functionality/Claims
  • Figure 180: Middle East and Africa Market Value Share and BPS Analysis by Form, 2025 and 2035
  • Figure 181: Middle East and Africa Market Y-o-Y Growth Comparison by Form, 2025-2035
  • Figure 182: Middle East and Africa Market Attractiveness Analysis by Form
  • Figure 183: Middle East and Africa Market Value Share and BPS Analysis by Fermentation Method, 2025 and 2035
  • Figure 184: Middle East and Africa Market Y-o-Y Growth Comparison by Fermentation Method, 2025-2035
  • Figure 185: Middle East and Africa Market Attractiveness Analysis by Fermentation Method
  • Figure 186: Middle East and Africa Market Value Share and BPS Analysis by End Use, 2025 and 2035
  • Figure 187: Middle East and Africa Market Y-o-Y Growth Comparison by End Use, 2025-2035
  • Figure 188: Middle East and Africa Market Attractiveness Analysis by End Use
  • Figure 189: Global Market - Tier Structure Analysis
  • Figure 190: Global Market - Company Share Analysis

Frequently Asked Questions

What is the projected industry value of the fermented seaweed market in 2025?

The industry is projected to reach USD 354.5 million in 2025.

What is the expected global CAGR for the fermented seaweed market from 2025 to 2035?

The industry is expected to grow at a CAGR of 4.3% from 2025 to 2035.

Which segment is expected to dominate the fermented seaweed market in 2025?

Brown seaweed is expected to capture 46% in 2025.

Which region is forecasted to show significant growth in the fermented seaweed market by 2025?

East Asia is projected to account for over 40% of the total volume in 2025.

What is the forecasted industry value of the fermented seaweed market by 2035?

The industry is projected to reach USD 540.1 million by 2035.

Explore Similar Insights

Future Market Insights

Fermented Seaweed Market