Reports

- Global Locations -

Headquarters

Future Market Insights, Inc.

Christiana Corporate, 200
Continental Drive, Suite 401,
Newark, Delaware - 19713,
United States

T: +1-845-579-5705

Americas

Future Market Insights, Inc.

616 Corporate Way, Suite 2-9018,
Valley Cottage, NY 10989, United States

T: +1-347-918-3531

MEA

Future Market Insights

1602-6 Jumeirah Bay X2 Tower, Plot No: JLT-PH2-X2A,
Jumeirah Lakes Towers, Dubai,
United Arab Emirates

Europe

Future Market Insights

3rd Floor, 207 Regent Street,
W1B 3HH London
United Kingdom

T: + 44 (0) 20 8123 9659
D: +44 (0) 20 3287 4268

Asia Pacific

Future Market Insights

IndiaLand Global Tech Park, Unit UG-1, Behind Grand HighStreet, Phase 1, Hinjawadi, MH, Pune – 411057, India

Fermented Dairy Products Market Outlook (2022 to 2032)

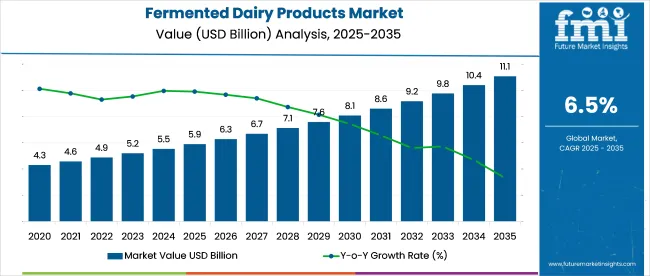
The global fermented dairy products market is expected to accumulate US$ 4,920.5 Million in value by 2022-end. During the forecast period ranging from 2022 to 2032, a CAGR worth 8.5% has been projected for the market, with an expected closing value worth US$ 11,125.2 Million. During the 2016 to 2021 historical period, the industry grew at a value CAGR worth 8.1%.

Mounting Consumers' shifting consumer preferences toward healthier products in developed countries like the United States & Germany and extension of the shelf life of dairy products boost the demand for fermented dairy products.

Attributes Key Statistics
Global Fermented Dairy Products Market CAGR (2022 to 2032) 8.5%
Anticipated Market Value (2022) US$ 4,920.5 Million
Global Fermented Dairy Products Market (2032) US$ 11,125.2 Million
Global Fermented Dairy Products Market Attraction Consumers' shifting consumer preferences toward healthier products are fueling the growth of the fermented dairy products market. Since these products contain probiotic bacteria, they provide numerous health benefits.

Fermented dairy products are assumed to contain probiotics, which provide a range of health benefits. Fermented dairy products are thought to be probiotic bacteria delivery vehicles. Fermented dairy products are produced by inoculating culture with an enzyme that converts lactose to lactic acid.

This milk inoculation and fermentation process encompasses a broad product offering in the form of fermented dairy products. Many substances are released during the conversion process, including acetic acid, diacetyl, and acetaldehyde, which contribute to the products' distinctive taste and aroma.

During the fermentation process of kefir and koumiss, ethanol alcohol is also produced. Lactobacillus and bifidobacterium are the most prevalent bacterial strains used in the fermentation process. These fermented dairy products not only add flavor but also texture and consistency to a wide range of products such as sauces and dips.

Don't pay for what you don't need

Customize your report by selecting specific countries or regions and save 30%!

What are the Factors Propelling the Global Fermented Dairy Products Market?

Consumers' shifting consumer preferences toward healthier products are fueling the growth of the fermented dairy products market. Since these products contain probiotic bacteria, they provide numerous health benefits.

The most significant health benefits provided by these products are improved digestibility and the probiotic bacteria present in these products helping to suppress certain pathogens via their antibacterial properties. Furthermore, lactose-intolerant people prefer fermented dairy products because they are more easily digestible than unfermented milk.

However, apart from health benefits, the fermentation process helps to extend the shelf life of dairy products while also enhancing their taste and aroma. As a result, the market's significant growth can be attributed to the versatile properties of fermented dairy products.

What are the Factors Hampering the Global Fermented Dairy Products Market?

The challenge for fermented dairy manufacturers and retailers, however, is determining the appropriate culture and enzyme for the fermentation process of dairy products. Because not all strains contribute to increased shelf life and health benefits.

Nandini Roy Choudhury

Principal Consultant

Talk to Analyst

Find your sweet spots for generating winning opportunities in this market.

Why is North America Emerging as an Opportunistic Fermented Dairy Products Market?

North America holds a substantial market share. The market for fermented dairy products is broadening attributed to increasing health consciousness and shifting consumption patterns. North America has seen a higher rate of traction for various types of fermented milk products. Some of the key macroeconomic factors, such as rising healthcare awareness and per capita income, also play an important role in the overall growth of the fermented milk market over the upcoming decades. North America is expected to account for a 27.4% share of the fermented dairy products market in 2022.

Milk and other dairy products are the major sources of artery-clogging saturated fat in the American diet. Milk products contain cholesterol as well. Fat, saturated fat and cholesterol-rich diets lead to a higher risk of disease, which is still the leading cause of death in the United States. Cheese is incredibly harmful. The fat content of typical cheeses is 70%.

In 2021, North America was the second-largest market for dairy ingredients. According to the Centers for Disease Control and Prevention, heart disease is the leading cause of death in the United States, with approximately 6,47, 000 Americans dying from it each year, compensating for one out of every four deaths. As a result, the rising prevalence of cardiovascular and other diseases around North America is expected to create lucrative opportunities for a healthy diet, propelling the dairy ingredients market in North America over the forecast period.

Why is Asia Pacific Emerging as an Opportunistic Fermented Dairy Products Market?

The increasing customer enthusiasm for therapeutic products containing probiotic bacteria is spurring market growth. The Asia Pacific is an enticing region for the expansion of the fermented dairy products market. Traditionally, dairy products were fermented, but with newer technologies and product innovations, consumers are gravitating toward commercialized fermented dairy products.

Because of the excess supply of fermented milk products such as butter and cheese in fast food restaurants. Furthermore, the region has seen a huge influx of millennials, who are the major recipients of fermented milk products. As a result, the growing millennial population is expected to provide lucrative fermented milk market opportunities.

Get the data you need at a Fraction of the cost

Personalize your report by choosing insights you need
and save 40%!

Why is Europe Emerging as an Opportunistic Fermented Dairy Products Market?

The United Kingdom has the largest market share attributed to the combination of a large dairy industry as well as a large population base of fermented dairy product consumers. Italy is the fastest-growing region as a consequence of the rising use of these products in food products as well as rising demand.

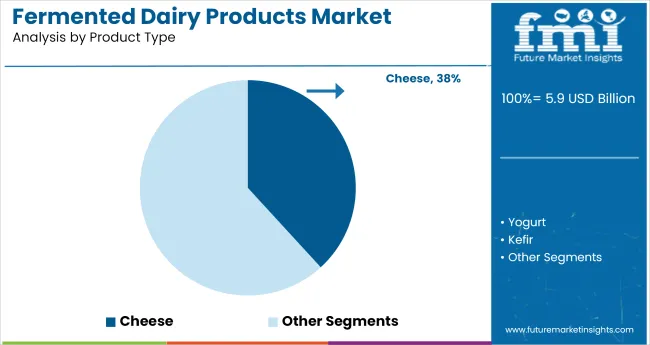
Cheese products have a substantial market share due to their use as a primary ingredient in many food products such as bakery products and fast foods, as well as an ingredient in many Italian dishes, breakfast foods, and so on. Flavored milk products are anticipated to boost the fastest, owing to rising economic growth for value-added milk products such as organic milk and smoothies, as well as for flavor enhancement in Europe.

Koninklijke DSM N.V., Biopro, Novozymes, Kerry Inc, Archer Daniels, Midland Company, Ingredion Incorporated, and Arla Foods Ingredients Group P/S are a few of the key market manufacturers in the Europe market. These companies are exploring ambitious corporate sustainability goals by developing the latest products. In 2022, Europe is likely to acquire a 38.5% share in Fermented Dairy Products and is estimated to retain the governing expansion throughout the forecast period, states Future Market Insights.

How Start-ups are Adding Value to the Global Fermented Dairy Products Market?

The swelling dispersion of start-ups in the Fermented Dairy Products market has increased product quality and enhanced global sales. However, to gain a competitive edge, new start-ups are working on innovative developments and launching new products such as:

  • In the year 2015, Urban Platter was established. In November 2021. It has launched Vegan cheeses comprising plant-based ingredients such as soybeans, peas, cashews, coconut, or almonds are fermented by bacterial cultures to produce a distinct, tangy, and tart flavor. Furthermore, the aging process creates and concentrates delectable flavors.

Who are the Key Players in the Global Fermented Dairy Products Market?

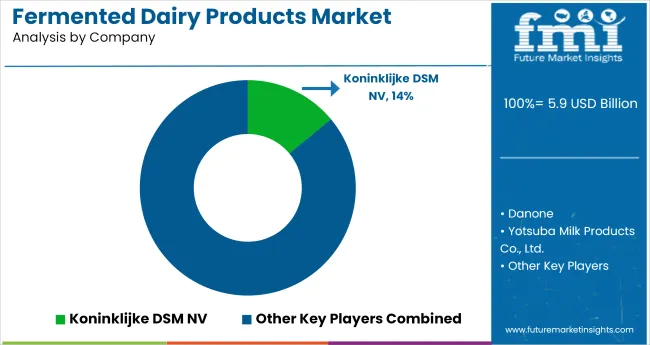
Some of the prominent manufacturers identified in the global dairy creamers market include Koninklijke DSM NV, Danone, Yotsuba Milk Products Co., Ltd., Chobani, LLC, General Mills Inc., Dairy Manufacturers, Inc., and Meadow Foods Limited. Companies are working on novel developments and launching new products such as:

  • DSM launched four new Delvo®Guard cultures in February 2022, all of which obtain high levels of quality and safety. They delay yeast and mold growth and have no (or limited) impact on the fermentation process and time when delivered as Direct Vat Cultures (DVC). It meets rising customer demand for fresh yogurts that are beneficial for health and potentially reduce food waste.
  • General Mills, a multinational food manufacturer based in the United States, announced in August 2021 that it is using fermentation to produce plant-based cheeses. Renegade Creamery, the company's development brand, will market the products.

Report Scope

Report Attribute Details
Growth Rate CAGR of 8.5% from 2022 to 2032
Market Value in 2022 US$ 4,920.5 Million
Market Value in 2032 US$ 11,125.2 Million
Base Year for Estimation 2021
Historical Period 2016 to 2021
Forecast Period 2022 to 2032
Quantitative Units Revenue in US$ Million and CAGR from 2022 to 2032
Report Coverage Revenue Forecast, Volume Forecast, Company Ranking, Competitive Landscape, Growth Factors, Trends, and Pricing Analysis
Segments Covered
  • Product Type
  • Ingredients
  • Sales Channel
  • Region
Regions Covered
  • North America
  • Latin America
  • Europe
  • Asia Pacific
  • Middle East and Africa
Key Countries Profiled
  • United States of America
  • Canada
  • Brazil
  • Mexico
  • Germany
  • United Kingdom
  • France
  • Spain
  • Italy
  • China
  • Japan
  • South Korea
  • India
  • Malaysia
  • Singapore
  • Australia
  • New Zealand
  • GCC Countries
  • South Africa
  • Israel
Key Companies Profiled
  • Koninklijke DSM NV
  • Danone
  • Yotsuba Milk Products Co., Ltd.
  • Chobani, LLC
  • General Mills Inc.
  • Dairy Manufacturers, Inc.
  • Meadow Foods Limited
  • Nestle Health Science
  • Parmolat S.p.A
  • Arla Foods Ingredients Group P/S
Customization Available Upon Request

Key Segments Covered in the Fermented Dairy Products Industry Report

Fermented Dairy Products Market by Product Type:

  • Fermented Dairy Yogurt
  • Fermented Dairy Kefir
  • Fermented Dairy Cheese
  • Fermented Dairy Sour Cream
  • Fermented Dairy Buttermilk
  • Other Fermented Dairy Product Types

Fermented Dairy Products Market by Ingredients:

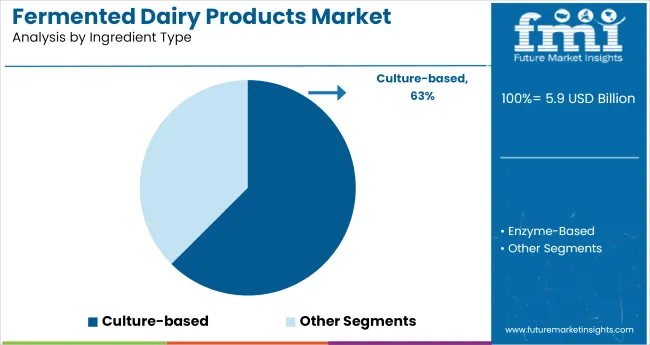
  • Culture-Fermented Dairy Products
  • Enzymes Fermented Dairy Products

Fermented Dairy Products Market by Sales Channel:

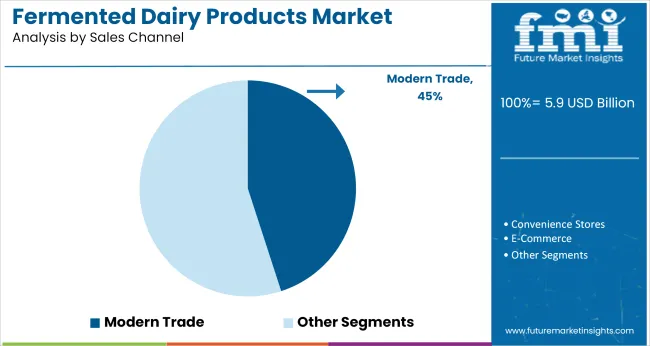
  • Fermented Dairy Products Sales via Modern Trade
  • Fermented Dairy Products Sales via Convenience Stores
  • Fermented Dairy Products Sales via E-commerce
  • Fermented Dairy Products Sales via Other Retail Formats

Fermented Dairy Products Market by Region:

  • North America Fermented Dairy Products Market
  • Latin America Fermented Dairy Products Market
  • Europe Fermented Dairy Products Market
  • Asia Pacific Fermented Dairy Products Market
  • Middle East & Africa Fermented Dairy Products Market

Frequently Asked Questions

What is the estimated market value of the fermented dairy products market in 2022?

The global fermented dairy products market is likely to value at US$ 4,920.5 Million in 2022.

What is the projected CAGR of the fermented dairy products market until 2032?

The fermented dairy products market is estimated to grow at a CAGR of 8.5% from 2022 to 2032.

What is the expected market value of the global Fermented Dairy Products market by 2032?

The fermented dairy products market is predicted to procure US$ 11,125.2 Million by 2032.

Table of Content

1. Executive Summary | Fermented Dairy Products Market

    1.1. Global Market Outlook

    1.2. Demand-side Trends

    1.3. Supply-side Trends

    1.4. Technology Roadmap Analysis

    1.5. Analysis and Recommendations

2. Market Overview

    2.1. Market Coverage / Taxonomy

    2.2. Market Definition / Scope / Limitations

3. Market Background

    3.1. Market Dynamics

        3.1.1. Drivers

        3.1.2. Restraints

        3.1.3. Opportunity

        3.1.4. Trends

    3.2. Scenario Forecast

        3.2.1. Demand in Optimistic Scenario

        3.2.2. Demand in Likely Scenario

        3.2.3. Demand in Conservative Scenario

    3.3. Opportunity Map Analysis

    3.4. Product Life Cycle Analysis

    3.5. Supply Chain Analysis

        3.5.1. Supply Side Participants and their Roles

            3.5.1.1. Producers

            3.5.1.2. Mid-Level Participants (Traders/ Agents/ Brokers)

            3.5.1.3. Wholesalers and Distributors

        3.5.2. Value Added and Value Created at Node in the Supply Chain

        3.5.3. List of Raw Material Suppliers

        3.5.4. List of Existing and Potential Buyers

    3.6. Investment Feasibility Matrix

    3.7. Value Chain Analysis

        3.7.1. Profit Margin Analysis

        3.7.2. Wholesalers and Distributors

        3.7.3. Retailers

    3.8. PESTLE and Porter’s Analysis

    3.9. Regulatory Landscape

        3.9.1. By Key Regions

        3.9.2. By Key Countries

    3.10. Regional Parent Market Outlook

    3.11. Production and Consumption Statistics

    3.12. Import and Export Statistics

4. Global Market Analysis 2016 to 2021 and Forecast, 2022 to 2032

    4.1. Historical Market Size Value (US$ Million) & Volume (Tons) Analysis, 2016 to 2021

    4.2. Current and Future Market Size Value (US$ Million) & Volume (Tons) Projections, 2022 to 2032

        4.2.1. Y-o-Y Growth Trend Analysis

        4.2.2. Absolute $ Opportunity Analysis

5. Global Market Analysis 2016 to 2021 and Forecast 2022 to 2032, By Product Type

    5.1. Introduction / Key Findings

    5.2. Historical Market Size Value (US$ Million) & Volume (Tons) Analysis ByProduct Type, 2016 to 2021

    5.3. Current and Future Market Size Value (US$ Million) & Volume (Tons) Analysis and Forecast By Product Type, 2022 to 2032

        5.3.1. Yogurt

        5.3.2. Kefir

        5.3.3. Cheese

        5.3.4. Sour Cream

        5.3.5. Buttermilk

    5.4. Y-o-Y Growth Trend Analysis ByProduct Type, 2016 to 2021

    5.5. Absolute $ Opportunity Analysis ByProduct Type, 2022 to 2032

6. Global Market Analysis 2016 to 2021 and Forecast 2022 to 2032, By Ingredients

    6.1. Introduction / Key Findings

    6.2. Historical Market Size Value (US$ Million) & Volume (Tons) Analysis By Ingredients, 2016 to 2021

    6.3. Current and Future Market Size Value (US$ Million) & Volume (Tons) Analysis and Forecast By Ingredients, 2022 to 2032

        6.3.1. Culture

        6.3.2. Enzymes

    6.4. Y-o-Y Growth Trend Analysis By Ingredients, 2016 to 2021

    6.5. Absolute $ Opportunity Analysis By Ingredients, 2022 to 2032

7. Global Market Analysis 2016 to 2021 and Forecast 2022 to 2032, By Sales Channel

    7.1. Introduction / Key Findings

    7.2. Historical Market Size Value (US$ Million) & Volume (Tons) Analysis By Sales Channel, 2016 to 2021

    7.3. Current and Future Market Size Value (US$ Million) & Volume (Tons) Analysis and Forecast By Sales Channel, 2022 to 2032

        7.3.1. Modern Trade

        7.3.2. Convenience Stores

        7.3.3. E-commerce

    7.4. Y-o-Y Growth Trend Analysis By Sales Channel, 2016 to 2021

    7.5. Absolute $ Opportunity Analysis By Sales Channel, 2022 to 2032

8. Global Market Analysis 2016 to 2021 and Forecast 2022 to 2032, By Region

    8.1. Introduction

    8.2. Historical Market Size Value (US$ Million) & Volume (Tons) Analysis By Region, 2016 to 2021

    8.3. Current Market Size Value (US$ Million) & Volume (Tons) Analysis and Forecast By Region, 2022 to 2032

        8.3.1. North America

        8.3.2. Latin America

        8.3.3. Europe

        8.3.4. Asia Pacific

        8.3.5. Middle East and Africa

    8.4. Market Attractiveness Analysis By Region

9. North America Market Analysis 2016 to 2021 and Forecast 2022 to 2032, By Country

    9.1. Historical Market Size Value (US$ Million) & Volume (Tons) Trend Analysis By Market Taxonomy, 2016 to 2021

    9.2. Market Size Value (US$ Million) & Volume (Tons) Forecast By Market Taxonomy, 2022 to 2032

        9.2.1. By Country

            9.2.1.1. United States of America

            9.2.1.2. Canada

        9.2.2. ByProduct Type

        9.2.3. By Ingredients

        9.2.4. By Sales Channel

    9.3. Market Attractiveness Analysis

        9.3.1. By Country

        9.3.2. ByProduct Type

        9.3.3. By Ingredients

        9.3.4. By Sales Channel

    9.4. Key Takeaways

10. Latin America Market Analysis 2016 to 2021 and Forecast 2022 to 2032, By Country

    10.1. Historical Market Size Value (US$ Million) & Volume (Tons) Trend Analysis By Market Taxonomy, 2016 to 2021

    10.2. Market Size Value (US$ Million) & Volume (Tons) Forecast By Market Taxonomy, 2022 to 2032

        10.2.1. By Country

            10.2.1.1. Brazil

            10.2.1.2. Mexico

            10.2.1.3. Rest of Latin America

        10.2.2. ByProduct Type

        10.2.3. By Ingredients

        10.2.4. By Sales Channel

    10.3. Market Attractiveness Analysis

        10.3.1. By Country

        10.3.2. ByProduct Type

        10.3.3. By Ingredients

        10.3.4. By Sales Channel

    10.4. Key Takeaways

11. Europe Market Analysis 2016 to 2021 and Forecast 2022 to 2032, By Country

    11.1. Historical Market Size Value (US$ Million) & Volume (Tons) Trend Analysis By Market Taxonomy, 2016 to 2021

    11.2. Market Size Value (US$ Million) & Volume (Tons) Forecast By Market Taxonomy, 2022 to 2032

        11.2.1. By Country

            11.2.1.1. Germany

            11.2.1.2. United Kingdom

            11.2.1.3. France

            11.2.1.4. Spain

            11.2.1.5. Italy

            11.2.1.6. Rest of Europe

        11.2.2. ByProduct Type

        11.2.3. By Ingredients

        11.2.4. By Sales Channel

    11.3. Market Attractiveness Analysis

        11.3.1. By Country

        11.3.2. ByProduct Type

        11.3.3. By Ingredients

        11.3.4. By Sales Channel

    11.4. Key Takeaways

12. Asia Pacific Market Analysis 2016 to 2021 and Forecast 2022 to 2032, By Country

    12.1. Historical Market Size Value (US$ Million) & Volume (Tons) Trend Analysis By Market Taxonomy, 2016 to 2021

    12.2. Market Size Value (US$ Million) & Volume (Tons) Forecast By Market Taxonomy, 2022 to 2032

        12.2.1. By Country

            12.2.1.1. China

            12.2.1.2. Japan

            12.2.1.3. South Korea

            12.2.1.4. Malaysia

            12.2.1.5. Singapore

            12.2.1.6. Australia

            12.2.1.7. New Zealand

            12.2.1.8. Rest of Asia-Pacific

        12.2.2. ByProduct Type

        12.2.3. By Ingredients

        12.2.4. By Sales Channel

    12.3. Market Attractiveness Analysis

        12.3.1. By Country

        12.3.2. ByProduct Type

        12.3.3. By Ingredients

        12.3.4. By Sales Channel

    12.4. Key Takeaways

13. Middle East and Africa Market Analysis 2016 to 2021 and Forecast 2022 to 2032, By Country

    13.1. Historical Market Size Value (US$ Million) & Volume (Tons) Trend Analysis By Market Taxonomy, 2016 to 2021

    13.2. Market Size Value (US$ Million) & Volume (Tons) Forecast By Market Taxonomy, 2022 to 2032

        13.2.1. By Country

            13.2.1.1. GCC Countries

            13.2.1.2. South Africa

            13.2.1.3. Israel

            13.2.1.4. Rest of Middle East and Africa

        13.2.2. ByProduct Type

        13.2.3. By Ingredients

        13.2.4. By Sales Channel

    13.3. Market Attractiveness Analysis

        13.3.1. By Country

        13.3.2. ByProduct Type

        13.3.3. By Ingredients

        13.3.4. By Sales Channel

    13.4. Key Takeaways

14. Key Countries Market Analysis

    14.1. United States of America

        14.1.1. Pricing Analysis

        14.1.2. Market Share Analysis, 2021

            14.1.2.1. ByProduct Type

            14.1.2.2. By Ingredients

            14.1.2.3. By Sales Channel

    14.2. Canada

        14.2.1. Pricing Analysis

        14.2.2. Market Share Analysis, 2021

            14.2.2.1. ByProduct Type

            14.2.2.2. By Ingredients

            14.2.2.3. By Sales Channel

    14.3. Brazil

        14.3.1. Pricing Analysis

        14.3.2. Market Share Analysis, 2021

            14.3.2.1. ByProduct Type

            14.3.2.2. By Ingredients

            14.3.2.3. By Sales Channel

    14.4. Mexico

        14.4.1. Pricing Analysis

        14.4.2. Market Share Analysis, 2021

            14.4.2.1. ByProduct Type

            14.4.2.2. By Ingredients

            14.4.2.3. By Sales Channel

    14.5. Germany

        14.5.1. Pricing Analysis

        14.5.2. Market Share Analysis, 2021

            14.5.2.1. ByProduct Type

            14.5.2.2. By Ingredients

            14.5.2.3. By Sales Channel

    14.6. United Kingdom

        14.6.1. Pricing Analysis

        14.6.2. Market Share Analysis, 2021

            14.6.2.1. ByProduct Type

            14.6.2.2. By Ingredients

            14.6.2.3. By Sales Channel

    14.7. France

        14.7.1. Pricing Analysis

        14.7.2. Market Share Analysis, 2021

            14.7.2.1. ByProduct Type

            14.7.2.2. By Ingredients

            14.7.2.3. By Sales Channel

    14.8. Spain

        14.8.1. Pricing Analysis

        14.8.2. Market Share Analysis, 2021

            14.8.2.1. ByProduct Type

            14.8.2.2. By Ingredients

            14.8.2.3. By Sales Channel

    14.9. Italy

        14.9.1. Pricing Analysis

        14.9.2. Market Share Analysis, 2021

            14.9.2.1. ByProduct Type

            14.9.2.2. By Ingredients

            14.9.2.3. By Sales Channel

    14.10. China

        14.10.1. Pricing Analysis

        14.10.2. Market Share Analysis, 2021

            14.10.2.1. ByProduct Type

            14.10.2.2. By Ingredients

            14.10.2.3. By Sales Channel

    14.11. Japan

        14.11.1. Pricing Analysis

        14.11.2. Market Share Analysis, 2021

            14.11.2.1. ByProduct Type

            14.11.2.2. By Ingredients

            14.11.2.3. By Sales Channel

    14.12. South Korea

        14.12.1. Pricing Analysis

        14.12.2. Market Share Analysis, 2021

            14.12.2.1. ByProduct Type

            14.12.2.2. By Ingredients

            14.12.2.3. By Sales Channel

    14.13. Malaysia

        14.13.1. Pricing Analysis

        14.13.2. Market Share Analysis, 2021

            14.13.2.1. ByProduct Type

            14.13.2.2. By Ingredients

            14.13.2.3. By Sales Channel

    14.14. Singapore

        14.14.1. Pricing Analysis

        14.14.2. Market Share Analysis, 2021

            14.14.2.1. ByProduct Type

            14.14.2.2. By Ingredients

            14.14.2.3. By Sales Channel

    14.15. Australia

        14.15.1. Pricing Analysis

        14.15.2. Market Share Analysis, 2021

            14.15.2.1. ByProduct Type

            14.15.2.2. By Ingredients

            14.15.2.3. By Sales Channel

    14.16. New Zealand

        14.16.1. Pricing Analysis

        14.16.2. Market Share Analysis, 2021

            14.16.2.1. ByProduct Type

            14.16.2.2. By Ingredients

            14.16.2.3. By Sales Channel

    14.17. GCC Countries

        14.17.1. Pricing Analysis

        14.17.2. Market Share Analysis, 2021

            14.17.2.1. ByProduct Type

            14.17.2.2. By Ingredients

            14.17.2.3. By Sales Channel

    14.18. South Africa

        14.18.1. Pricing Analysis

        14.18.2. Market Share Analysis, 2021

            14.18.2.1. ByProduct Type

            14.18.2.2. By Ingredients

            14.18.2.3. By Sales Channel

    14.19. Israel

        14.19.1. Pricing Analysis

        14.19.2. Market Share Analysis, 2021

            14.19.2.1. ByProduct Type

            14.19.2.2. By Ingredients

            14.19.2.3. By Sales Channel

15. Market Structure Analysis

    15.1. Competition Dashboard

    15.2. Competition Benchmarking

    15.3. Market Share Analysis of Top Players

        15.3.1. By Regional

        15.3.2. ByProduct Type

        15.3.3. By Ingredients

        15.3.4. By Sales Channel

16. Competition Analysis

    16.1. Competition Deep Dive

        16.1.1. Koninklijke DSM NV

            16.1.1.1. Overview

            16.1.1.2. Product Portfolio

            16.1.1.3. Profitability by Market Segments

            16.1.1.4. Sales Footprint

            16.1.1.5. Strategy Overview

                16.1.1.5.1. Marketing Strategy

                16.1.1.5.2. Product Strategy

                16.1.1.5.3. Channel Strategy

        16.1.2. Danone

            16.1.2.1. Overview

            16.1.2.2. Product Portfolio

            16.1.2.3. Profitability by Market Segments

            16.1.2.4. Sales Footprint

            16.1.2.5. Strategy Overview

                16.1.2.5.1. Marketing Strategy

                16.1.2.5.2. Product Strategy

                16.1.2.5.3. Channel Strategy

        16.1.3. Yotsuba Milk Products Co., Ltd.

            16.1.3.1. Overview

            16.1.3.2. Product Portfolio

            16.1.3.3. Profitability by Market Segments

            16.1.3.4. Sales Footprint

            16.1.3.5. Strategy Overview

                16.1.3.5.1. Marketing Strategy

                16.1.3.5.2. Product Strategy

                16.1.3.5.3. Channel Strategy

        16.1.4. Chobani, LLC

            16.1.4.1. Overview

            16.1.4.2. Product Portfolio

            16.1.4.3. Profitability by Market Segments

            16.1.4.4. Sales Footprint

            16.1.4.5. Strategy Overview

                16.1.4.5.1. Marketing Strategy

                16.1.4.5.2. Product Strategy

                16.1.4.5.3. Channel Strategy

        16.1.5. General Mills Inc.

            16.1.5.1. Overview

            16.1.5.2. Product Portfolio

            16.1.5.3. Profitability by Market Segments

            16.1.5.4. Sales Footprint

            16.1.5.5. Strategy Overview

                16.1.5.5.1. Marketing Strategy

                16.1.5.5.2. Product Strategy

                16.1.5.5.3. Channel Strategy

        16.1.6. Dairy Manufacturers, Inc.

            16.1.6.1. Overview

            16.1.6.2. Product Portfolio

            16.1.6.3. Profitability by Market Segments

            16.1.6.4. Sales Footprint

            16.1.6.5. Strategy Overview

                16.1.6.5.1. Marketing Strategy

                16.1.6.5.2. Product Strategy

                16.1.6.5.3. Channel Strategy

        16.1.7. Meadow Foods Limited

            16.1.7.1. Overview

            16.1.7.2. Product Portfolio

            16.1.7.3. Profitability by Market Segments

            16.1.7.4. Sales Footprint

            16.1.7.5. Strategy Overview

                16.1.7.5.1. Marketing Strategy

                16.1.7.5.2. Product Strategy

                16.1.7.5.3. Channel Strategy

        16.1.8. Nestle Health Science

            16.1.8.1. Overview

            16.1.8.2. Product Portfolio

            16.1.8.3. Profitability by Market Segments

            16.1.8.4. Sales Footprint

            16.1.8.5. Strategy Overview

                16.1.8.5.1. Marketing Strategy

                16.1.8.5.2. Product Strategy

                16.1.8.5.3. Channel Strategy

        16.1.9. Parmalat S.p.A

            16.1.9.1. Overview

            16.1.9.2. Product Portfolio

            16.1.9.3. Profitability by Market Segments

            16.1.9.4. Sales Footprint

            16.1.9.5. Strategy Overview

                16.1.9.5.1. Marketing Strategy

                16.1.9.5.2. Product Strategy

                16.1.9.5.3. Channel Strategy

        16.1.10. Arla Foods Ingredients Group P/S

            16.1.10.1. Overview

            16.1.10.2. Product Portfolio

            16.1.10.3. Profitability by Market Segments

            16.1.10.4. Sales Footprint

            16.1.10.5. Strategy Overview

                16.1.10.5.1. Marketing Strategy

                16.1.10.5.2. Product Strategy

                16.1.10.5.3. Channel Strategy

17. Assumptions & Acronyms Used

18. Research Methodology

Don't pay for what you don't need

Customize your report by selecting specific countries or regions and save 30%!

List of Tables

Table 1: Global Market Value (US$ Million) Forecast by Region, 2016 to 2032

Table 2: Global Market Volume (Tons) Forecast by Region, 2016 to 2032

Table 3: Global Market Value (US$ Million) Forecast by Product Type, 2016 to 2032

Table 4: Global Market Volume (Tons) Forecast by Product Type, 2016 to 2032

Table 5: Global Market Value (US$ Million) Forecast by Ingredients, 2016 to 2032

Table 6: Global Market Volume (Tons) Forecast by Ingredients, 2016 to 2032

Table 7: Global Market Value (US$ Million) Forecast by Sales Channel, 2016 to 2032

Table 8: Global Market Volume (Tons) Forecast by Sales Channel, 2016 to 2032

Table 9: North America Market Value (US$ Million) Forecast by Country, 2016 to 2032

Table 10: North America Market Volume (Tons) Forecast by Country, 2016 to 2032

Table 11: North America Market Value (US$ Million) Forecast by Product Type, 2016 to 2032

Table 12: North America Market Volume (Tons) Forecast by Product Type, 2016 to 2032

Table 13: North America Market Value (US$ Million) Forecast by Ingredients, 2016 to 2032

Table 14: North America Market Volume (Tons) Forecast by Ingredients, 2016 to 2032

Table 15: North America Market Value (US$ Million) Forecast by Sales Channel, 2016 to 2032

Table 16: North America Market Volume (Tons) Forecast by Sales Channel, 2016 to 2032

Table 17: Latin America Market Value (US$ Million) Forecast by Country, 2016 to 2032

Table 18: Latin America Market Volume (Tons) Forecast by Country, 2016 to 2032

Table 19: Latin America Market Value (US$ Million) Forecast by Product Type, 2016 to 2032

Table 20: Latin America Market Volume (Tons) Forecast by Product Type, 2016 to 2032

Table 21: Latin America Market Value (US$ Million) Forecast by Ingredients, 2016 to 2032

Table 22: Latin America Market Volume (Tons) Forecast by Ingredients, 2016 to 2032

Table 23: Latin America Market Value (US$ Million) Forecast by Sales Channel, 2016 to 2032

Table 24: Latin America Market Volume (Tons) Forecast by Sales Channel, 2016 to 2032

Table 25: Europe Market Value (US$ Million) Forecast by Country, 2016 to 2032

Table 26: Europe Market Volume (Tons) Forecast by Country, 2016 to 2032

Table 27: Europe Market Value (US$ Million) Forecast by Product Type, 2016 to 2032

Table 28: Europe Market Volume (Tons) Forecast by Product Type, 2016 to 2032

Table 29: Europe Market Value (US$ Million) Forecast by Ingredients, 2016 to 2032

Table 30: Europe Market Volume (Tons) Forecast by Ingredients, 2016 to 2032

Table 31: Europe Market Value (US$ Million) Forecast by Sales Channel, 2016 to 2032

Table 32: Europe Market Volume (Tons) Forecast by Sales Channel, 2016 to 2032

Table 33: Asia Pacific Market Value (US$ Million) Forecast by Country, 2016 to 2032

Table 34: Asia Pacific Market Volume (Tons) Forecast by Country, 2016 to 2032

Table 35: Asia Pacific Market Value (US$ Million) Forecast by Product Type, 2016 to 2032

Table 36: Asia Pacific Market Volume (Tons) Forecast by Product Type, 2016 to 2032

Table 37: Asia Pacific Market Value (US$ Million) Forecast by Ingredients, 2016 to 2032

Table 38: Asia Pacific Market Volume (Tons) Forecast by Ingredients, 2016 to 2032

Table 39: Asia Pacific Market Value (US$ Million) Forecast by Sales Channel, 2016 to 2032

Table 40: Asia Pacific Market Volume (Tons) Forecast by Sales Channel, 2016 to 2032

Table 41: Middle East and Africa Market Value (US$ Million) Forecast by Country, 2016 to 2032

Table 42: Middle East and Africa Market Volume (Tons) Forecast by Country, 2016 to 2032

Table 43: Middle East and Africa Market Value (US$ Million) Forecast by Product Type, 2016 to 2032

Table 44: Middle East and Africa Market Volume (Tons) Forecast by Product Type, 2016 to 2032

Table 45: Middle East and Africa Market Value (US$ Million) Forecast by Ingredients, 2016 to 2032

Table 46: Middle East and Africa Market Volume (Tons) Forecast by Ingredients, 2016 to 2032

Table 47: Middle East and Africa Market Value (US$ Million) Forecast by Sales Channel, 2016 to 2032

Table 48: Middle East and Africa Market Volume (Tons) Forecast by Sales Channel, 2016 to 2032
Nandini Roy Choudhury

Principal Consultant

Talk to Analyst

Find your sweet spots for generating winning opportunities in this market.

List of Charts

Figure 1: Global Market Value (US$ Million) by Product Type, 2022 to 2032

Figure 2: Global Market Value (US$ Million) by Ingredients, 2022 to 2032

Figure 3: Global Market Value (US$ Million) by Sales Channel, 2022 to 2032

Figure 4: Global Market Value (US$ Million) by Region, 2022 to 2032

Figure 5: Global Market Value (US$ Million) Analysis by Region, 2016 to 2032

Figure 6: Global Market Volume (Tons) Analysis by Region, 2016 to 2032

Figure 7: Global Market Value Share (%) and BPS Analysis by Region, 2022 to 2032

Figure 8: Global Market Y-o-Y Growth (%) Projections by Region, 2022 to 2032

Figure 9: Global Market Value (US$ Million) Analysis by Product Type, 2016 to 2032

Figure 10: Global Market Volume (Tons) Analysis by Product Type, 2016 to 2032

Figure 11: Global Market Value Share (%) and BPS Analysis by Product Type, 2022 to 2032

Figure 12: Global Market Y-o-Y Growth (%) Projections by Product Type, 2022 to 2032

Figure 13: Global Market Value (US$ Million) Analysis by Ingredients, 2016 to 2032

Figure 14: Global Market Volume (Tons) Analysis by Ingredients, 2016 to 2032

Figure 15: Global Market Value Share (%) and BPS Analysis by Ingredients, 2022 to 2032

Figure 16: Global Market Y-o-Y Growth (%) Projections by Ingredients, 2022 to 2032

Figure 17: Global Market Value (US$ Million) Analysis by Sales Channel, 2016 to 2032

Figure 18: Global Market Volume (Tons) Analysis by Sales Channel, 2016 to 2032

Figure 19: Global Market Value Share (%) and BPS Analysis by Sales Channel, 2022 to 2032

Figure 20: Global Market Y-o-Y Growth (%) Projections by Sales Channel, 2022 to 2032

Figure 21: Global Market Attractiveness by Product Type, 2022 to 2032

Figure 22: Global Market Attractiveness by Ingredients, 2022 to 2032

Figure 23: Global Market Attractiveness by Sales Channel, 2022 to 2032

Figure 24: Global Market Attractiveness by Region, 2022 to 2032

Figure 25: North America Market Value (US$ Million) by Product Type, 2022 to 2032

Figure 26: North America Market Value (US$ Million) by Ingredients, 2022 to 2032

Figure 27: North America Market Value (US$ Million) by Sales Channel, 2022 to 2032

Figure 28: North America Market Value (US$ Million) by Country, 2022 to 2032

Figure 29: North America Market Value (US$ Million) Analysis by Country, 2016 to 2032

Figure 30: North America Market Volume (Tons) Analysis by Country, 2016 to 2032

Figure 31: North America Market Value Share (%) and BPS Analysis by Country, 2022 to 2032

Figure 32: North America Market Y-o-Y Growth (%) Projections by Country, 2022 to 2032

Figure 33: North America Market Value (US$ Million) Analysis by Product Type, 2016 to 2032

Figure 34: North America Market Volume (Tons) Analysis by Product Type, 2016 to 2032

Figure 35: North America Market Value Share (%) and BPS Analysis by Product Type, 2022 to 2032

Figure 36: North America Market Y-o-Y Growth (%) Projections by Product Type, 2022 to 2032

Figure 37: North America Market Value (US$ Million) Analysis by Ingredients, 2016 to 2032

Figure 38: North America Market Volume (Tons) Analysis by Ingredients, 2016 to 2032

Figure 39: North America Market Value Share (%) and BPS Analysis by Ingredients, 2022 to 2032

Figure 40: North America Market Y-o-Y Growth (%) Projections by Ingredients, 2022 to 2032

Figure 41: North America Market Value (US$ Million) Analysis by Sales Channel, 2016 to 2032

Figure 42: North America Market Volume (Tons) Analysis by Sales Channel, 2016 to 2032

Figure 43: North America Market Value Share (%) and BPS Analysis by Sales Channel, 2022 to 2032

Figure 44: North America Market Y-o-Y Growth (%) Projections by Sales Channel, 2022 to 2032

Figure 45: North America Market Attractiveness by Product Type, 2022 to 2032

Figure 46: North America Market Attractiveness by Ingredients, 2022 to 2032

Figure 47: North America Market Attractiveness by Sales Channel, 2022 to 2032

Figure 48: North America Market Attractiveness by Country, 2022 to 2032

Figure 49: Latin America Market Value (US$ Million) by Product Type, 2022 to 2032

Figure 50: Latin America Market Value (US$ Million) by Ingredients, 2022 to 2032

Figure 51: Latin America Market Value (US$ Million) by Sales Channel, 2022 to 2032

Figure 52: Latin America Market Value (US$ Million) by Country, 2022 to 2032

Figure 53: Latin America Market Value (US$ Million) Analysis by Country, 2016 to 2032

Figure 54: Latin America Market Volume (Tons) Analysis by Country, 2016 to 2032

Figure 55: Latin America Market Value Share (%) and BPS Analysis by Country, 2022 to 2032

Figure 56: Latin America Market Y-o-Y Growth (%) Projections by Country, 2022 to 2032

Figure 57: Latin America Market Value (US$ Million) Analysis by Product Type, 2016 to 2032

Figure 58: Latin America Market Volume (Tons) Analysis by Product Type, 2016 to 2032

Figure 59: Latin America Market Value Share (%) and BPS Analysis by Product Type, 2022 to 2032

Figure 60: Latin America Market Y-o-Y Growth (%) Projections by Product Type, 2022 to 2032

Figure 61: Latin America Market Value (US$ Million) Analysis by Ingredients, 2016 to 2032

Figure 62: Latin America Market Volume (Tons) Analysis by Ingredients, 2016 to 2032

Figure 63: Latin America Market Value Share (%) and BPS Analysis by Ingredients, 2022 to 2032

Figure 64: Latin America Market Y-o-Y Growth (%) Projections by Ingredients, 2022 to 2032

Figure 65: Latin America Market Value (US$ Million) Analysis by Sales Channel, 2016 to 2032

Figure 66: Latin America Market Volume (Tons) Analysis by Sales Channel, 2016 to 2032

Figure 67: Latin America Market Value Share (%) and BPS Analysis by Sales Channel, 2022 to 2032

Figure 68: Latin America Market Y-o-Y Growth (%) Projections by Sales Channel, 2022 to 2032

Figure 69: Latin America Market Attractiveness by Product Type, 2022 to 2032

Figure 70: Latin America Market Attractiveness by Ingredients, 2022 to 2032

Figure 71: Latin America Market Attractiveness by Sales Channel, 2022 to 2032

Figure 72: Latin America Market Attractiveness by Country, 2022 to 2032

Figure 73: Europe Market Value (US$ Million) by Product Type, 2022 to 2032

Figure 74: Europe Market Value (US$ Million) by Ingredients, 2022 to 2032

Figure 75: Europe Market Value (US$ Million) by Sales Channel, 2022 to 2032

Figure 76: Europe Market Value (US$ Million) by Country, 2022 to 2032

Figure 77: Europe Market Value (US$ Million) Analysis by Country, 2016 to 2032

Figure 78: Europe Market Volume (Tons) Analysis by Country, 2016 to 2032

Figure 79: Europe Market Value Share (%) and BPS Analysis by Country, 2022 to 2032

Figure 80: Europe Market Y-o-Y Growth (%) Projections by Country, 2022 to 2032

Figure 81: Europe Market Value (US$ Million) Analysis by Product Type, 2016 to 2032

Figure 82: Europe Market Volume (Tons) Analysis by Product Type, 2016 to 2032

Figure 83: Europe Market Value Share (%) and BPS Analysis by Product Type, 2022 to 2032

Figure 84: Europe Market Y-o-Y Growth (%) Projections by Product Type, 2022 to 2032

Figure 85: Europe Market Value (US$ Million) Analysis by Ingredients, 2016 to 2032

Figure 86: Europe Market Volume (Tons) Analysis by Ingredients, 2016 to 2032

Figure 87: Europe Market Value Share (%) and BPS Analysis by Ingredients, 2022 to 2032

Figure 88: Europe Market Y-o-Y Growth (%) Projections by Ingredients, 2022 to 2032

Figure 89: Europe Market Value (US$ Million) Analysis by Sales Channel, 2016 to 2032

Figure 90: Europe Market Volume (Tons) Analysis by Sales Channel, 2016 to 2032

Figure 91: Europe Market Value Share (%) and BPS Analysis by Sales Channel, 2022 to 2032

Figure 92: Europe Market Y-o-Y Growth (%) Projections by Sales Channel, 2022 to 2032

Figure 93: Europe Market Attractiveness by Product Type, 2022 to 2032

Figure 94: Europe Market Attractiveness by Ingredients, 2022 to 2032

Figure 95: Europe Market Attractiveness by Sales Channel, 2022 to 2032

Figure 96: Europe Market Attractiveness by Country, 2022 to 2032

Figure 97: Asia Pacific Market Value (US$ Million) by Product Type, 2022 to 2032

Figure 98: Asia Pacific Market Value (US$ Million) by Ingredients, 2022 to 2032

Figure 99: Asia Pacific Market Value (US$ Million) by Sales Channel, 2022 to 2032

Figure 100: Asia Pacific Market Value (US$ Million) by Country, 2022 to 2032

Figure 101: Asia Pacific Market Value (US$ Million) Analysis by Country, 2016 to 2032

Figure 102: Asia Pacific Market Volume (Tons) Analysis by Country, 2016 to 2032

Figure 103: Asia Pacific Market Value Share (%) and BPS Analysis by Country, 2022 to 2032

Figure 104: Asia Pacific Market Y-o-Y Growth (%) Projections by Country, 2022 to 2032

Figure 105: Asia Pacific Market Value (US$ Million) Analysis by Product Type, 2016 to 2032

Figure 106: Asia Pacific Market Volume (Tons) Analysis by Product Type, 2016 to 2032

Figure 107: Asia Pacific Market Value Share (%) and BPS Analysis by Product Type, 2022 to 2032

Figure 108: Asia Pacific Market Y-o-Y Growth (%) Projections by Product Type, 2022 to 2032

Figure 109: Asia Pacific Market Value (US$ Million) Analysis by Ingredients, 2016 to 2032

Figure 110: Asia Pacific Market Volume (Tons) Analysis by Ingredients, 2016 to 2032

Figure 111: Asia Pacific Market Value Share (%) and BPS Analysis by Ingredients, 2022 to 2032

Figure 112: Asia Pacific Market Y-o-Y Growth (%) Projections by Ingredients, 2022 to 2032

Figure 113: Asia Pacific Market Value (US$ Million) Analysis by Sales Channel, 2016 to 2032

Figure 114: Asia Pacific Market Volume (Tons) Analysis by Sales Channel, 2016 to 2032

Figure 115: Asia Pacific Market Value Share (%) and BPS Analysis by Sales Channel, 2022 to 2032

Figure 116: Asia Pacific Market Y-o-Y Growth (%) Projections by Sales Channel, 2022 to 2032

Figure 117: Asia Pacific Market Attractiveness by Product Type, 2022 to 2032

Figure 118: Asia Pacific Market Attractiveness by Ingredients, 2022 to 2032

Figure 119: Asia Pacific Market Attractiveness by Sales Channel, 2022 to 2032

Figure 120: Asia Pacific Market Attractiveness by Country, 2022 to 2032

Figure 121: Middle East and Africa Market Value (US$ Million) by Product Type, 2022 to 2032

Figure 122: Middle East and Africa Market Value (US$ Million) by Ingredients, 2022 to 2032

Figure 123: Middle East and Africa Market Value (US$ Million) by Sales Channel, 2022 to 2032

Figure 124: Middle East and Africa Market Value (US$ Million) by Country, 2022 to 2032

Figure 125: Middle East and Africa Market Value (US$ Million) Analysis by Country, 2016 to 2032

Figure 126: Middle East and Africa Market Volume (Tons) Analysis by Country, 2016 to 2032

Figure 127: Middle East and Africa Market Value Share (%) and BPS Analysis by Country, 2022 to 2032

Figure 128: Middle East and Africa Market Y-o-Y Growth (%) Projections by Country, 2022 to 2032

Figure 129: Middle East and Africa Market Value (US$ Million) Analysis by Product Type, 2016 to 2032

Figure 130: Middle East and Africa Market Volume (Tons) Analysis by Product Type, 2016 to 2032

Figure 131: Middle East and Africa Market Value Share (%) and BPS Analysis by Product Type, 2022 to 2032

Figure 132: Middle East and Africa Market Y-o-Y Growth (%) Projections by Product Type, 2022 to 2032

Figure 133: Middle East and Africa Market Value (US$ Million) Analysis by Ingredients, 2016 to 2032

Figure 134: Middle East and Africa Market Volume (Tons) Analysis by Ingredients, 2016 to 2032

Figure 135: Middle East and Africa Market Value Share (%) and BPS Analysis by Ingredients, 2022 to 2032

Figure 136: Middle East and Africa Market Y-o-Y Growth (%) Projections by Ingredients, 2022 to 2032

Figure 137: Middle East and Africa Market Value (US$ Million) Analysis by Sales Channel, 2016 to 2032

Figure 138: Middle East and Africa Market Volume (Tons) Analysis by Sales Channel, 2016 to 2032

Figure 139: Middle East and Africa Market Value Share (%) and BPS Analysis by Sales Channel, 2022 to 2032

Figure 140: Middle East and Africa Market Y-o-Y Growth (%) Projections by Sales Channel, 2022 to 2032

Figure 141: Middle East and Africa Market Attractiveness by Product Type, 2022 to 2032

Figure 142: Middle East and Africa Market Attractiveness by Ingredients, 2022 to 2032

Figure 143: Middle East and Africa Market Attractiveness by Sales Channel, 2022 to 2032

Figure 144: Middle East and Africa Market Attractiveness by Country, 2022 to 2032

Recommendations

Food and Beverage

Fermented Protein Market

Published : August 2023

Food and Beverage

Fermented Dairy Ingredients Market

Published : July 2023

Food and Beverage

Fermented Cucumber Market

Published : February 2023

Food and Beverage

Fermented Ingredients Market

Published : January 2023

Explore Food and Beverage Insights

View Reports

Fermented Dairy Products Market