Dairy-Based Dressings Market Size and Share Forecast Outlook 2025 to 2035

The global dairy-based dressings market is expected to reach USD 883.5 million in 2025, with projections indicating a rise to USD 1,307.8 million by 2035. This growth reflects a steady CAGR of 4.0% over the forecast period.
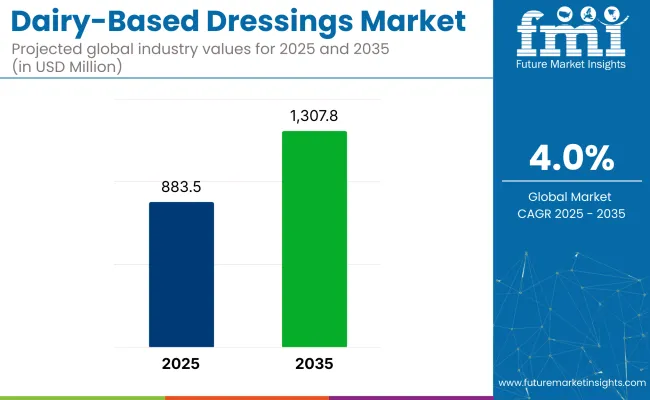
Quick Stats of the Dairy-Based Dressings Market

  • Market Value (2025): USD 883.5 million
  • Forecast Value (2035): USD 1,307.8 million
  • Global CAGR (2025 to 2035): 4.0%
  • Leading Segment in 2025: Cheese-based Dressings (~61.4% share)
  • Key Growth Region: North America
  • Key Players: TIC Gums, Inc., DairyChem Inc., Litehouse Inc., Darifair Foods, Inc., Santini Foods, Inc., Tate & Lyle PLC

Dairy Based Dressings Market

Attributes Description
Estimated Global Industry Size (2025E) USD 883.5 million
Projected Global Value (2035F) USD 1,307.8 million
Value-based CAGR (2025 to 2035) 4.0%

The industry expansion is fueled by increased consumer preference for creamy and rich textures in salad dressings, sauces, and dips, along with a growing focus on premium and indulgent ingredients. In North America, these dressings are firmly established in both retail and foodservice sectors. In Europe, these dressings remain popular in traditional cuisines. For instance, in Italy and France, they complement regional salads and dips.

The industry is held in a focused yet influential position across its parent industries. Within the salad and dip dressings industry, approximately 25-30% is accounted for, driven by consumer demand for creamy textures and tangy profiles. In the broader sauces, dips, and spreads category, a share of 8-10% is estimated, with competition being faced alongside mayonnaise, vinaigrettes, and plant-based alternatives.

Within the convenience and packaged food industry, around 2-3% is comprised, representing a small but growing condiment segment. In the functional and clean-label food space, about 5-7% is contributed, favored for probiotic and yogurt-based formulations. Across the global dairy products industry, its share is under 1%, reflecting niche usage relative to milk, cheese, and yogurt, but being noted for value-added innovation.

A November 2024 report by Tate & Lyle highlighted that the future of food and beverage brands relies on creating exciting textures and adapting to changes in taste and mouthfeel. Marina Di Migueli, Global Marketing Director, Texturants and Proteins at Tate & Lyle, emphasized that successful brands will be those innovating textures and anticipating consumer trends.

She noted that factors like climate change, busy lifestyles, and the demand for healthier alternatives will drive reformulations. Brands that focus on maintaining great-tasting, adaptable products will thrive in the evolving industry.

Analyzing Dairy-Based Dressings Market by Top Investment Segments

The dairy-based dressings market is segmented by product type into creamy salad dressings, Greek yogurt salad dressing, vinaigrette salad dressing, organic salad dressings, and vinaigrettes. By storage type, the segmentation includes refrigerated and shelf-stable forms.

By distribution channel, products are distributed hrough online and offline channels. The industry is segmented as North America, Latin America, Western Europe, Eastern Europe, East Asia, South Asia & Pacific, Central Asia, Russia and Belarus, Balkan & Baltic Countries, Middle East and Africa.

Cheese-Based Dressings Lead Consumer Demand

Cheese-based dressings are projected to hold 61.4% industry share in 2025. These dressings are highly favored due to their rich, creamy texture and versatile flavor profile. The demand for cheese-based dressings remains robust, especially in the foodservice and retail sectors, where indulgence-driven consumers continue to seek creamy options.

Leading brands like Hidden Valley, Ken’s Foods, and Primal Kitchen are investing heavily in this segment to cater to the growing preference for familiar, flavorful dressing options. Cheese-based dressings are also being innovated upon with variations such as reduced-fat and organic versions, aligning with changing consumer needs.
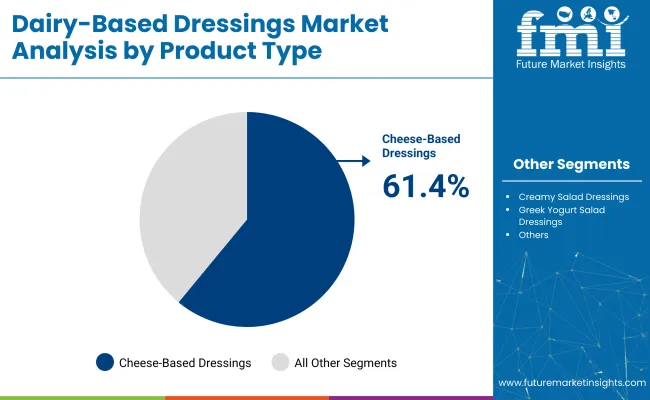
  • Cheese-based dressings are favored for their creamy texture and rich flavor.
  • Leading brands like Hidden Valley and Ken’s Foods dominate the segment.
  • Innovations in reduced-fat and organic variants are being introduced to meet demand.

Dairy Based Dressings Market Analysis By Product Type

Buttermilk and Yogurt-Based Dressings Gaining Popularity

Buttermilk and yogurt-based dressings are projected to capture 38.6% industry share in 2025. These dressings are becoming increasingly popular as consumers seek healthier, lighter alternatives to traditional cheese-based dressings.

Brands like Chobani and Danone are capitalizing on these trends by introducing yogurt-based dressings to appeal to the health-conscious demographic. These dressings offer functional benefits while maintaining a flavorful profile, leading to their rising demand across retail and foodservice channels

  • Buttermilk and yogurt-based dressings are preferred for their lower fat content and health benefits.
  • Companies like Chobani and Danone are leading innovation in this segment.
  • Functional benefits, such as probiotics, are driving increased consumer interest.

Offline Distribution Channels Remain Dominant

Offline distribution channels are expected to account for 55% industry share in 2025. These channels continue to dominate the industry. Grocery stores remain the primary venues for purchasing these products, allowing consumers to interact with products in-store before making a purchase.

The offline retail space is characterized by its strong consumer loyalty, with leading brands benefiting from strategic placements in high-traffic locations. Retail giants like Walmart and Target contribute significantly to this segment’s growth by offering easy access to popular dairy-based dressings, helping to maintain offline channels as the main source of product sales.
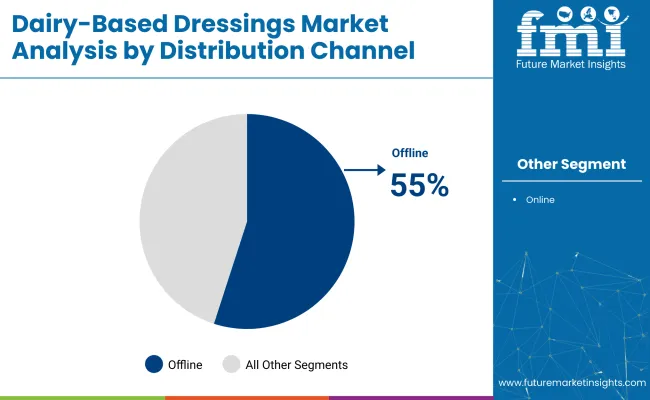
  • Offline retail stores are dominant in driving dairy-based sauces sales.
  • Supermarkets and grocery stores remain the top venues for purchasing.
  • Major retailers like Walmart and Target boost product availability.

Dairy Based Dressings Market Analysis By Distribution Channel

Top Dairy-Based Dressings Market Dynamics

The industry is being expanded due to growing consumer demand for healthier, convenient meal options and innovative flavors. The rising popularity of yogurt-based and protein-enriched dressings, along with clean-label trends, is supporting growth. However, challenges, including price volatility and competition from plant-based alternatives, are being faced by manufacturers.

Drivers of Growth in Dairy-Based Dressings

Growth is driven by the increasing demand for low-fat, organic, and clean-label products among health-conscious consumers. The preference for rich, creamy flavors remains strong, especially in the foodservice sector. Additionally, the rising consumption of salads and vegetables as part of healthier diets is fueling demand for complementary dressings. These evolving dietary trends are positively impacting the industry, leading to continued growth in the segment.

  • The demand for protein-enriched and yogurt-based dressings is rising.
  • There is an expansion in the availability of clean-label, organic, and natural ingredient offerings.
  • Continuous innovation is occurring in flavors, packaging, and functional ingredients.

Challenges Hindering Dairy-Based Dressings Growth

Rising awareness of lactose intolerance and growing demand for dairy-free alternatives are challenging the industry. The shift toward plant-based dressings limits growth, while concerns over high calorie and fat content deter health-conscious consumers. Additionally, the higher pricing of organic dairy dressings makes them less appealing to price-sensitive buyers.
  • Growing demand for vegan and plant-based dressings slows the growth of dairy-based options.
  • Dairy-based dressings are seen as high in fat and calories, which puts off health-conscious buyers.
  • High prices of organic and dairy-based sauces make them less attractive to budget-conscious consumers.

Analyzing Top Countries Driving, Distributing, and Consuming Dairy-Based Dressings

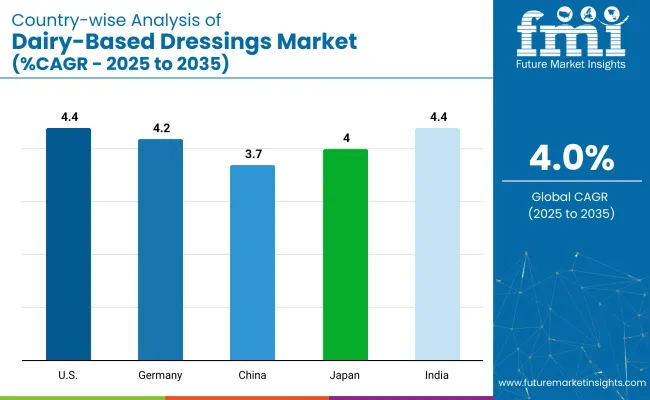
Country Wise Analysis Of Dairy Based Dressings Market

Countries CAGR (2025 to 20235)
USA 4.4%
Germany 4.2%
China 3.7%
Japan 4%
India 4.4%

The dairy-based dressings market is projected to grow at a global CAGR of 4.0% from 2025 to 2035. In OECD countries, steady growth is observed, with the United States leading at 4.4%, followed by Germany at 4.2%, Japan at 4.0%, and the EU at 4.0%. These markets are characterized by mature demand, premium product consumption, and health-conscious trends.

In BRICS nations, a higher growth potential is seen, with India’s market expanding at 4.4%, driven by rising incomes and urbanization. China’s growth rate is slower at 3.7%, while other BRICS countries like South Africa, Brazil, and Russia also show lower but consistent growth.

The report covers detailed analysis of 40+ countries and the top five countries have been shared as a reference.

Analysis of dairy-based dressings market in the United States

The sales of the dairy-based dressings market in the United States are set to grow at a CAGR of 4.4% through 2035, driven by increasing demand for premium, health-conscious, and clean-label products. Consumers are gravitating toward innovative dairy-based sauces featuring flavors like avocado, bacon, and spicy variations.

Ready-to-eat options have become staples in retail and fast-food sectors, further fueling growth. Consumer preferences in the USA differ from those in regions such as the UK, Germany, Japan, China, and India, where traditional flavors and packaging are more prominent. The USA market is characterized by strong demand for high-quality ingredients and convenience.

  • Premium and health-conscious products are fueling demand for dressings in the USA.
  • Innovative flavors like avocado and bacon are gaining popularity.
  • Ethical sourcing and ingredient quality are shaping consumer purchasing choices in the USA.

Demand forecast for the dairy-based dressings market in Germany

Demand for dairy-based dressings in Germany is expanding at a CAGR of 4.2% from 2025 to 2035, driven by rising demand for healthier food options and growing interest in international cuisines. German consumers are leaning toward organic and clean-label dairy-based dressings, focusing on high-quality ingredients and minimal processing.

Retail and foodservice sectors are experiencing significant growth, particularly for ready-to-eat products. While traditional flavors remain popular, there is a rising demand for innovative and international flavors. Increased shelf space and expanding retail chains are enhancing product visibility, helping dairy-based dressings reach a broader audience.

  • Organic and clean-label dressings are gaining popularity in Germany.
  • A blend of traditional flavors and international varieties is emerging in the industry.
  • Retail and foodservice sectors are driving demand for ready-to-eat products.

Growth analysis of dairy-based dressings market in China

China is anticipated to grow at a CAGR of 3.7% through 2035, driven by increasing exposure to Western food trends and rising demand for convenient, packaged products. The industry is fueled by rising disposable incomes and the growing middle class, particularly in large cities.

Despite this, per capita consumption remains significantly lower than global averages, indicating substantial untapped potential, especially in semi-rural and rural areas. E-commerce platforms and international retail chains are playing an important role in improving product accessibility and expanding industry reach. While dairy-based sauce sare still considered niche products, demand continues to grow as Chinese consumers experiment with new flavors.

  • Disposable income and higher living standards are driving dairy-based dressings adoption in China.
  • Dairy-based dressings remain niche but are expanding in larger cities.
  • E-commerce and international retail chains are expanding product accessibility.

Future outlook for dairy-based dressings market in Japan

Sales of dairy-based dressings in Japan are projected to grow at a CAGR of 4.0% from 2025 to 2035, fueled by increasing awareness of healthier food options and the popularity of Western-style salads. Consumers are becoming more health-conscious and opting for dairy-based sauces with natural ingredients and fewer additives.

Retail and foodservice sectors are playing a key role in expanding the industry, particularly through ready-to-eat options. International flavor sare increasingly being adopted, complementing traditional Japanese dressings while maintaining the health-conscious trend. As more retail outlets introduce these innovative products, the demand for dairy-based dressings is expected to continue growing, with a focus on convenience and high-quality ingredients.

  • Health-conscious trends are boosting the demand for natural, clean-label dairy-based sauces in Japan.
  • There is rising interest in Western-style salads and international flavors.
  • Retail and foodservice sectors are central to the industry’s growth in Japan.

Dairy-based dressings market growth outlook in India

The Indian market is expected to grow at a CAGR of 4.4% from 2025 to 2035, driven by rising disposable incomes and increased exposure to global food trends. The shift from traditional food consumption to packaged, ready-to-eat options is gaining momentum, especially among the middle class in cities.

These dressings are growing in popularity, particularly among younger consumers seeking Western-style convenience foods. Despite these trends, per capita consumption remains significantly below the global average, highlighting considerable untapped potential in rural and semi-rural areas. Organized retail chains and e-commerce platforms are increasing product availability, contributing to wider consumer awareness and industry growth.

  • Rising disposable incomes are key drivers for dairy-based dressings in India.
  • Younger, health-conscious consumers are increasingly adopting Western food trends.
  • The industry remains underdeveloped, with significant growth potential in rural and semi-rural areas.

Leading Dairy-Based Dressings Suppliers

The dairy-based dressing brands are retooling their strategies to align with consumer demand for healthier option and flavor innovation. Kraft Heinz and Unilever (Hellmann’s) are ramping up industry penetration by leveraging direct-to-consumer (D2C) channels and expanding ready-to-eat options in metropolitan areas.

Their product portfolios are diversifying with organic, clean-label dressings, often incorporating eco-friendly packaging and ethically sourced ingredients. Similarly, Nestlé and Danone are focusing on regional preferences, introducing dairy-based variants with probiotics and plant-based alternatives to cater to emerging economies. Regional players like Primo Foods are taking a premium approach, offering organic dairy-based sauces while appealing to natural ingredient trends.

Recent Industry News

  • In 2024, Tate & Lyle announced the completion of its acquisition of CP Kelco, a prominent provider of pectin, specialty gums, and other nature-based ingredients. This strategic move is aimed at positioning Tate & Lyle as a leader in the mouthfeel solutions market, significantly enhancing its ability to offer innovative food and beverage solutions.
  • June 2024, Lite house Inc. launched two new product lines Lite house Kids and Lite house Loaded, which are now available at retail stores. These new lines introduce seven newly formulated sauces and dips, featuring unique flavor profiles designed for a variety of tastes and preferences.

Leading Players in Dairy-Based Dressings Market

  • TIC Gums, Inc.
  • DairyChem Inc.
  • Litehouse Inc.
  • Darifair Foods, Inc.
  • Santini Foods, Inc.
  • Tate & Lyle PLC
  • Other Emerging Players

Research Coverage and Scope Summary

Report Attributes Details
Industry Size (2025E) USD 883.5 million
Industry Value (2035F) USD 1,307.8 million
Value-based CAGR (2025 to 2035) 4.0%
Base Year for Estimation 2024
Historical Period 2020 to 2024
Projections Period 2025 to 2035
Quantitative Units USD million for value and Metric tons for volume
Product Types Analyzed Creamy salad dressings, Greek yogurt salad dressing, vinaigrette salad dressing, organic salad dressings, vinaigrettes
Storage Types Analyzed Refrigerated, Shelf-stable
Distribution Channels Analyzed Online, Offline
Regions Covered North America, Latin America, Western Europe, Eastern Europe, East Asia, South Asia & Pacific, Central Asia, Russia and Belarus, Balkan & Baltic Countries, Middle East and Africa
Key Players TIC Gums, Inc., Dairy Chem Inc., Lite house Inc., Dari fair Foods, Inc., Santini Foods, Inc., Tate & Lyle PLC, Other Emerging Players
Additional Attributes Dollar sales by product type and region, demand trends for refrigerated vs. shelf-stable, impact of online retail, regional consumption patterns, innovation in organic and Greek yogurt dressings

Key Segments

By Product Type:

The industry includes creamy salad dressings, Greek yogurt salad dressing, vinaigrette salad dressing, organic salad dressings, and vinaigrettes.

By Storage Type:

The industry is segmented into refrigerated or shelf-stable forms.

By Distribution Channel:

These products are sold through online and offline channels.

By Region:

The industry is segmented as North America, Latin America, Western Europe, Eastern Europe, East Asia, South Asia & Pacific, Central Asia, Russia and Belarus, Balkan & Baltic Countries, Middle East and Africa.

Table of Content

  1. Executive Summary
    • Global Market Outlook
    • Demand-side Trends
    • Supply-side Trends
    • Technology Roadmap Analysis
    • Analysis and Recommendations
  2. Market Overview
    • Market Coverage /Taxonomy
    • Market Definition /Scope /Limitations
  3. Market Background
    • Market Dynamics
      • Drivers
      • Restraints
      • Opportunity
      • Trends
    • Scenario Forecast
      • Demand in Optimistic Scenario
      • Demand in Likely Scenario
      • Demand in Conservative Scenario
    • Opportunity Map Analysis
    • Product Life Cycle Analysis
    • Supply Chain Analysis
      • Supply Side Participants and their Roles
        • Producers
        • Mid-Level Participants (Traders/ Agents/ Brokers)
        • Wholesalers and Distributors
      • Value Added and Value Created at Node in the Supply Chain
      • List of Raw Material Suppliers
      • List of Existing and Potential Buyer’s
    • Investment Feasibility Matrix
    • Value Chain Analysis
      • Profit Margin Analysis
      • Wholesalers and Distributors
      • Retailers
    • PESTLE and Porter’s Analysis
    • Regulatory Landscape
      • By Key Regions
      • By Key Countries
    • Regional Parent Market Outlook
    • Production and Consumption Statistics
    • Import and Export Statistics
  4. Global Market Analysis 2020 to 2024 and Forecast, 2025 to 2035
    • Historical Market Size Value (USD Million) & Volume (MT) Analysis, 2020 to 2024
    • Current and Future Market Size Value (USD Million) & Volume (MT) Projections, 2025 to 2035
      • Y-o-Y Growth Trend Analysis
      • Absolute $ Opportunity Analysis
  5. Global Market Pricing Analysis 2020 to 2024 and Forecast 2025 to 2035
  6. Global Market Analysis 2020 to 2024 and Forecast 2025 to 2035, By Product Type
    • Introduction /Key Findings
    • Historical Market Size Value (USD Million) & Volume (MT) Analysis By Product Type, 2020 to 2024
    • Current and Future Market Size Value (USD Million) & Volume (MT) Analysis and Forecast By Product Type, 2025 to 2035
      • Creamy Salad Dressings
      • Greek Yogurt Salad Dressing
      • Vinaigrette Salad Dressing
      • Organic Salad Dressings
      • Vinaigrettes
    • Y-o-Y Growth Trend Analysis By Product Type, 2020 to 2024
    • Absolute $ Opportunity Analysis By Product Type, 2025 to 2035
  7. Global Market Analysis 2020 to 2024 and Forecast 2025 to 2035, By Storage Type
    • Introduction /Key Findings
    • Historical Market Size Value (USD Million) & Volume (MT) Analysis By Storage Type, 2020 to 2024
    • Current and Future Market Size Value (USD Million) & Volume (MT) Analysis and Forecast By Storage Type, 2025 to 2035
      • Refrigerated
      • Shelf-stable
    • Y-o-Y Growth Trend Analysis By Storage Type, 2020 to 2024
    • Absolute $ Opportunity Analysis By Storage Type, 2025 to 2035
  8. Global Market Analysis 2020 to 2024 and Forecast 2025 to 2035, By Distribution Channel
    • Introduction /Key Findings
    • Historical Market Size Value (USD Million) & Volume (MT) Analysis By Distribution Channel, 2020 to 2024
    • Current and Future Market Size Value (USD Million) & Volume (MT) Analysis and Forecast By Distribution Channel, 2025 to 2035
      • Online
      • Offline
      • Electronics
      • Energy & Power
      • Others
    • Y-o-Y Growth Trend Analysis By Distribution Channel, 2020 to 2024
    • Absolute $ Opportunity Analysis By Distribution Channel, 2025 to 2035
  9. Global Market Analysis 2020 to 2024 and Forecast 2025 to 2035, By Region
    • Introduction
    • Historical Market Size Value (USD Million) & Volume (MT) Analysis By Region, 2020 to 2024
    • Current Market Size Value (USD Million) & Volume (MT) Analysis and Forecast By Region, 2025 to 2035
      • North America
      • Latin America
      • Western Europe
      • Eastern Europe
      • East Asia
      • South Asia & Pacific
      • Middle East and Africa
    • Market Attractiveness Analysis By Region
  10. North America Market Analysis 2020 to 2024 and Forecast 2025 to 2035, By Country
    • Historical Market Size Value (USD Million) & Volume (MT) Trend Analysis By Market Taxonomy, 2020 to 2024
    • Market Size Value (USD Million) & Volume (MT) Forecast By Market Taxonomy, 2025 to 2035
      • By Country
        • USA
        • Canada
        • Mexico
      • By Product Type
      • By Storage Type
      • By Distribution Channel
    • Market Attractiveness Analysis
      • By Country
      • By Product Type
      • By Storage Type
      • By Distribution Channel
    • Key Takeaways
  11. Latin America Market Analysis 2020 to 2024 and Forecast 2025 to 2035, By Country
    • Historical Market Size Value (USD Million) & Volume (MT) Trend Analysis By Market Taxonomy, 2020 to 2024
    • Market Size Value (USD Million) & Volume (MT) Forecast By Market Taxonomy, 2025 to 2035
      • By Country
        • Brazil
        • Argentina
        • Rest of LATAM
      • By Product Type
      • By Storage Type
      • By Distribution Channel
    • Market Attractiveness Analysis
      • By Country
      • By Product Type
      • By Storage Type
      • By Distribution Channel
    • Key Takeaways
  12. Western Europe Market Analysis 2020 to 2024 and Forecast 2025 to 2035, By Country
    • Historical Market Size Value (USD Million) & Volume (MT) Trend Analysis By Market Taxonomy, 2020 to 2024
    • Market Size Value (USD Million) & Volume (MT) Forecast By Market Taxonomy, 2025 to 2035
      • By Country
        • Germany
        • Italy
        • France
        • UK
        • Spain
        • BENELUX
        • Nordic
        • Rest of W.Europe
      • By Product Type
      • By Storage Type
      • By Distribution Channel
    • Market Attractiveness Analysis
      • By Country
      • By Product Type
      • By Storage Type
      • By Distribution Channel
    • Key Takeaways
  13. Eastern Europe Market Analysis 2020 to 2024 and Forecast 2025 to 2035, By Country
    • Historical Market Size Value (USD Million) & Volume (MT) Trend Analysis By Market Taxonomy, 2020 to 2024
    • Market Size Value (USD Million) & Volume (MT) Forecast By Market Taxonomy, 2025 to 2035
      • By Country
        • Russia
        • Hungary
        • Poland
        • Balkan & Baltics
        • Rest of E. Europe
      • By Product Type
      • By Storage Type
      • By Distribution Channel
    • Market Attractiveness Analysis
      • By Country
      • By Product Type
      • By Storage Type
      • By Distribution Channel
    • Key Takeaways
  14. East Asia Market Analysis 2020 to 2024 and Forecast 2025 to 2035, By Country
    • Historical Market Size Value (USD Million) & Volume (MT) Trend Analysis By Market Taxonomy, 2020 to 2024
    • Market Size Value (USD Million) & Volume (MT) Forecast by Market Taxonomy, 2025 to 2035
      • By Country
        • China
        • Japan
        • South Korea
      • By Product Type
      • By Storage Type
      • By Distribution Channel
    • Market Attractiveness Analysis
      • By Country
      • By Product Type
      • By Storage Type
      • By Distribution Channel
    • Key Takeaways
  15. South Asia & Pacific Market Analysis 2020 to 2024 and Forecast 2025 to 2035, By Country
    • Historical Market Size Value (USD Million) & Volume (MT) Trend Analysis By Market Taxonomy, 2020 to 2024
    • Market Size Value (USD Million) & Volume (MT) Forecast By Market Taxonomy, 2025 to 2035
      • By Country
        • India
        • Australia & New Zealand
        • ASEAN
        • Rest of SAP
      • By Product Type
      • By Storage Type
      • By Distribution Channel
    • Market Attractiveness Analysis
      • By Country
      • By Product Type
      • By Storage Type
      • By Distribution Channel
    • Key Takeaways
  16. Middle East and Africa Market Analysis 2020 to 2024 and Forecast 2025 to 2035, By Country
    • Historical Market Size Value (USD Million) & Volume (MT) Trend Analysis By Market Taxonomy, 2020 to 2024
    • Market Size Value (USD Million) & Volume (MT) Forecast By Market Taxonomy, 2025 to 2035
      • By Country
        • GCC Countries
        • Northern Africa
        • South Africa
        • Turkiye
        • Rest of MEA
      • By Product Type
      • By Storage Type
      • By Distribution Channel
    • Market Attractiveness Analysis
      • By Country
      • By Product Type
      • By Storage Type
      • By Distribution Channel
    • Key Takeaways
  17. Key Countries Market Analysis
    • USA
      • Pricing Analysis
      • Market Share Analysis, 2024
        • By Product Type
        • By Storage Type
        • By Distribution Channel
    • Canada
      • Pricing Analysis
      • Market Share Analysis, 2024
        • By Product Type
        • By Storage Type
        • By Distribution Channel
    • Brazil
      • Pricing Analysis
      • Market Share Analysis, 2024
        • By Product Type
        • By Storage Type
        • By Distribution Channel
    • Mexico
      • Pricing Analysis
      • Market Share Analysis, 2024
        • By Product Type
        • By Storage Type
        • By Distribution Channel
    • Argentina
      • Pricing Analysis
      • Market Share Analysis, 2024
        • By Product Type
        • By Storage Type
        • By Distribution Channel
  18. Market Structure Analysis
    • Competition Dashboard
    • Competition Benchmarking
    • Market Share Analysis of Top Players
      • By Regional
      • By Product Type
      • By Storage Type
      • By Distribution Channel
  19. Competition Analysis
    • Competition Deep Dive
      • TIC Gums, Inc.
        • Overview
        • Product Portfolio
        • Profitability by Market Segments (Product/Age /Sales Channel/Region)
        • Sales Footprint
        • Strategy Overview
          • Marketing Strategy
          • Product Strategy
          • Channel Strategy
      • DairyChem Inc.
        • Overview
        • Product Portfolio
        • Profitability by Market Segments (Product/Age /Sales Channel/Region)
        • Sales Footprint
        • Strategy Overview
          • Marketing Strategy
          • Product Strategy
          • Channel Strategy
      • Litehouse Inc.
        • Overview
        • Product Portfolio
        • Profitability by Market Segments (Product/Age /Sales Channel/Region)
        • Sales Footprint
        • Strategy Overview
          • Marketing Strategy
          • Product Strategy
          • Channel Strategy
      • Darifair Foods, Inc.
        • Overview
        • Product Portfolio
        • Profitability by Market Segments (Product/Age /Sales Channel/Region)
        • Sales Footprint
        • Strategy Overview
          • Marketing Strategy
          • Product Strategy
          • Channel Strategy
      • Santini Foods, Inc.
        • Overview
        • Product Portfolio
        • Profitability by Market Segments (Product/Age /Sales Channel/Region)
        • Sales Footprint
        • Strategy Overview
          • Marketing Strategy
          • Product Strategy
          • Channel Strategy
      • Tate & Lyle PLC
        • Overview
        • Product Portfolio
        • Profitability by Market Segments (Product/Age /Sales Channel/Region)
        • Sales Footprint
        • Strategy Overview
          • Marketing Strategy
          • Product Strategy
          • Channel Strategy
  20. Assumptions & Acronyms Used
  21. Research Methodology

List of Tables

  • Table 1: Global Market Value (USD Million) Forecast by Region, 2020-2035
  • Table 2: Global Market Volume (MT) Forecast by Region, 2020-2035
  • Table 3: Global Market Value (USD Million) Forecast by Product Type, 2020-2035
  • Table 4: Global Market Volume (MT) Forecast by Product Type, 2020-2035
  • Table 5: Global Market Value (USD Million) Forecast by Storage Type, 2020-2035
  • Table 6: Global Market Volume (MT) Forecast by Storage Type, 2020-2035
  • Table 7: Global Market Value (USD Million) Forecast by Distribution Channel, 2020-2035
  • Table 8: Global Market Volume (MT) Forecast by Distribution Channel, 2020-2035
  • Table 9: North America Market Value (USD Million) Forecast by Country, 2020-2035
  • Table 10: North America Market Volume (MT) Forecast by Country, 2020-2035
  • Table 11: North America Market Value (USD Million) Forecast by Product Type, 2020-2035
  • Table 12: North America Market Volume (MT) Forecast by Product Type, 2020-2035
  • Table 13: North America Market Value (USD Million) Forecast by Storage Type, 2020-2035
  • Table 14: North America Market Volume (MT) Forecast by Storage Type, 2020-2035
  • Table 15: North America Market Value (USD Million) Forecast by Distribution Channel, 2020-2035
  • Table 16: North America Market Volume (MT) Forecast by Distribution Channel, 2020-2035
  • Table 17: Latin America Market Value (USD Million) Forecast by Country, 2020-2035
  • Table 18: Latin America Market Volume (MT) Forecast by Country, 2020-2035
  • Table 19: Latin America Market Value (USD Million) Forecast by Product Type, 2020-2035
  • Table 20: Latin America Market Volume (MT) Forecast by Product Type, 2020-2035
  • Table 21: Latin America Market Value (USD Million) Forecast by Storage Type, 2020-2035
  • Table 22: Latin America Market Volume (MT) Forecast by Storage Type, 2020-2035
  • Table 23: Latin America Market Value (USD Million) Forecast by Distribution Channel, 2020-2035
  • Table 24: Latin America Market Volume (MT) Forecast by Distribution Channel, 2020-2035
  • Table 25: Western Europe Market Value (USD Million) Forecast by Country, 2020-2035
  • Table 26: Western Europe Market Volume (MT) Forecast by Country, 2020-2035
  • Table 27: Western Europe Market Value (USD Million) Forecast by Product Type, 2020-2035
  • Table 28: Western Europe Market Volume (MT) Forecast by Product Type, 2020-2035
  • Table 29: Western Europe Market Value (USD Million) Forecast by Storage Type, 2020-2035
  • Table 30: Western Europe Market Volume (MT) Forecast by Storage Type, 2020-2035
  • Table 31: Western Europe Market Value (USD Million) Forecast by Distribution Channel, 2020-2035
  • Table 32: Western Europe Market Volume (MT) Forecast by Distribution Channel, 2020-2035
  • Table 33: Eastern Europe Market Value (USD Million) Forecast by Country, 2020-2035
  • Table 34: Eastern Europe Market Volume (MT) Forecast by Country, 2020-2035
  • Table 35: Eastern Europe Market Value (USD Million) Forecast by Product Type, 2020-2035
  • Table 36: Eastern Europe Market Volume (MT) Forecast by Product Type, 2020-2035
  • Table 37: Eastern Europe Market Value (USD Million) Forecast by Storage Type, 2020-2035
  • Table 38: Eastern Europe Market Volume (MT) Forecast by Storage Type, 2020-2035
  • Table 39: Eastern Europe Market Value (USD Million) Forecast by Distribution Channel, 2020-2035
  • Table 40: Eastern Europe Market Volume (MT) Forecast by Distribution Channel, 2020-2035
  • Table 41: East Asia Market Value (USD Million) Forecast by Country, 2020-2035
  • Table 42: East Asia Market Volume (MT) Forecast by Country, 2020-2035
  • Table 43: East Asia Market Value (USD Million) Forecast by Product Type, 2020-2035
  • Table 44: East Asia Market Volume (MT) Forecast by Product Type, 2020-2035
  • Table 45: East Asia Market Value (USD Million) Forecast by Storage Type, 2020-2035
  • Table 46: East Asia Market Volume (MT) Forecast by Storage Type, 2020-2035
  • Table 47: East Asia Market Value (USD Million) Forecast by Distribution Channel, 2020-2035
  • Table 48: East Asia Market Volume (MT) Forecast by Distribution Channel, 2020-2035
  • Table 49: South Asia & Pacific Market Value (USD Million) Forecast by Country, 2020-2035
  • Table 50: South Asia & Pacific Market Volume (MT) Forecast by Country, 2020-2035
  • Table 51: South Asia & Pacific Market Value (USD Million) Forecast by Product Type, 2020-2035
  • Table 52: South Asia & Pacific Market Volume (MT) Forecast by Product Type, 2020-2035
  • Table 53: South Asia & Pacific Market Value (USD Million) Forecast by Storage Type, 2020-2035
  • Table 54: South Asia & Pacific Market Volume (MT) Forecast by Storage Type, 2020-2035
  • Table 55: South Asia & Pacific Market Value (USD Million) Forecast by Distribution Channel, 2020-2035
  • Table 56: South Asia & Pacific Market Volume (MT) Forecast by Distribution Channel, 2020-2035
  • Table 57: Middle East and Africa Market Value (USD Million) Forecast by Country, 2020-2035
  • Table 58: Middle East and Africa Market Volume (MT) Forecast by Country, 2020-2035
  • Table 59: Middle East and Africa Market Value (USD Million) Forecast by Product Type, 2020-2035
  • Table 60: Middle East and Africa Market Volume (MT) Forecast by Product Type, 2020-2035
  • Table 61: Middle East and Africa Market Value (USD Million) Forecast by Storage Type, 2020-2035
  • Table 62: Middle East and Africa Market Volume (MT) Forecast by Storage Type, 2020-2035
  • Table 63: Middle East and Africa Market Value (USD Million) Forecast by Distribution Channel, 2020-2035
  • Table 64: Middle East and Africa Market Volume (MT) Forecast by Distribution Channel, 2020-2035

List of Figures

  • Figure 1: Global Market Volume (MT) Forecast 2020-2035
  • Figure 2: Global Market Pricing Analysis
  • Figure 3: Global Market Value (USD Million) Forecast 2020-2035
  • Figure 4: Global Market Value Share and BPS Analysis by Product Type, 2025 and 2035
  • Figure 5: Global Market Y-o-Y Growth Comparison by Product Type, 2025-2035
  • Figure 6: Global Market Attractiveness Analysis by Product Type
  • Figure 7: Global Market Value Share and BPS Analysis by Storage Type, 2025 and 2035
  • Figure 8: Global Market Y-o-Y Growth Comparison by Storage Type, 2025-2035
  • Figure 9: Global Market Attractiveness Analysis by Storage Type
  • Figure 10: Global Market Value Share and BPS Analysis by Distribution Channel, 2025 and 2035
  • Figure 11: Global Market Y-o-Y Growth Comparison by Distribution Channel, 2025-2035
  • Figure 12: Global Market Attractiveness Analysis by Distribution Channel
  • Figure 13: Global Market Value (USD Million) Share and BPS Analysis by Region, 2025 and 2035
  • Figure 14: Global Market Y-o-Y Growth Comparison by Region, 2025-2035
  • Figure 15: Global Market Attractiveness Analysis by Region
  • Figure 16: North America Market Incremental $ Opportunity, 2025-2035
  • Figure 17: Latin America Market Incremental $ Opportunity, 2025-2035
  • Figure 18: Western Europe Market Incremental $ Opportunity, 2025-2035
  • Figure 19: Eastern Europe Market Incremental $ Opportunity, 2025-2035
  • Figure 20: East Asia Market Incremental $ Opportunity, 2025-2035
  • Figure 21: South Asia & Pacific Market Incremental $ Opportunity, 2025-2035
  • Figure 22: Middle East and Africa Market Incremental $ Opportunity, 2025-2035
  • Figure 23: North America Market Value Share and BPS Analysis by Country, 2025 and 2035
  • Figure 24: North America Market Value Share and BPS Analysis by Product Type, 2025 and 2035
  • Figure 25: North America Market Y-o-Y Growth Comparison by Product Type, 2025-2035
  • Figure 26: North America Market Attractiveness Analysis by Product Type
  • Figure 27: North America Market Value Share and BPS Analysis by Storage Type, 2025 and 2035
  • Figure 28: North America Market Y-o-Y Growth Comparison by Storage Type, 2025-2035
  • Figure 29: North America Market Attractiveness Analysis by Storage Type
  • Figure 30: North America Market Value Share and BPS Analysis by Distribution Channel, 2025 and 2035
  • Figure 31: North America Market Y-o-Y Growth Comparison by Distribution Channel, 2025-2035
  • Figure 32: North America Market Attractiveness Analysis by Distribution Channel
  • Figure 33: Latin America Market Value Share and BPS Analysis by Country, 2025 and 2035
  • Figure 34: Latin America Market Value Share and BPS Analysis by Product Type, 2025 and 2035
  • Figure 35: Latin America Market Y-o-Y Growth Comparison by Product Type, 2025-2035
  • Figure 36: Latin America Market Attractiveness Analysis by Product Type
  • Figure 37: Latin America Market Value Share and BPS Analysis by Storage Type, 2025 and 2035
  • Figure 38: Latin America Market Y-o-Y Growth Comparison by Storage Type, 2025-2035
  • Figure 39: Latin America Market Attractiveness Analysis by Storage Type
  • Figure 40: Latin America Market Value Share and BPS Analysis by Distribution Channel, 2025 and 2035
  • Figure 41: Latin America Market Y-o-Y Growth Comparison by Distribution Channel, 2025-2035
  • Figure 42: Latin America Market Attractiveness Analysis by Distribution Channel
  • Figure 43: Western Europe Market Value Share and BPS Analysis by Country, 2025 and 2035
  • Figure 44: Western Europe Market Value Share and BPS Analysis by Product Type, 2025 and 2035
  • Figure 45: Western Europe Market Y-o-Y Growth Comparison by Product Type, 2025-2035
  • Figure 46: Western Europe Market Attractiveness Analysis by Product Type
  • Figure 47: Western Europe Market Value Share and BPS Analysis by Storage Type, 2025 and 2035
  • Figure 48: Western Europe Market Y-o-Y Growth Comparison by Storage Type, 2025-2035
  • Figure 49: Western Europe Market Attractiveness Analysis by Storage Type
  • Figure 50: Western Europe Market Value Share and BPS Analysis by Distribution Channel, 2025 and 2035
  • Figure 51: Western Europe Market Y-o-Y Growth Comparison by Distribution Channel, 2025-2035
  • Figure 52: Western Europe Market Attractiveness Analysis by Distribution Channel
  • Figure 53: Eastern Europe Market Value Share and BPS Analysis by Country, 2025 and 2035
  • Figure 54: Eastern Europe Market Value Share and BPS Analysis by Product Type, 2025 and 2035
  • Figure 55: Eastern Europe Market Y-o-Y Growth Comparison by Product Type, 2025-2035
  • Figure 56: Eastern Europe Market Attractiveness Analysis by Product Type
  • Figure 57: Eastern Europe Market Value Share and BPS Analysis by Storage Type, 2025 and 2035
  • Figure 58: Eastern Europe Market Y-o-Y Growth Comparison by Storage Type, 2025-2035
  • Figure 59: Eastern Europe Market Attractiveness Analysis by Storage Type
  • Figure 60: Eastern Europe Market Value Share and BPS Analysis by Distribution Channel, 2025 and 2035
  • Figure 61: Eastern Europe Market Y-o-Y Growth Comparison by Distribution Channel, 2025-2035
  • Figure 62: Eastern Europe Market Attractiveness Analysis by Distribution Channel
  • Figure 63: East Asia Market Value Share and BPS Analysis by Country, 2025 and 2035
  • Figure 64: East Asia Market Value Share and BPS Analysis by Product Type, 2025 and 2035
  • Figure 65: East Asia Market Y-o-Y Growth Comparison by Product Type, 2025-2035
  • Figure 66: East Asia Market Attractiveness Analysis by Product Type
  • Figure 67: East Asia Market Value Share and BPS Analysis by Storage Type, 2025 and 2035
  • Figure 68: East Asia Market Y-o-Y Growth Comparison by Storage Type, 2025-2035
  • Figure 69: East Asia Market Attractiveness Analysis by Storage Type
  • Figure 70: East Asia Market Value Share and BPS Analysis by Distribution Channel, 2025 and 2035
  • Figure 71: East Asia Market Y-o-Y Growth Comparison by Distribution Channel, 2025-2035
  • Figure 72: East Asia Market Attractiveness Analysis by Distribution Channel
  • Figure 73: South Asia & Pacific Market Value Share and BPS Analysis by Country, 2025 and 2035
  • Figure 74: South Asia & Pacific Market Value Share and BPS Analysis by Product Type, 2025 and 2035
  • Figure 75: South Asia & Pacific Market Y-o-Y Growth Comparison by Product Type, 2025-2035
  • Figure 76: South Asia & Pacific Market Attractiveness Analysis by Product Type
  • Figure 77: South Asia & Pacific Market Value Share and BPS Analysis by Storage Type, 2025 and 2035
  • Figure 78: South Asia & Pacific Market Y-o-Y Growth Comparison by Storage Type, 2025-2035
  • Figure 79: South Asia & Pacific Market Attractiveness Analysis by Storage Type
  • Figure 80: South Asia & Pacific Market Value Share and BPS Analysis by Distribution Channel, 2025 and 2035
  • Figure 81: South Asia & Pacific Market Y-o-Y Growth Comparison by Distribution Channel, 2025-2035
  • Figure 82: South Asia & Pacific Market Attractiveness Analysis by Distribution Channel
  • Figure 83: Middle East and Africa Market Value Share and BPS Analysis by Country, 2025 and 2035
  • Figure 84: Middle East and Africa Market Value Share and BPS Analysis by Product Type, 2025 and 2035
  • Figure 85: Middle East and Africa Market Y-o-Y Growth Comparison by Product Type, 2025-2035
  • Figure 86: Middle East and Africa Market Attractiveness Analysis by Product Type
  • Figure 87: Middle East and Africa Market Value Share and BPS Analysis by Storage Type, 2025 and 2035
  • Figure 88: Middle East and Africa Market Y-o-Y Growth Comparison by Storage Type, 2025-2035
  • Figure 89: Middle East and Africa Market Attractiveness Analysis by Storage Type
  • Figure 90: Middle East and Africa Market Value Share and BPS Analysis by Distribution Channel, 2025 and 2035
  • Figure 91: Middle East and Africa Market Y-o-Y Growth Comparison by Distribution Channel, 2025-2035
  • Figure 92: Middle East and Africa Market Attractiveness Analysis by Distribution Channel
  • Figure 93: Global Market - Tier Structure Analysis
  • Figure 94: Global Market - Company Share Analysis

Frequently Asked Questions

What is the projected industry size of the dairy-based dressings market by 2035?

The industry is projected to reach USD 1,307.8 million by 2035.

What is the expected CAGR of the dairy-based dressings market from 2025 to 2035?

The industry is expected to grow at a CAGR of 4.0% from 2025 to 2035.

Which segment is expected to lead the dairy-based dressing market in 2025?

Cheese-based dressings are expected to dominate with 61.4% share in 2025.

What is the industry size of the dairy-based dressings market in 2025?

The industry is estimated to reach USD 883.5 million in 2025.

Which region is expected to witness the highest growth in the dairy-based dressing market?

North America, particularly the United States, is expected to be the key growth region with a projected growth rate of 4.7%.

Explore Similar Insights

Future Market Insights

Dairy-Based Dressings Market