Reports

- Global Locations -

Headquarters

Future Market Insights, Inc.

Christiana Corporate, 200
Continental Drive, Suite 401,
Newark, Delaware - 19713,
United States

T: +1-845-579-5705

Americas

Future Market Insights, Inc.

616 Corporate Way, Suite 2-9018,
Valley Cottage, NY 10989, United States

T: +1-347-918-3531

MEA

Future Market Insights

1602-6 Jumeirah Bay X2 Tower, Plot No: JLT-PH2-X2A,
Jumeirah Lakes Towers, Dubai,
United Arab Emirates

Europe

Future Market Insights

3rd Floor, 207 Regent Street,
W1B 3HH London
United Kingdom

T: + 44 (0) 20 8123 9659
D: +44 (0) 20 3287 4268

Asia Pacific

Future Market Insights

IndiaLand Global Tech Park, Unit UG-1, Behind Grand HighStreet, Phase 1, Hinjawadi, MH, Pune – 411057, India

Hydrokinetic Fiber Dressings Market Outlook (2022 to 2032)

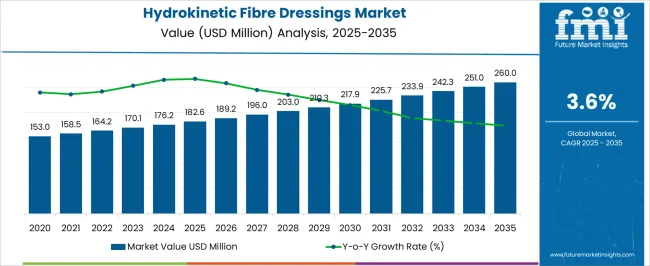
The hydrokinetic fiber dressings market is anticipated to reach US$ 251.1 million by 2032 from an estimated US$ 164.2 million in 2022. During the forecast period (2022 to 2032), the market is anticipated to grow at a CAGR of 3.9%, compared to 3.6% during the historical period (2017 to 2021).

The market is fueled by high demand for inexpensive and non-invasive dressing options, favorable reimbursement policies for chronic wound care products, the rising prevalence of chronic wounds worldwide, and the accessibility of new technologies that help lessen pain and enhance the quality of life. Additionally, the prevalence of diabetes mellitus type 2 patients have been rising globally, which has driven the growth rate by increasing the frequency of diabetic foot ulcers or neuropathic foot ulcerations.

The hydration response technique (HRT) supports dressings made of hydrokinetic fiber. Hydrokinetic fiber is a moisture-retentive dressing fiber that efficiently eliminates germs from the wound bed, reduces odor, has a very low risk of skin irritation and inflammation, and is incredibly pleasant to wear. The matrix that hydrokinetic fibers normally create is unique in its mixture of constituents, including their mass, percentages, and density.

Sodium polyacrylate and hydrophilic cellulose particles often referred to as cellulose fibers, are used in a complex mechanical process to create hydrokinetic fibers. Additionally, lignocellulosic materials must be bound to gel-forming polymers for hydrokinetic fibers to produce an absorbent dressing pad.

Report Attribute Details
Hydrokinetic Fiber Dressings Market Historical Growth Rate (2017 to 2021) 3.6%
Hydrokinetic Fiber Dressings Market Value (2022) US$ 164.2 million
Hydrokinetic Fiber Dressings Market Anticipated Forecast Value (2032) US$ 251.1 million
Hydrokinetic Fiber Dressings Market Projected Growth Rate (2022 to 2032) 3.9%

Don't pay for what you don't need

Customize your report by selecting specific countries or regions and save 30%!

Expanding Biotechnology Industry Requirements to Expand Hydrokinetic Fiber Dressings Market

The older population and the expanding demands in the biotechnology industry are the primary drivers of the market for hydrokinetic fiber dressings. The market's expansion is also fueled by the healthcare industry's evolving trends, tightening regulations, and growing emphasis on cost-cutting measures, all of which have raised the rate at which various healthcare institutions are adopting hydrokinetic fiber dressings.

The incidence of chronic diseases has increased along with the number of treatments done. Hydrokinetic fiber dressings are therefore being utilized more frequently to stop postoperative complications. Most surgical wounds created by cancer surgery are large and deep, producing exudates that must be regularly controlled. Large wounds could be managed with these dressings, greatly reducing the danger of infection. As a result, the rising incidence of chronic illnesses would fuel demand for hydrokinetic fiber dressings and propel market growth.

Other reasons driving the market's expansion include the development of the healthcare infrastructure, a greater emphasis on eradicating diseases brought on by wounds, and the creation of contaminant-free environments. Lastly, in wound care, standards are being raised to ensure that wounds receive excellent care, which will accelerate market expansion.

High Prices is the Sole Factor Preventing the Hydrokinetic Fiber Dressings Market from Growing

Prominent factors that might limit the growth of the global market include the high cost of active wound care therapies as well as the high cost of complex wound dressing technology items and equipment. Although these dressing treatments for wounds and burns are quite efficient, they are also very expensive. Since not everyone can afford these costs, hydrokinetic fiber dressings' expansion on the worldwide market is being restrained.

The greatest challenge in the global industry is also the stress of competitive pricing. The price of the top rivals is very competitive, which disrupts the world market. The total CAGR is anticipated to decrease if the same scenario holds true throughout the projection period.

Sabyasachi Ghosh
Sabyasachi Ghosh

Principal Consultant

Talk to Analyst

Find your sweet spots for generating winning opportunities in this market.

Hydrokinetic Fiber Dressings Market Outlook for the Acute Wounds and Hospitals & Specialty Wound Care Clinics Segments

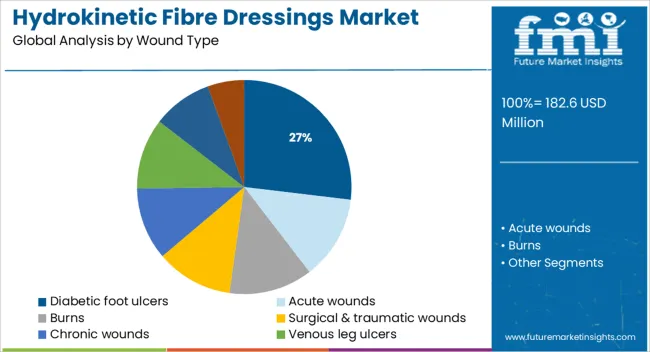
The hydrokinetic fiber dressings market was led by the segment of acute wounds based on wound type. It is anticipated that the segment would grow quickly throughout the forecast period. Burns and surgical and traumatic wounds are examples of acute wounds. Acute wounds recover within a few weeks of the initial injury. Several traumas, such as surgical incisions and dog bites, can result in acute wounds. The percentage of people with at least one wound who are taken to hospitals is around 30%.

One in five patients admitted to the hospital had at least one skin tear. Furthermore, at least one wound was present in around half of all hospital deaths. Such wounds can be healed.

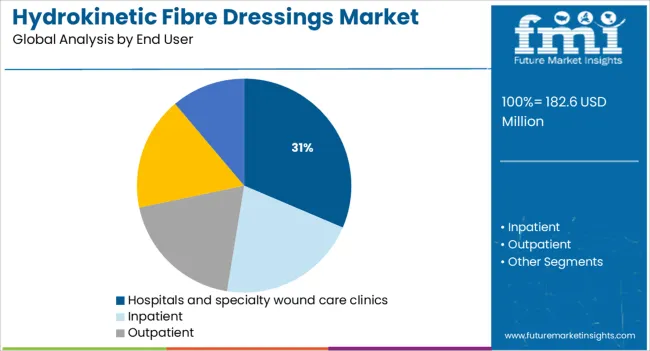
The hospitals and specialty wound care clinics segment dominates the market as far as the end-user part is concerned. In hospitals, hydrokinetic fiber dressings are used to treat both acute and chronic wounds. They aid in the drainage of the wound's fluid and encourage healing. The coverings also guard the wound against infection. Hydrokinetic fiber dressings come in various sizes and forms to meet the demands of various patients. They don't need any particular training and are simple to operate. Hydrokinetic fiber dressings are used in specialty wound care clinics to aid in healing acute and chronic wounds. They work well to drain extra fluid from the wound and encourage cell development. This hastens the healing process and enhances the patient's final results.

North American Hydrokinetic Fiber Dressings Market is being stimulated by the Expansion of Biotechnology and Pharmaceutical Firms

North America is currently leading the hydrokinetic fiber dressing industry. According to Future Market Insights Analysts, North America's hydrokinetic fiber dressings market is likely to reach a global market size of 39.9% by 2022. The rising use of hydrokinetic fiber dressings, adequate skilled individuals and well-developed healthcare infrastructure, and the rise in the number of biotechnology and pharmaceutical firms operating in this region all contribute to the market's expansion.

The region is anticipated to grow at a notable rate of 3.5% throughout the predicted period. The regional market for hydrokinetic fiber dressing is anticipated to grow due to rising traffic accidents, sports injuries, and multiple important businesses in the region.
Get the data you need at a Fraction of the cost

Personalize your report by choosing insights you need
and save 40%!

Huge Presence of Specialty Wound Care Clinics Steering Market Expansion for Hydrokinetic Fiber Dressings in Europe

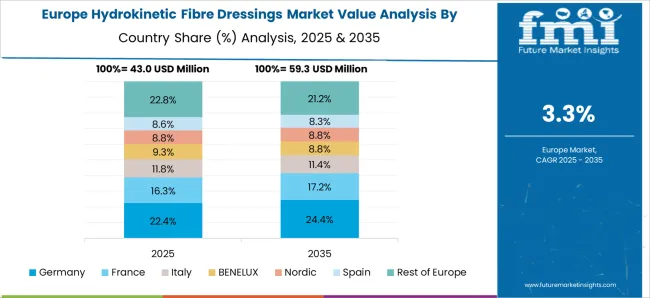
With consistent expansion, Europe will represent around 30.0% of the worldwide market share by 2022. In Europe, there are several different types of wound care clinics. In Specialty Wound Care Clinics, hydrokinetic fiber dressings are utilized to speed the recovery of both acute wounds and chronic burns. They aid in eliminating extra fluid from wounds and encourage cell growth. This can speed up healing and improve the patient's overall prognosis.

The growth in Europe is anticipated to increase due to the increase in patient visits to these clinics during the forecast period. The large market share of hydrokinetic fiber dressings held by Western Europe is the result of factors such as an aging population, an increase in the prevalence of chronic and acute wounds, rising healthcare costs with higher disposable income, and the existence of significant market players.

Rapidly Expanding Medical Tourism Business is Pouring the Hydrokinetic Fiber Dressings Market in Asia Pacific Region

Throughout the forecast period, Asia Pacific is anticipated to have the quickest growth in the hydrokinetic fiber dressings market. Developing nations like Japan, China, and India are anticipated to boost market expansion in the area. The rapidly growing medical tourism industry in these nations is also a result of the rising need for hydrokinetic fiber dressings in the area.

India had 58,300 medical tourists on medical visas from 2019 to 2020, according to the Directorate-General of Commercial Intelligence and Statistics of India's report on Export Health Services. Throughout the forecast period, such events are anticipated to strengthen the Asia Pacific market.

Start-ups are Expanding Rapidly with Emergence of New Technology

In response to the expansion of the healthcare infrastructure, the hydrokinetic fiber dressing market has become increasingly fragmented and competitive. As a result, startups are attempting to stand out from established market competitors to attract clients through technological inventions.

Example:

  • A USA-based startup called Imbed Biosciences offers wound care solutions built on nanotechnology. The business has created methods for incorporating bioactive chemicals into surgical implants and wound dressings. The Microlyte Matrix technology platform serves as the foundation for the goods. Additionally, the business sells analgesic, anti-biofilm, and antibacterial wound dressings.
  • Smart wound monitoring technologies are offered by the French startup Grapheal. The company offers caregivers a customized tool for wound evaluation through a wearable patch that enables continuous wound monitoring. Its electronic wound patch records and transmits wound bio parameters to a medical cloud via a smartphone app. Remote wound healing progress monitoring is made possible for nurses and medical professionals.

Market Giants are Developing and Implementing Unique Business Strategies to Hold the Leading Positions

The major players in the hydrokinetic fiber dressings Market are currently more active than ever in developing strategies like targeted advertising, CSR programs, and other things to grow their worldwide prominence. Across the board, there has been a significant trend that these organizations are now trying to manage certain business-related activities in a nation with favorable laws. Consequently, these businesses can reduce expenses while continuing to hire business experts at each crucial stage of their particular businesses. Governments in developing countries such as China, India, Taiwan, and Indonesia are adopting strategies to entice international investors to their respective manufacturing sectors by lowering trade taxes and customs to increase job possibilities.

Example:

  • In September 2020, Sorbion GMBH & Co. KG, a privately held business that sells solutions for both acute and chronic wounds, was obtained by BSN Medical GMBH to produce better dressing materials by incorporating the latest technology.
  • In April 2019, In addition to providing a business and clinical update, Adynxx announced a merger agreement with Alliqua BioMedical. Brivoligide, a new medicine candidate designed to lessen postoperative pain and the need for opioid-based therapy, was recently awarded a sizeable grant by the National Institute on Drug Abuse, according to the company.

Key Players

  • Sorbion GmbH & Co. KG
  • AlliquaInc.
  • Acelity L.P. Inc.
  • AcellInc.
  • Smith & NephewPlc
  • OrganogenesisInc.
  • Angelini PharmaInc
  • BSN MedicalInc.
  • ConvaTecInc.
  • Derma Sciences
  • DeRoyal Industries
  • EthiconInc.
  • Medline IndustriesInc
  • Southwest Technologies

Report Scope

Report Attribute Details
Growth Rate CAGR of 3.9% from 2022 to 2032
Base Year for Estimation 2021
Historical Data 2017 to 2021
Forecast Period 2022 to 2032
Quantitative Units Revenue in USD Million and CAGR from 2022 to 2032
Report Coverage Revenue Forecast, Volume Forecast, Company Ranking, Competitive Landscape, Growth Factors, Trends, and Pricing Analysis
Segments Covered
  • Wound Type
  • End-user
  • Region
Regions Covered
  • North America
  • Latin America
  • The Asia Pacific
  • Middle East and Africa
  • Europe
Key Countries Profiled
  • United States of America
  • Canada
  • Brazil
  • Argentina
  • Germany
  • United Kingdom
  • France
  • Spain
  • Italy
  • Nordics
  • BENELUX
  • Australia & New Zealand
  • China
  • India
  • ASIAN
  • GCC Countries
  • South Africa
Key Companies Profiled
  • Sorbion GmbH & Co. KG
  • Alliqua Inc.
  • Acelity L.P. Inc.
  • Acell Inc.
  • Smith & Nephew Plc
  • Organogenesis Inc.
  • Angelini Pharma Inc
  • BSN Medical Inc.
  • ConvaTec Inc.
  • Derma Sciences
  • DeRoyal Industries
  • Ethicon Inc.
  • Medline Industries Inc
  • Southwest Technologies
Customization Available Upon Request

Key Segments Profiled In The Global Hydrokinetic Fibre Dressings Market

By Wound Type:

  • cut wounds
  • burns
  • surgical & traumatic wounds
  • chronic wounds
  • venous leg ulcers
  • pressure ulcers
  • diabetic foot ulcers
  • other chronic wounds

By End-user:

  • hospitals and specialty wound care clinics
  • inpatient
  • outpatient
  • long-term care facilities
  • home healthcare

By Region:

  • North America
  • Latin America
  • Eastern Europe
  • Western Europe
  • Asia Pacific
  • Japan
  • Middle East and Africa

Frequently Asked Questions

What is the anticipated growth of the global hydrokinetic fibre dressings market from 2022 to 2032?

The global hydrokinetic fiber dressings market is expected to grow at a 3.9% CAGR and secure US$ 251.1 Million by 2032.

Which region is expected to be the most lucrative for hydrokinetic fibre dressings market growth?

North America is expected to be the fastest-growing market for Hydrokinetic fiber dressings during the forecast period and is expected to acquire a market share of 39.9% in 2022.

Which are some eminent players of the global hydrokinetic fibre dressings market?

Sorbion GmbH & Co. KG, Alliqua, Inc.., Acelity L.P. Inc., Acell, Inc., Smith & Nephew, Plc, Organogenesis, Inc., Angelini Pharma, Inc, BSN Medical, Inc., ConvaTec, Inc., Derma Sciences, DeRoyal Industries, Ethicon, Inc, Medline Industries, Inc, Southwest Technologies are some of the known players in the Hydrokinetic fiber dressings market.

Table of Content

1. Executive Summary | Hydrokinetic Fibre Dressings Market

    1.1. Global Market Outlook

    1.2. Demand-side Trends

    1.3. Supply-side Trends

    1.4. Technology Roadmap Analysis

    1.5. Analysis and Recommendations

2. Market Overview

    2.1. Market Coverage / Taxonomy

    2.2. Market Definition / Scope / Limitations

3. Market Background

    3.1. Market Dynamics

        3.1.1. Drivers

        3.1.2. Restraints

        3.1.3. Opportunity

        3.1.4. Trends

    3.2. Scenario Forecast

        3.2.1. Demand in Optimistic Scenario

        3.2.2. Demand in Likely Scenario

        3.2.3. Demand in Conservative Scenario

    3.3. Opportunity Map Analysis

    3.4. Investment Feasibility Matrix

    3.5. PESTLE and Porter’s Analysis

    3.6. Regulatory Landscape

        3.6.1. By Key Regions

        3.6.2. By Key Countries

    3.7. Regional Parent Market Outlook

4. Global Market Analysis 2017 to 2021 and Forecast, 2022 to 2032

    4.1. Historical Market Size Value (US$ Million) Analysis, 2017 to 2021

    4.2. Current and Future Market Size Value (US$ Million) Projections, 2022 to 2032

        4.2.1. Y-o-Y Growth Trend Analysis

        4.2.2. Absolute $ Opportunity Analysis

5. Global Market Analysis 2017 to 2021 and Forecast 2022 to 2032, By Wound Type

    5.1. Introduction / Key Findings

    5.2. Historical Market Size Value (US$ Million) Analysis By Wound Type, 2017 to 2021

    5.3. Current and Future Market Size Value (US$ Million) Analysis and Forecast By Wound Type, 2022 to 2032

        5.3.1. Acute wounds

        5.3.2. Burns

        5.3.3. Surgical & traumatic wounds

        5.3.4. Chronic wounds

        5.3.5. Venous leg ulcers

        5.3.6. Pressure ulcers

        5.3.7. Diabetic foot ulcers

        5.3.8. Other chronic wounds

    5.4. Y-o-Y Growth Trend Analysis By Wound Type, 2017 to 2021

    5.5. Absolute $ Opportunity Analysis By Wound Type, 2022 to 2032

6. Global Market Analysis 2017 to 2021 and Forecast 2022 to 2032, By End User

    6.1. Introduction / Key Findings

    6.2. Historical Market Size Value (US$ Million) Analysis By End User, 2017 to 2021

    6.3. Current and Future Market Size Value (US$ Million) Analysis and Forecast By End User, 2022 to 2032

        6.3.1. Hospitals and specialty wound care clinics

        6.3.2. Inpatient

        6.3.3. Outpatient

        6.3.4. Long-term care facilities

        6.3.5. Home healthcare

    6.4. Y-o-Y Growth Trend Analysis By End User, 2017 to 2021

    6.5. Absolute $ Opportunity Analysis By End User, 2022 to 2032

7. Global Market Analysis 2017 to 2021 and Forecast 2022 to 2032, By Region

    7.1. Introduction

    7.2. Historical Market Size Value (US$ Million) Analysis By Region, 2017 to 2021

    7.3. Current Market Size Value (US$ Million) Analysis and Forecast By Region, 2022 to 2032

        7.3.1. North America

        7.3.2. Latin America

        7.3.3. Europe

        7.3.4. Asia Pacific

        7.3.5. Middle East and Africa

    7.4. Market Attractiveness Analysis By Region

8. North America Market Analysis 2017 to 2021 and Forecast 2022 to 2032, By Country

    8.1. Historical Market Size Value (US$ Million) Trend Analysis By Market Taxonomy, 2017 to 2021

    8.2. Market Size Value (US$ Million) Forecast By Market Taxonomy, 2022 to 2032

        8.2.1. By Country

            8.2.1.1. United States of America

            8.2.1.2. Canada

        8.2.2. By Wound Type

        8.2.3. By End User

    8.3. Market Attractiveness Analysis

        8.3.1. By Country

        8.3.2. By Wound Type

        8.3.3. By End User

    8.4. Key Takeaways

9. Latin America Market Analysis 2017 to 2021 and Forecast 2022 to 2032, By Country

    9.1. Historical Market Size Value (US$ Million) Trend Analysis By Market Taxonomy, 2017 to 2021

    9.2. Market Size Value (US$ Million) Forecast By Market Taxonomy, 2022 to 2032

        9.2.1. By Country

            9.2.1.1. Brazil

            9.2.1.2. Mexico

            9.2.1.3. Rest of Latin America

        9.2.2. By Wound Type

        9.2.3. By End User

    9.3. Market Attractiveness Analysis

        9.3.1. By Country

        9.3.2. By Wound Type

        9.3.3. By End User

    9.4. Key Takeaways

10. Europe Market Analysis 2017 to 2021 and Forecast 2022 to 2032, By Country

    10.1. Historical Market Size Value (US$ Million) Trend Analysis By Market Taxonomy, 2017 to 2021

    10.2. Market Size Value (US$ Million) Forecast By Market Taxonomy, 2022 to 2032

        10.2.1. By Country

            10.2.1.1. Germany

            10.2.1.2. United Kingdom

            10.2.1.3. France

            10.2.1.4. Spain

            10.2.1.5. Italy

            10.2.1.6. Rest of Europe

        10.2.2. By Wound Type

        10.2.3. By End User

    10.3. Market Attractiveness Analysis

        10.3.1. By Country

        10.3.2. By Wound Type

        10.3.3. By End User

    10.4. Key Takeaways

11. Asia Pacific Market Analysis 2017 to 2021 and Forecast 2022 to 2032, By Country

    11.1. Historical Market Size Value (US$ Million) Trend Analysis By Market Taxonomy, 2017 to 2021

    11.2. Market Size Value (US$ Million) Forecast By Market Taxonomy, 2022 to 2032

        11.2.1. By Country

            11.2.1.1. China

            11.2.1.2. Japan

            11.2.1.3. South Korea

            11.2.1.4. Malaysia

            11.2.1.5. Singapore

            11.2.1.6. Australia

            11.2.1.7. Rest of Asia Pacific

        11.2.2. By Wound Type

        11.2.3. By End User

    11.3. Market Attractiveness Analysis

        11.3.1. By Country

        11.3.2. By Wound Type

        11.3.3. By End User

    11.4. Key Takeaways

12. Middle East and Africa Market Analysis 2017 to 2021 and Forecast 2022 to 2032, By Country

    12.1. Historical Market Size Value (US$ Million) Trend Analysis By Market Taxonomy, 2017 to 2021

    12.2. Market Size Value (US$ Million) Forecast By Market Taxonomy, 2022 to 2032

        12.2.1. By Country

            12.2.1.1. GCC Countries

            12.2.1.2. South Africa

            12.2.1.3. Israel

            12.2.1.4. Rest of Middle East and Africa

        12.2.2. By Wound Type

        12.2.3. By End User

    12.3. Market Attractiveness Analysis

        12.3.1. By Country

        12.3.2. By Wound Type

        12.3.3. By End User

    12.4. Key Takeaways

13. Key Countries Market Analysis

    13.1. United Kingdom

        13.1.1. Pricing Analysis

        13.1.2. Market Share Analysis, 2021

            13.1.2.1. By Wound Type

            13.1.2.2. By End User

    13.2. Canada

        13.2.1. Pricing Analysis

        13.2.2. Market Share Analysis, 2021

            13.2.2.1. By Wound Type

            13.2.2.2. By End User

    13.3. Brazil

        13.3.1. Pricing Analysis

        13.3.2. Market Share Analysis, 2021

            13.3.2.1. By Wound Type

            13.3.2.2. By End User

    13.4. Mexico

        13.4.1. Pricing Analysis

        13.4.2. Market Share Analysis, 2021

            13.4.2.1. By Wound Type

            13.4.2.2. By End User

    13.5. Rest of Latin America

        13.5.1. Pricing Analysis

        13.5.2. Market Share Analysis, 2021

            13.5.2.1. By Wound Type

            13.5.2.2. By End User

    13.6. Germany

        13.6.1. Pricing Analysis

        13.6.2. Market Share Analysis, 2021

            13.6.2.1. By Wound Type

            13.6.2.2. By End User

    13.7. United Kingdom

        13.7.1. Pricing Analysis

        13.7.2. Market Share Analysis, 2021

            13.7.2.1. By Wound Type

            13.7.2.2. By End User

    13.8. France

        13.8.1. Pricing Analysis

        13.8.2. Market Share Analysis, 2021

            13.8.2.1. By Wound Type

            13.8.2.2. By End User

    13.9. Spain

        13.9.1. Pricing Analysis

        13.9.2. Market Share Analysis, 2021

            13.9.2.1. By Wound Type

            13.9.2.2. By End User

    13.10. Italy

        13.10.1. Pricing Analysis

        13.10.2. Market Share Analysis, 2021

            13.10.2.1. By Wound Type

            13.10.2.2. By End User

    13.11. Rest of Europe

        13.11.1. Pricing Analysis

        13.11.2. Market Share Analysis, 2021

            13.11.2.1. By Wound Type

            13.11.2.2. By End User

    13.12. China

        13.12.1. Pricing Analysis

        13.12.2. Market Share Analysis, 2021

            13.12.2.1. By Wound Type

            13.12.2.2. By End User

    13.13. Japan

        13.13.1. Pricing Analysis

        13.13.2. Market Share Analysis, 2021

            13.13.2.1. By Wound Type

            13.13.2.2. By End User

    13.14. South Korea

        13.14.1. Pricing Analysis

        13.14.2. Market Share Analysis, 2021

            13.14.2.1. By Wound Type

            13.14.2.2. By End User

    13.15. Malaysia

        13.15.1. Pricing Analysis

        13.15.2. Market Share Analysis, 2021

            13.15.2.1. By Wound Type

            13.15.2.2. By End User

    13.16. Singapore

        13.16.1. Pricing Analysis

        13.16.2. Market Share Analysis, 2021

            13.16.2.1. By Wound Type

            13.16.2.2. By End User

    13.17. Australia

        13.17.1. Pricing Analysis

        13.17.2. Market Share Analysis, 2021

            13.17.2.1. By Wound Type

            13.17.2.2. By End User

    13.18. Rest of Asia Pacific

        13.18.1. Pricing Analysis

        13.18.2. Market Share Analysis, 2021

            13.18.2.1. By Wound Type

            13.18.2.2. By End User

    13.19. GCC Countries

        13.19.1. Pricing Analysis

        13.19.2. Market Share Analysis, 2021

            13.19.2.1. By Wound Type

            13.19.2.2. By End User

    13.20. South Africa

        13.20.1. Pricing Analysis

        13.20.2. Market Share Analysis, 2021

            13.20.2.1. By Wound Type

            13.20.2.2. By End User

    13.21. Israel

        13.21.1. Pricing Analysis

        13.21.2. Market Share Analysis, 2021

            13.21.2.1. By Wound Type

            13.21.2.2. By End User

    13.22. Rest of the Middle East and Africa

        13.22.1. Pricing Analysis

        13.22.2. Market Share Analysis, 2021

            13.22.2.1. By Wound Type

            13.22.2.2. By End User

14. Market Structure Analysis

    14.1. Competition Dashboard

    14.2. Competition Benchmarking

    14.3. Market Share Analysis of Top Players

        14.3.1. By Regional

        14.3.2. By Wound Type

        14.3.3. By End User

15. Competition Analysis

    15.1. Competition Deep Dive

        15.1.1. Essity

            15.1.1.1. Overview

            15.1.1.2. Product Portfolio

            15.1.1.3. Profitability by Market Segments

            15.1.1.4. Sales Footprint

            15.1.1.5. Strategy Overview

                15.1.1.5.1. Marketing Strategy

        15.1.2. Alliqua, Inc

            15.1.2.1. Overview

            15.1.2.2. Product Portfolio

            15.1.2.3. Profitability by Market Segments

            15.1.2.4. Sales Footprint

            15.1.2.5. Strategy Overview

                15.1.2.5.1. Marketing Strategy

        15.1.3. Acelity L.P. Inc

            15.1.3.1. Overview

            15.1.3.2. Product Portfolio

            15.1.3.3. Profitability by Market Segments

            15.1.3.4. Sales Footprint

            15.1.3.5. Strategy Overview

                15.1.3.5.1. Marketing Strategy

        15.1.4. Acell, Inc

            15.1.4.1. Overview

            15.1.4.2. Product Portfolio

            15.1.4.3. Profitability by Market Segments

            15.1.4.4. Sales Footprint

            15.1.4.5. Strategy Overview

                15.1.4.5.1. Marketing Strategy

        15.1.5. Smith & Nephew, Plc

            15.1.5.1. Overview

            15.1.5.2. Product Portfolio

            15.1.5.3. Profitability by Market Segments

            15.1.5.4. Sales Footprint

            15.1.5.5. Strategy Overview

                15.1.5.5.1. Marketing Strategy

        15.1.6. Organogenesis, Inc

            15.1.6.1. Overview

            15.1.6.2. Product Portfolio

            15.1.6.3. Profitability by Market Segments

            15.1.6.4. Sales Footprint

            15.1.6.5. Strategy Overview

                15.1.6.5.1. Marketing Strategy

        15.1.7. Angelini Pharma, Inc

            15.1.7.1. Overview

            15.1.7.2. Product Portfolio

            15.1.7.3. Profitability by Market Segments

            15.1.7.4. Sales Footprint

            15.1.7.5. Strategy Overview

                15.1.7.5.1. Marketing Strategy

        15.1.8. BSN Medical, Inc

            15.1.8.1. Overview

            15.1.8.2. Product Portfolio

            15.1.8.3. Profitability by Market Segments

            15.1.8.4. Sales Footprint

            15.1.8.5. Strategy Overview

                15.1.8.5.1. Marketing Strategy

        15.1.9. ConvaTec, Inc.

            15.1.9.1. Overview

            15.1.9.2. Product Portfolio

            15.1.9.3. Profitability by Market Segments

            15.1.9.4. Sales Footprint

            15.1.9.5. Strategy Overview

                15.1.9.5.1. Marketing Strategy

        15.1.10. Derma Sciences

            15.1.10.1. Overview

            15.1.10.2. Product Portfolio

            15.1.10.3. Profitability by Market Segments

            15.1.10.4. Sales Footprint

            15.1.10.5. Strategy Overview

                15.1.10.5.1. Marketing Strategy

        15.1.11. DeRoyal Industries

            15.1.11.1. Overview

            15.1.11.2. Product Portfolio

            15.1.11.3. Profitability by Market Segments

            15.1.11.4. Sales Footprint

            15.1.11.5. Strategy Overview

                15.1.11.5.1. Marketing Strategy

        15.1.12. Ethicon, Inc.

            15.1.12.1. Overview

            15.1.12.2. Product Portfolio

            15.1.12.3. Profitability by Market Segments

            15.1.12.4. Sales Footprint

            15.1.12.5. Strategy Overview

                15.1.12.5.1. Marketing Strategy

        15.1.13. Medline Industries, Inc

            15.1.13.1. Overview

            15.1.13.2. Product Portfolio

            15.1.13.3. Profitability by Market Segments

            15.1.13.4. Sales Footprint

            15.1.13.5. Strategy Overview

                15.1.13.5.1. Marketing Strategy

        15.1.14. Southwest Technologies

            15.1.14.1. Overview

            15.1.14.2. Product Portfolio

            15.1.14.3. Profitability by Market Segments

            15.1.14.4. Sales Footprint

            15.1.14.5. Strategy Overview

                15.1.14.5.1. Marketing Strategy

16. Assumptions & Acronyms Used

17. Research Methodology

Don't pay for what you don't need

Customize your report by selecting specific countries or regions and save 30%!

List of Tables

Table 1: Global Market Value (US$ Million) Forecast by Region, 2017 to 2032

Table 2: Global Market Value (US$ Million) Forecast by Wound Type, 2017 to 2032

Table 3: Global Market Value (US$ Million) Forecast by End User, 2017 to 2032

Table 4: North America Market Value (US$ Million) Forecast by Country, 2017 to 2032

Table 5: North America Market Value (US$ Million) Forecast by Wound Type, 2017 to 2032

Table 6: North America Market Value (US$ Million) Forecast by End User, 2017 to 2032

Table 7: Latin America Market Value (US$ Million) Forecast by Country, 2017 to 2032

Table 8: Latin America Market Value (US$ Million) Forecast by Wound Type, 2017 to 2032

Table 9: Latin America Market Value (US$ Million) Forecast by End User, 2017 to 2032

Table 10: Europe Market Value (US$ Million) Forecast by Country, 2017 to 2032

Table 11: Europe Market Value (US$ Million) Forecast by Wound Type, 2017 to 2032

Table 12: Europe Market Value (US$ Million) Forecast by End User, 2017 to 2032

Table 13: Asia Pacific Market Value (US$ Million) Forecast by Country, 2017 to 2032

Table 14: Asia Pacific Market Value (US$ Million) Forecast by Wound Type, 2017 to 2032

Table 15: Asia Pacific Market Value (US$ Million) Forecast by End User, 2017 to 2032

Table 16: Middle East and Africa Market Value (US$ Million) Forecast by Country, 2017 to 2032

Table 17: Middle East and Africa Market Value (US$ Million) Forecast by Wound Type, 2017 to 2032

Table 18: Middle East and Africa Market Value (US$ Million) Forecast by End User, 2017 to 2032
Sabyasachi Ghosh
Sabyasachi Ghosh

Principal Consultant

Talk to Analyst

Find your sweet spots for generating winning opportunities in this market.

List of Charts

Figure 1: Global Market Value (US$ Million) by Wound Type, 2022 to 2032

Figure 2: Global Market Value (US$ Million) by End User, 2022 to 2032

Figure 3: Global Market Value (US$ Million) by Region, 2022 to 2032

Figure 4: Global Market Value (US$ Million) Analysis by Region, 2017 to 2032

Figure 5: Global Market Value Share (%) and BPS Analysis by Region, 2022 to 2032

Figure 6: Global Market Y-o-Y Growth (%) Projections by Region, 2022 to 2032

Figure 7: Global Market Value (US$ Million) Analysis by Wound Type, 2017 to 2032

Figure 8: Global Market Value Share (%) and BPS Analysis by Wound Type, 2022 to 2032

Figure 9: Global Market Y-o-Y Growth (%) Projections by Wound Type, 2022 to 2032

Figure 10: Global Market Value (US$ Million) Analysis by End User, 2017 to 2032

Figure 11: Global Market Value Share (%) and BPS Analysis by End User, 2022 to 2032

Figure 12: Global Market Y-o-Y Growth (%) Projections by End User, 2022 to 2032

Figure 13: Global Market Attractiveness by Wound Type, 2022 to 2032

Figure 14: Global Market Attractiveness by End User, 2022 to 2032

Figure 15: Global Market Attractiveness by Region, 2022 to 2032

Figure 16: North America Market Value (US$ Million) by Wound Type, 2022 to 2032

Figure 17: North America Market Value (US$ Million) by End User, 2022 to 2032

Figure 18: North America Market Value (US$ Million) by Country, 2022 to 2032

Figure 19: North America Market Value (US$ Million) Analysis by Country, 2017 to 2032

Figure 20: North America Market Value Share (%) and BPS Analysis by Country, 2022 to 2032

Figure 21: North America Market Y-o-Y Growth (%) Projections by Country, 2022 to 2032

Figure 22: North America Market Value (US$ Million) Analysis by Wound Type, 2017 to 2032

Figure 23: North America Market Value Share (%) and BPS Analysis by Wound Type, 2022 to 2032

Figure 24: North America Market Y-o-Y Growth (%) Projections by Wound Type, 2022 to 2032

Figure 25: North America Market Value (US$ Million) Analysis by End User, 2017 to 2032

Figure 26: North America Market Value Share (%) and BPS Analysis by End User, 2022 to 2032

Figure 27: North America Market Y-o-Y Growth (%) Projections by End User, 2022 to 2032

Figure 28: North America Market Attractiveness by Wound Type, 2022 to 2032

Figure 29: North America Market Attractiveness by End User, 2022 to 2032

Figure 30: North America Market Attractiveness by Country, 2022 to 2032

Figure 31: Latin America Market Value (US$ Million) by Wound Type, 2022 to 2032

Figure 32: Latin America Market Value (US$ Million) by End User, 2022 to 2032

Figure 33: Latin America Market Value (US$ Million) by Country, 2022 to 2032

Figure 34: Latin America Market Value (US$ Million) Analysis by Country, 2017 to 2032

Figure 35: Latin America Market Value Share (%) and BPS Analysis by Country, 2022 to 2032

Figure 36: Latin America Market Y-o-Y Growth (%) Projections by Country, 2022 to 2032

Figure 37: Latin America Market Value (US$ Million) Analysis by Wound Type, 2017 to 2032

Figure 38: Latin America Market Value Share (%) and BPS Analysis by Wound Type, 2022 to 2032

Figure 39: Latin America Market Y-o-Y Growth (%) Projections by Wound Type, 2022 to 2032

Figure 40: Latin America Market Value (US$ Million) Analysis by End User, 2017 to 2032

Figure 41: Latin America Market Value Share (%) and BPS Analysis by End User, 2022 to 2032

Figure 42: Latin America Market Y-o-Y Growth (%) Projections by End User, 2022 to 2032

Figure 43: Latin America Market Attractiveness by Wound Type, 2022 to 2032

Figure 44: Latin America Market Attractiveness by End User, 2022 to 2032

Figure 45: Latin America Market Attractiveness by Country, 2022 to 2032

Figure 46: Europe Market Value (US$ Million) by Wound Type, 2022 to 2032

Figure 47: Europe Market Value (US$ Million) by End User, 2022 to 2032

Figure 48: Europe Market Value (US$ Million) by Country, 2022 to 2032

Figure 49: Europe Market Value (US$ Million) Analysis by Country, 2017 to 2032

Figure 50: Europe Market Value Share (%) and BPS Analysis by Country, 2022 to 2032

Figure 51: Europe Market Y-o-Y Growth (%) Projections by Country, 2022 to 2032

Figure 52: Europe Market Value (US$ Million) Analysis by Wound Type, 2017 to 2032

Figure 53: Europe Market Value Share (%) and BPS Analysis by Wound Type, 2022 to 2032

Figure 54: Europe Market Y-o-Y Growth (%) Projections by Wound Type, 2022 to 2032

Figure 55: Europe Market Value (US$ Million) Analysis by End User, 2017 to 2032

Figure 56: Europe Market Value Share (%) and BPS Analysis by End User, 2022 to 2032

Figure 57: Europe Market Y-o-Y Growth (%) Projections by End User, 2022 to 2032

Figure 58: Europe Market Attractiveness by Wound Type, 2022 to 2032

Figure 59: Europe Market Attractiveness by End User, 2022 to 2032

Figure 60: Europe Market Attractiveness by Country, 2022 to 2032

Figure 61: Asia Pacific Market Value (US$ Million) by Wound Type, 2022 to 2032

Figure 62: Asia Pacific Market Value (US$ Million) by End User, 2022 to 2032

Figure 63: Asia Pacific Market Value (US$ Million) by Country, 2022 to 2032

Figure 64: Asia Pacific Market Value (US$ Million) Analysis by Country, 2017 to 2032

Figure 65: Asia Pacific Market Value Share (%) and BPS Analysis by Country, 2022 to 2032

Figure 66: Asia Pacific Market Y-o-Y Growth (%) Projections by Country, 2022 to 2032

Figure 67: Asia Pacific Market Value (US$ Million) Analysis by Wound Type, 2017 to 2032

Figure 68: Asia Pacific Market Value Share (%) and BPS Analysis by Wound Type, 2022 to 2032

Figure 69: Asia Pacific Market Y-o-Y Growth (%) Projections by Wound Type, 2022 to 2032

Figure 70: Asia Pacific Market Value (US$ Million) Analysis by End User, 2017 to 2032

Figure 71: Asia Pacific Market Value Share (%) and BPS Analysis by End User, 2022 to 2032

Figure 72: Asia Pacific Market Y-o-Y Growth (%) Projections by End User, 2022 to 2032

Figure 73: Asia Pacific Market Attractiveness by Wound Type, 2022 to 2032

Figure 74: Asia Pacific Market Attractiveness by End User, 2022 to 2032

Figure 75: Asia Pacific Market Attractiveness by Country, 2022 to 2032

Figure 76: Middle East and Africa Market Value (US$ Million) by Wound Type, 2022 to 2032

Figure 77: Middle East and Africa Market Value (US$ Million) by End User, 2022 to 2032

Figure 78: Middle East and Africa Market Value (US$ Million) by Country, 2022 to 2032

Figure 79: Middle East and Africa Market Value (US$ Million) Analysis by Country, 2017 to 2032

Figure 80: Middle East and Africa Market Value Share (%) and BPS Analysis by Country, 2022 to 2032

Figure 81: Middle East and Africa Market Y-o-Y Growth (%) Projections by Country, 2022 to 2032

Figure 82: Middle East and Africa Market Value (US$ Million) Analysis by Wound Type, 2017 to 2032

Figure 83: Middle East and Africa Market Value Share (%) and BPS Analysis by Wound Type, 2022 to 2032

Figure 84: Middle East and Africa Market Y-o-Y Growth (%) Projections by Wound Type, 2022 to 2032

Figure 85: Middle East and Africa Market Value (US$ Million) Analysis by End User, 2017 to 2032

Figure 86: Middle East and Africa Market Value Share (%) and BPS Analysis by End User, 2022 to 2032

Figure 87: Middle East and Africa Market Y-o-Y Growth (%) Projections by End User, 2022 to 2032

Figure 88: Middle East and Africa Market Attractiveness by Wound Type, 2022 to 2032

Figure 89: Middle East and Africa Market Attractiveness by End User, 2022 to 2032

Figure 90: Middle East and Africa Market Attractiveness by Country, 2022 to 2032

Recommendations

Healthcare

Advanced Wound Dressing Market

Published : March 2024

Healthcare

Combat Dressing Market

Published : July 2023

Explore Healthcare Insights

View Reports

Hydrokinetic Fibre Dressings Market