The global acrylic fibre market is valued at USD 6.1 billion in 2025. It is slated to reach USD 9.2 billion by 2035, recording an absolute increase of USD 3 billion over the forecast period. This translates into a total growth of 49.2%, with the market forecast to expand at a compound annual growth rate (CAGR) of 4.2% between 2025 and 2035.
As per Future Market Insights, acknowledged as a global advisory partner, The overall market size is expected to grow by nearly 1.49X during the same period, supported by increasing demand for knitwear and cold-weather apparel in emerging markets, growing adoption of gel-dyed and solution-dyed acrylic fibres for improved sustainability, and rising emphasis on wool-blend and technical textile applications across diverse apparel, home furnishing, carpet, and industrial filter applications.
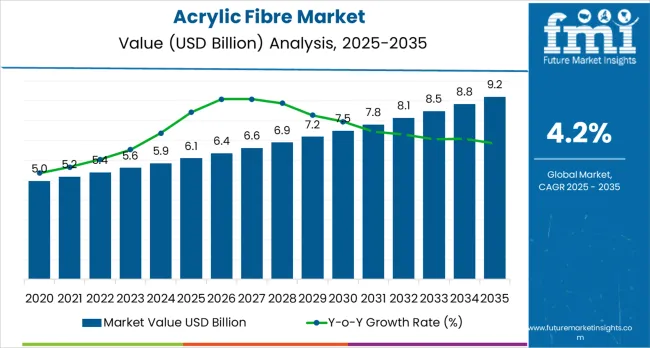
Between 2025 and 2030, the acrylic fibre market is projected to expand from USD 6.1 billion to USD 7.4 billion, resulting in a value increase of USD 1.3 billion, which represents 43.3% of the total forecast growth for the decade. This phase of development will be shaped by increasing organized retail penetration in emerging markets, rising adoption of recycled acrylic fiber and circular economy initiatives, and growing demand for sustainable dyeing technologies, including gel-dyeing and dope-dyeing, that reduce water consumption and environmental impact. Knitwear manufacturers and home textile producers are expanding their acrylic fiber capabilities to address the growing demand for affordable yet functional textile solutions that support fashion versatility and sustainability objectives.
| Metric | Value |
|---|---|
| Estimated Value in (2025E) | USD 6.1 billion |
| Forecast Value in (2035F) | USD 9.2 billion |
| Forecast CAGR (2025 to 2035) | 4.2% |
From 2030 to 2035, the market is forecast to grow from USD 7.4 billion to USD 9.2 billion, adding another USD 1.7 billion, which constitutes 56.7% of the overall ten-year expansion. This period is expected to be characterized by the expansion of circular economy programs incorporating closed-loop acrylic fibre recycling, the development of bio-based acrylonitrile production pathways reducing carbon footprint, and the growth of technical textile applications including automotive interiors, outdoor performance fabrics, and industrial filtration systems. The growing adoption of antimicrobial and functional finishes alongside digital printing technologies will drive demand for acrylic fibres with enhanced performance characteristics and customization capabilities.
Between 2020 and 2025, the acrylic fibre market experienced steady growth, driven by increasing cold-weather apparel consumption in emerging markets and growing recognition of acrylic fibre as essential synthetic fibres offering wool-like properties, excellent colorfastness, and affordable pricing across diverse knitwear, home textile, and carpet applications. The market developed as fashion brands and textile manufacturers recognized the potential for acrylic fibre to deliver superior softness, vibrant color retention, and easy-care properties while supporting accessible price points and versatile blending opportunities. Technological advancement in gel-dyeing and solution-dyeing processes began emphasizing the critical importance of reducing water consumption and environmental impact in synthetic fibre production.
Market expansion is being supported by the increasing global demand for affordable knitwear and cold-weather apparel driven by rising disposable incomes in emerging markets and expanding organized retail penetration, alongside the corresponding need for synthetic fibres that can deliver wool-like warmth, excellent color vibrancy, and easy-care properties across various sweater, winterwear, carpet, and home textile applications. Modern knitwear manufacturers and home textile producers are increasingly focused on implementing acrylic fibre solutions that can provide cost-effective alternatives to natural wool, deliver superior colorfastness, and meet growing consumer expectations for functional yet fashionable textile products.
The growing emphasis on sustainability and water conservation is driving demand for gel-dyed and solution-dyed acrylic fibres that substantially reduce water consumption, eliminate effluent discharge, and lower energy requirements compared to conventional post-dyeing processes. Textile industry preference for fibres that combine environmental responsibility with superior technical performance and cost competitiveness is creating opportunities for innovative acrylic fibre implementations. The rising influence of circular economy principles and recycling technologies is also contributing to increased adoption of recycled acrylic fibres that provide environmental credentials without compromising product quality or manufacturing efficiency.
The market is segmented by fibre form, end-use, dyeing/coloration method, blending material, and region. By fibre form, the market is divided into staple and tow. Based on end-use, the market is categorized into apparel, home furnishing, carpet, and industrial applications. By dyeing/coloration method, the market is classified into gel-dyed (dope-dyed), stock-dyed, and yarn-dyed. By blending material, the market includes wool blends, cotton blends, polyester blends, and other combinations. Regionally, the market is divided into Asia Pacific, Europe, North America, Latin America, and Middle East &Africa.
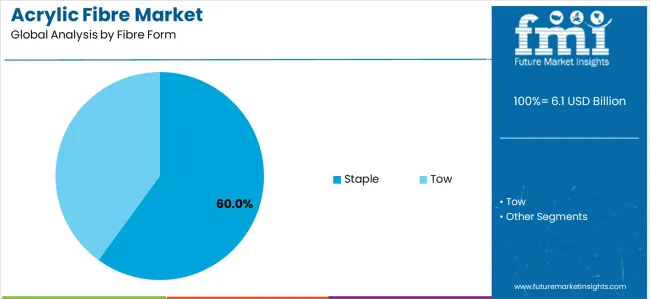
The staple segment is projected to maintain its leading position in the acrylic fibre market in 2025 with a 60.0% market share, reaffirming its role as the preferred fibre form category for yarn spinning, knitwear production, and home textile manufacturing. Textile manufacturers increasingly utilize acrylic staple fibres for their versatility in spinning systems, excellent blending characteristics, and proven effectiveness in producing soft hand-feel fabrics suitable for apparel and furnishing applications. Staple fibre technology's proven versatility and processing compatibility directly address the industry requirements for flexible textile manufacturing across diverse yarn counts and fabric constructions.
This fibre form segment forms the foundation of modern acrylic textile production, as it represents the configuration with the greatest application versatility and established processing infrastructure across multiple spinning technologies including ring spinning, rotor spinning, and friction spinning systems. Textile industry investments in yarn manufacturing technologies continue to strengthen staple fibre adoption among spinners and knitwear producers. With fashion diversity requiring varied yarn characteristics and fabric structures, acrylic staple fibres align with both versatility objectives and manufacturing requirements, making them the central fibre form for comprehensive knitwear and home textile strategies.
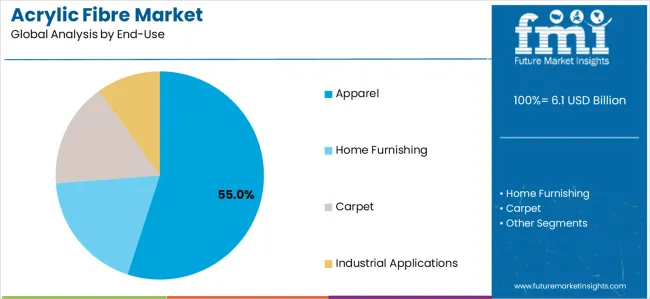
The apparel end-use segment is projected to represent the largest share of acrylic fibre demand in 2025 with a 55% market share, underscoring its critical role as the primary driver for acrylic fibre consumption across knitwear, winterwear, athleisure, and kidswear applications. Fashion brands and apparel manufacturers prefer acrylic fibres for garment production due to their wool-like warmth, excellent color retention, superior softness, and ability to deliver fashionable products at accessible price points while supporting diverse styling requirements. Positioned as essential synthetic fibres for modern affordable fashion, acrylic fibres offer both performance advantages and economic benefits.
The segment is supported by continuous evolution in fast fashion and the growing consumer appetite for versatile knitwear spanning casual, workwear, and transitional seasonal categories. Additionally, apparel manufacturers are investing in comprehensive sustainable sourcing programs to support increasingly conscious consumer preferences and brand sustainability commitments. As emerging market consumers expand wardrobes and cold-weather apparel demand grows with urbanization, the apparel end-use segment will continue to dominate the market while supporting advanced acrylic fibre utilization and product innovation strategies.
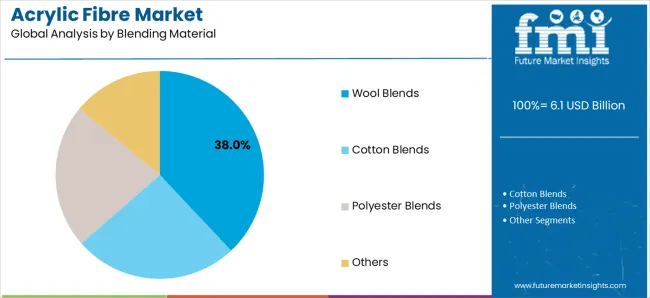
The wool blends segment is projected to maintain its leading position in the acrylic fibre market in 2025 with a 38% market share, reaffirming its role as the preferred blending category for premium knitwear and cold-weather apparel combining natural fibre luxury with synthetic fibre performance. Knitwear manufacturers increasingly specify acrylic/wool blends for their optimal balance of warmth, softness, affordability, and easy-care properties that appeal to value-conscious consumers seeking wool-like aesthetics without premium pricing or special care requirements. Wool blending technology's market acceptance and performance versatility directly address the requirements for accessible luxury knitwear spanning fashion and functional applications.
This blending segment represents the foundation of classic knitwear manufacturing, encompassing traditional sweater constructions, transitional layering pieces, and cold-weather accessories that benefit from combining wool's natural properties with acrylic's colorfastness and durability. Fashion industry evolution toward versatile trans-seasonal pieces continues to strengthen acrylic/wool blend adoption among knitwear brands. With consumers seeking products offering natural fibre appeal at accessible prices alongside easy maintenance, acrylic/wool blends support both aesthetic objectives and practical requirements throughout apparel markets.
The acrylic fibre market is advancing steadily due to increasing demand for affordable knitwear and cold-weather apparel driven by rising disposable incomes in emerging markets, alongside growing adoption of gel-dyed and solution-dyed acrylic fibres that provide substantial environmental benefits through reduced water consumption and eliminated effluent discharge across diverse apparel, home furnishing, carpet, and technical textile applications. However, the market faces challenges, including competition from other synthetic fibres particularly polyester in price-sensitive segments, environmental concerns regarding acrylonitrile production and fibre microplastic shedding, and volatile raw material costs affecting production economics and price competitiveness. Innovation in recycled acrylic fibre technologies and bio-based acrylonitrile production continues to influence product development and market sustainability trajectories.
The rapid growth of middle-class populations in India, China, and Southeast Asian markets is driving substantial demand for affordable fashion knitwear as consumers expand wardrobes and seek versatile apparel options spanning casual, workwear, and social occasions. Rising disposable incomes and urbanization are fueling organized retail expansion including international fast-fashion chains, domestic branded retailers, and e-commerce platforms that drive volume consumption of knitwear incorporating acrylic fibres. Cold-weather regions within tropical countries including hill stations, northern territories, and air-conditioned urban environments are creating year-round demand for lightweight sweaters and transitional layering pieces utilizing acrylic's insulating properties without excessive bulk. These demographic and retail trends create sustained acrylic fibre demand growth throughout emerging markets representing the primary volume expansion opportunity for global and regional fibre producers.
Modern acrylic fibre manufacturers are investing in circular economy initiatives including closed-loop recycling systems that recover post-consumer acrylic textiles and post-industrial waste for conversion back into virgin-quality acrylic fibres. Thai Acrylic Fibre (Aditya Birla) expanded rollout of recycled acrylic fibre lines in 2024, incorporating closed-loop feedstock integration for apparel and home textiles through partnerships with mills. Chemical recycling technologies enable depolymerization of acrylic waste back to acrylonitrile monomer, theoretically enabling infinite recycling cycles without quality degradation unlike mechanical recycling limitations. Leading brands and retailers are establishing take-back programs and recycled content commitments driving market pull for recycled acrylic fibres, creating premium positioning opportunities for manufacturers with validated recycling capabilities. These sustainability initiatives respond to regulatory pressures including EU textile strategy requirements and consumer preferences increasingly favoring circular products over virgin alternatives.
The acrylic fibre industry is expanding beyond traditional apparel and home textiles into technical applications including automotive interior fabrics, outdoor performance textiles, industrial filtration media, and specialty protective garments leveraging acrylic's inherent properties including flame resistance, chemical stability, and UV resistance. Automotive manufacturers utilize acrylic-based upholstery fabrics and headliners for their soft hand-feel, excellent colorfastness, and competitive cost structures compared to polyester alternatives. Outdoor brands incorporate UV-stabilized acrylic fibres in awnings, marine textiles, and performance apparel requiring long-term colorfastness under intense sunlight exposure. Industrial filtration applications exploit acrylic's chemical resistance and thermal stability in demanding processing environments. These technical segments command premium pricing relative to commodity apparel applications while requiring specialized fibre grades with tailored performance characteristics, creating differentiated market opportunities supporting innovation and value-added positioning.
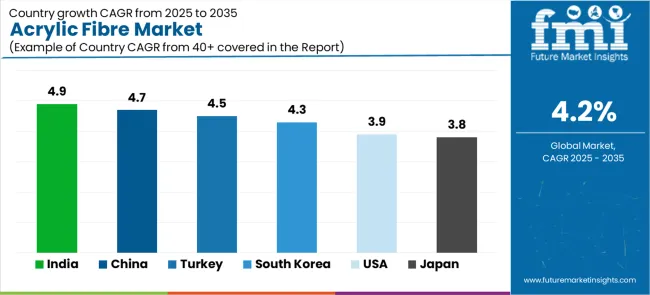
| Country | CAGR (2025-2035) |
|---|---|
| India | 4.9% |
| China | 4.7% |
| Turkey | 4.5% |
| South Korea | 4.3% |
| United States | 3.9% |
| Japan | 3.8% |
The acrylic fibre market is experiencing solid growth globally, with India leading at a 4.9% CAGR through 2035, driven by rapid growth in knitwear and home textiles, expanding organized retail penetration, and increasing investments in recycling and low-water dyeing technologies. China follows at 4.7%, supported by massive scale in apparel exports, technical upgrades in spinning and dyeing operations, and growing inland demand for cold-weather apparel. Turkey shows growth at 4.5%, emphasizing export-oriented yarn and fabric production base, geographic proximity to European Union fast fashion markets, and integrated acrylonitrile-to-acrylic fibre assets. South Korea demonstrates 4.3% growth, supported by fashion and outdoor brand development, smart and antimicrobial finishing technologies, and growing home décor segment. The United States exhibits 3.9% growth, emphasizing stable demand in blankets and outdoor applications alongside automotive interiors and contract upholstery niches. Japan shows 3.8% growth, supported by high-performance blends, functional sports and outdoor applications, and quality-led small-lot production capabilities.
The report covers an in-depth analysis of 40+ countries top-performing countries are highlighted below.
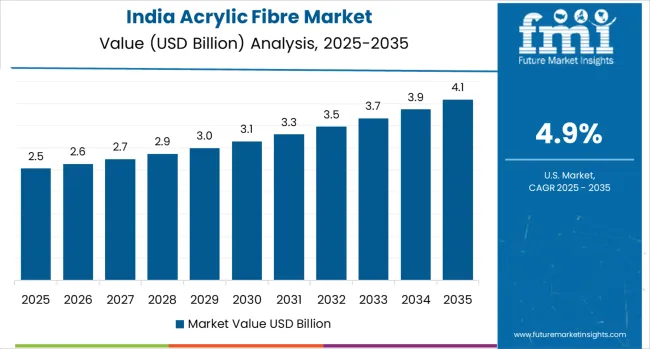
Revenue from acrylic fibre in India is projected to exhibit exceptional growth with a CAGR of 4.9% through 2035, driven by explosive growth in knitwear and home textiles consumption, rapidly expanding organized retail infrastructure including international and domestic branded chains, and increasing investments in sustainable technologies including recycling and low-water dyeing processes supported by Make in India textile initiatives. The country's massive textile manufacturing base and growing middle-class consumer market are creating substantial demand for acrylic fibres. Major textile manufacturers and fibre producers are establishing comprehensive production capabilities to serve rapidly growing domestic and export markets.
Revenue from acrylic fibre in China is expanding at a CAGR of 4.7%, supported by the country's position as the world's largest textile exporter, ongoing technical upgrades in spinning and dyeing operations improving quality and efficiency, and substantial inland demand for cold-weather apparel serving northern provinces and mountainous regions. China's comprehensive textile infrastructure and manufacturing scale are driving sophisticated acrylic fibre capabilities throughout industrial value chains. Leading textile manufacturers and fibre producers are establishing extensive production and innovation facilities.
Revenue from acrylic fibre in Turkey is growing at a CAGR of 4.5%, driven by substantial export-oriented yarn and fabric manufacturing serving European fast fashion markets, strategic geographic proximity enabling rapid delivery to European Union buyers, and integrated acrylonitrile-to-acrylic fibre production assets providing cost advantages. Aksa Akrilik commissioned efficiency upgrades in spinning and gel-dyeing in 2025 to lower specific energy and elevate capacity for higher-value outdoor and wool-blend staples. Turkey's vertical integration and export focus are supporting demand for domestically produced acrylic fibres.
Revenue from acrylic fibre in South Korea is expanding at a CAGR of 4.3%, supported by the country's fashion and outdoor brand development, growing incorporation of smart and antimicrobial finishing technologies, and expanding home décor segment driven by lifestyle trends and interior design consciousness. Korea's fashion innovation and technical textile capabilities are driving demand for specialized acrylic fibres. Fashion brands and textile manufacturers are investing in differentiated product development.
Revenue from acrylic fibre in the United States is expanding at a CAGR of 3.9%, supported by the country's stable demand in blankets and outdoor applications maintaining consistent volume consumption, growing automotive interior fabrics and contract upholstery segments, and specialty niches including performance outdoor textiles. The nation's mature market characteristics and specialty positioning are driving demand for differentiated acrylic fibre applications. Home textile manufacturers and automotive suppliers are maintaining established acrylic fibre usage.
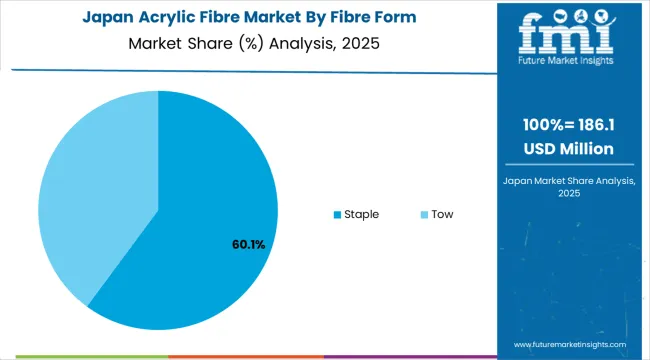
Revenue from acrylic fibre in Japan is expanding at a CAGR of 3.8%, supported by the country's emphasis on high-performance blends for technical applications, functional sports and outdoor textiles incorporating advanced finishing technologies, and quality-led small-lot production capabilities serving premium market segments. Japan's technical sophistication and quality standards are driving demand for specialized acrylic fibres. Leading textile manufacturers are investing in innovative applications and processing technologies.
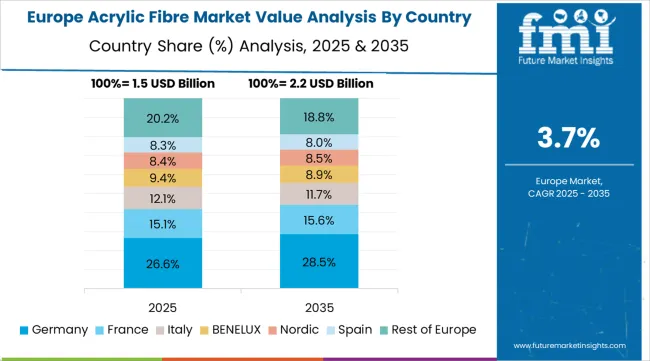
The acrylic fibre market in Europe is projected to grow from USD 1.7 billion in 2025 to USD 2.5 billion by 2035, registering a CAGR of 4.0% over the forecast period. Turkey leads with a 28.5% market share in 2025, maintaining its position at 28.3% by 2035, supported by integrated AKSA capacity and export-led yarn production.
Germany follows with 17.2% in 2025, holding steady at 17.3% by 2035, driven by technical textiles and upholstery applications. Italy holds 12.9% in 2025, easing to 12.7% by 2035 with knitwear clusters in Emilia-Romagna region. Spain accounts for 9.7% in 2025, rising to 9.8% by 2035 with carpets and home textiles. France maintains 9% in 2025, holding steady at 9% by 2035 with fashion and apparel blends. The United Kingdom holds 8% in 2025, easing to 7.9% by 2035 with winterwear and home furnishings. The Rest of Western Europe and Nordics region holds 14.7% in 2025 and 15% by 2035, reflecting outdoor, upholstery, and specialty blend applications across diverse markets.
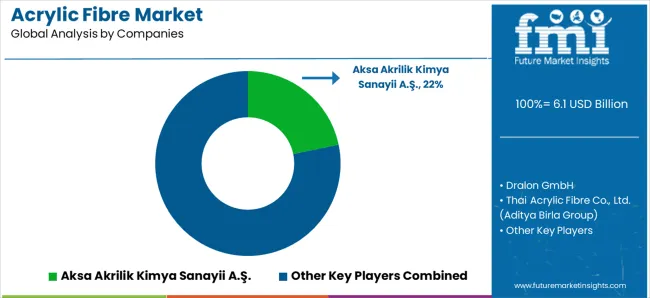
The acrylic fibre market is characterized by competition among established integrated fibre manufacturers, specialized acrylic producers, and diversified chemical companies. Companies are investing in gel-dyeing and solution-dyeing technology development, recycled acrylic fibre production capabilities, energy efficiency improvements, and comprehensive sustainability programs to deliver high-quality, environmentally responsible, and cost-competitive acrylic fibre solutions. Innovation in circular economy implementation, bio-based acrylonitrile production, and functional finishing technologies is central to strengthening market position and competitive advantage.
Aksa Akrilik Kimya Sanayii A.Ş. leads the market with a 22% share, offering comprehensive acrylic fibre solutions with a focus on integrated production from acrylonitrile through finished fibres, gel-dyed and solution-dyed products, and technical excellence across diverse apparel, home textile, and industrial applications. The company commissioned efficiency upgrades in spinning and gel-dyeing in 2025 to lower specific energy and elevate capacity for higher-value outdoor and wool-blend staples. Thai Acrylic Fibre Co., Ltd. (Aditya Birla Group) expanded rollout of recycled acrylic fibre lines in 2024, incorporating closed-loop feedstock integration for apparel and home textiles through partnerships with mills for dope-dyed programs to cut water and energy use.
Dralon GmbH progressed operational restructuring in Europe during 2024/2025 with focus on specialty grades for carpets and technical textiles, emphasizing solution-dyed products for lower lifecycle impact. Jilin Chemical Fiber Group Co., Ltd. provides comprehensive acrylic fibre production serving Chinese domestic markets. TAEKWANG Industrial Co., Ltd. specializes in acrylic fibre manufacturing for Asian markets. Exlan Japan Co., Ltd. focuses on high-quality acrylic fibres for Japanese applications. Kaneka Corporation offers specialty acrylic fibres with technical innovations. Pasupati Acrylon Ltd. serves Indian market with domestic production capabilities. Indian Acrylics Limited provides acrylic fibres for domestic textile industry. Montefibre S.p.A. delivers acrylic fibre solutions for European markets.
Acrylic fibre represents a specialized synthetic textile fibre segment within apparel, home furnishing, carpet, and industrial textile applications, projected to grow from USD 6.1 billion in 2025 to USD 9.2 billion by 2035 at a 4.2% CAGR. These polyacrylonitrile-based synthetic fibres-primarily available in staple and tow forms with various deniers and cut lengths-serve as critical textile materials offering wool-like warmth, excellent colorfastness, superior softness, and easy-care properties where affordable luxury aesthetics, vibrant color retention, and functional performance are essential. Market expansion is driven by increasing knitwear consumption in emerging markets, growing adoption of gel-dyed and solution-dyed fibres for water conservation, expanding circular economy programs incorporating recycled acrylic, and rising demand for technical textile applications across diverse fashion, home textile, automotive interior, and industrial segments.
How Textile Regulators Could Strengthen Sustainability Standards and Product Safety?
How Industry Associations Could Advance Technical Standards and Sustainability?
How Acrylic Fibre Manufacturers Could Drive Innovation and Market Leadership?
How Textile Manufacturers Could Optimize Performance and Sustainability?
How Research Institutions Could Enable Technology Advancement?
How Investors and Financial Enablers Could Support Market Growth and Sustainability?
| Items | Values |
|---|---|
| Quantitative Units (2025) | USD 6.1 billion |
| Fibre Form | Staple, Tow |
| End-Use | Apparel, Home Furnishing, Carpet, Industrial Applications |
| Dyeing/Coloration Method | Gel-Dyed (Dope-Dyed), Stock-Dyed, Yarn-Dyed |
| Blending Material | Wool Blends, Cotton Blends, Polyester Blends, Others |
| Regions Covered | Asia Pacific, Europe, North America, Latin America, Middle East &Africa |
| Countries Covered | India, China, Turkey, South Korea, European Union, United States, Japan, and 40+ countries |
| Key Companies Profiled | Aksa Akrilik Kimya Sanayii A.Ş., Dralon GmbH, Thai Acrylic Fibre Co., Ltd., Jilin Chemical Fiber Group Co., Ltd., TAEKWANG Industrial Co., Ltd. |
| Additional Attributes | Dollar sales by fibre form, end-use, dyeing method, and blending material category, regional demand trends, competitive landscape, technological advancements in gel-dyeing, recycled fibre innovation, and circular economy development |
The global acrylic fibre market is estimated to be valued at USD 6.1 billion in 2025.
The market size for the acrylic fibre market is projected to reach USD 9.2 billion by 2035.
The acrylic fibre market is expected to grow at a 4.2% CAGR between 2025 and 2035.
The key product types in acrylic fibre market are staple and tow.
In terms of end-use, apparel segment to command 55.0% share in the acrylic fibre market in 2025.


Full Research Suite comprises of:
Market outlook & trends analysis
Interviews & case studies
Strategic recommendations
Vendor profiles & capabilities analysis
5-year forecasts
8 regions and 60+ country-level data splits
Market segment data splits
12 months of continuous data updates
DELIVERED AS:
PDF EXCEL ONLINE
Staple Acrylic Fibre Market Size and Share Forecast Outlook 2025 to 2035
Acrylic Paint Market Forecast and Outlook 2025 to 2035
Acrylic Emulsions Market Size and Share Forecast Outlook 2025 to 2035
Acrylic Polymer Market Size and Share Forecast Outlook 2025 to 2035
Acrylic Resin Market Size and Share Forecast Outlook 2025 to 2035
Acrylic Fine Particle Market Size and Share Forecast Outlook 2025 to 2035
Acrylic Boxes Market Size and Share Forecast Outlook 2025 to 2035
Acrylic Paper Market Size and Share Forecast Outlook 2025 to 2035
Acrylic Pad Market Size and Share Forecast Outlook 2025 to 2035
Acrylic Adhesives Market Growth - Trends & Forecast 2025 to 2035
Acrylic Teeth Market Trends and Assessment for 2025 to 2035
Acrylic Styrene Acrylonitrile (ASA) Resin Market- Growth & Demand 2025 to 2035
Key Companies & Market Share in the Acrylic Airless Bottle Sector
Analyzing Acrylic Boxes Market Share & Industry Leaders
Acrylic Acid Market Growth - Trends & Forecast 2024 to 2034
Acrylic Airless Bottle Market Trends - Demand & Forecast 2024 to 2034
Acrylic Colors Market
Acrylic Container Market
Acrylic Lenses Market
Acrylic Foam Tapes Market

Thank you!
You will receive an email from our Business Development Manager. Please be sure to check your SPAM/JUNK folder too.
Chat With
MaRIA