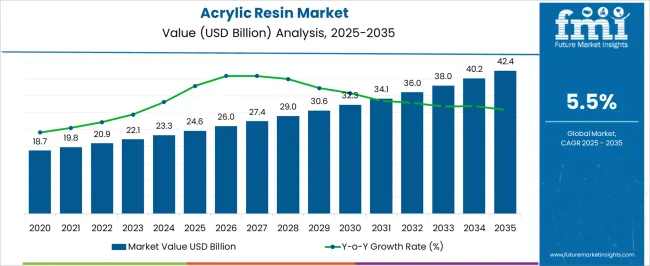
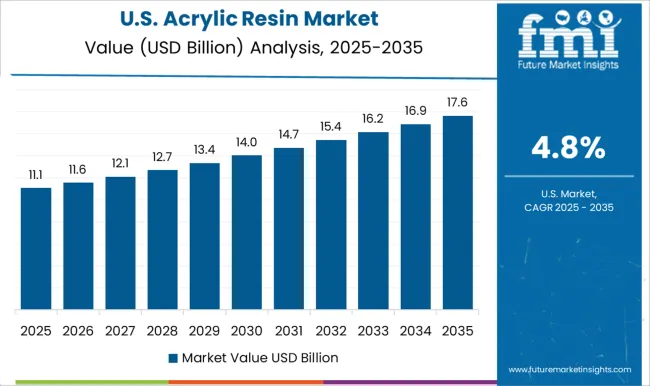
The acrylic resin market is projected to be worth USD 23.3 billion in 2024. The market is anticipated to reach USD 40.0 billion by 2034. The market is further expected to surge at a CAGR of 5.6% during the forecast period 2024 to 2034.
Key Market Trends and Highlights
Attributes | Key Insights |
---|---|
Acrylic Resin Market Estimated Size in 2024 | USD 23.3 billion |
Projected Market Value in 2034 | USD 40.0 billion |
Value-based CAGR from 2024 to 2034 | 5.6% |
The scope for acrylic resin rose at a 5.6% CAGR between 2019 and 2023. The global market for acrylic resin is anticipated to grow at a moderate CAGR of 6.2% over the forecast period 2024 to 2034.
Report Attributes | Details |
---|---|
Market Value in 2019 | USD 17.3 billion |
Market Value in 2023 | USD 22.0 billion |
CAGR from 2019 to 2023 | 6.2% |
The acrylic resin market experienced steady growth during the historical period from 2019 to 2023. Acrylic resins are used in automotive coatings and adhesives. The growth of the automotive industry, driven by factors such as rising disposable income, urbanization, and changing consumer preferences, contributed to increased demand for acrylic resins.
The Asia Pacific region, especially countries like China and India, dominated the market during the historical period, due to rapid industrialization, urbanization, and infrastructure development. The factors contribute to increased demand for acrylic resins in various applications.
Looking ahead to the forecast period from 2024 to 2034, the market is expected to witness significant growth. There has been a growing interest in renewable and bio based acrylic resins as part of the commitment of the industry, to sustainability. Manufacturers exploring eco friendly alternatives are expected to find new opportunities in this segment.
Acrylic resins are used in the manufacturing of medical devices due to their clarity, biocompatibility, and ease of processing. The growth in the healthcare sector and demand for advanced medical equipment and devices can drive the use of acrylic resins.
UV curable acrylic resins have gained popularity due to their fast curing times and low environmental impact. The demand for UV curable coatings in various industries, including electronics, packaging, and automotive, presents growth opportunities for acrylic resin manufacturers.
The below table showcases revenues in terms of the top 5 leading countries, spearheaded by Korea and the United Kingdom. The countries are expected to lead the market through 2034.
Countries | Forecast CAGRs from 2024 to 2034 |
---|---|
The United States | 5.8% |
The United Kingdom | 6.5% |
China | 5.9% |
Japan | 6.0% |
Korea | 7.9% |
The acrylic resin market in the United States expected to expand at a CAGR of 5.8% through 2034. The construction industry is a major consumer of acrylic resins, particularly in applications such as architectural coatings, adhesives, and sealants. Growth in residential, commercial, and infrastructure construction projects boosts demand for acrylic resins.
The automotive industry uses acrylic resins in coatings and adhesives for vehicles. The growth of this industry positively impacts the demand for acrylic resins, with the automotive sector being a key contributor to the economy of the United States.
The acrylic resin market in the United Kingdom is anticipated to expand at a CAGR of 6.5% through 2034. Renovation and remodeling activities, driven by changing consumer preferences and government incentives, contribute to the demand for paints and coatings. Acrylic resins, being commonly used in architectural coatings, benefit from trends in home improvement.
Acrylic resins are used in the production of consumer goods such as appliances, electronics, and household items. The growth in consumer goods manufacturing activities contributes to the increased consumption of acrylic resins.
Acrylic resin trends in China are taking a turn for the better. A 5.9% CAGR is forecast for the country from 2024 to 2034. Acrylic resins are used in the electronics industry for coatings and encapsulation materials. The growth in this sector positively influences the acrylic resin market, with China being a major hub for electronics manufacturing.
Acrylic resins are used in various packaging materials, coatings, and adhesives. The booming e-commerce industry and increased consumer goods packaging contribute to the growth of the market in China.
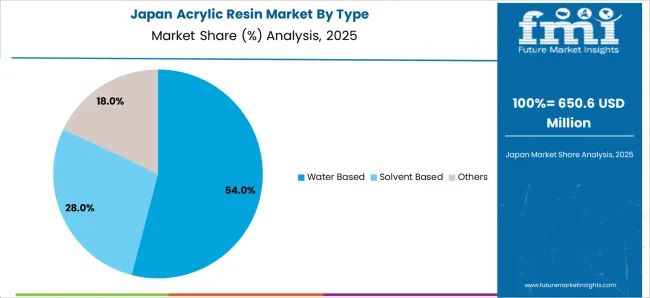
The acrylic resin market in Japan is poised to expand at a CAGR of 6.0% through 2034. Acrylic resins are utilized in various industrial coatings and adhesives. The growth of industrial manufacturing activities in Japan contributes to the increased consumption of acrylic resins in the production of coatings, adhesives, and sealants for industrial use.
Similar to global trends, the adoption of water based acrylic resins over solvent based formulations is driven by environmental concerns and regulations in Japan. The shift towards more sustainable and low VOC coatings supports the growth of water based acrylic resin formulations.
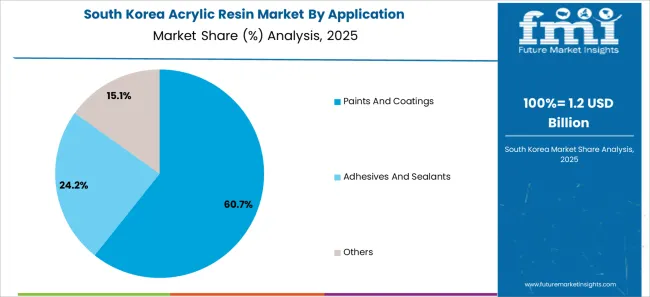
The acrylic resin market in Korea is anticipated to expand at a CAGR of 7.9% through 2034. Korea is a major player in the global shipbuilding industry. Acrylic resins, particularly coatings, are used for corrosion protection and aesthetic finishes in shipbuilding. The growth in the shipbuilding sector can drive the demand for acrylic resins.
Acrylic resins may find applications in coatings and materials used in healthcare facilities and pharmaceutical manufacturing. There can be an increased demand for specialty coatings and adhesives in Korea, as the country invests in advanced healthcare infrastructure.
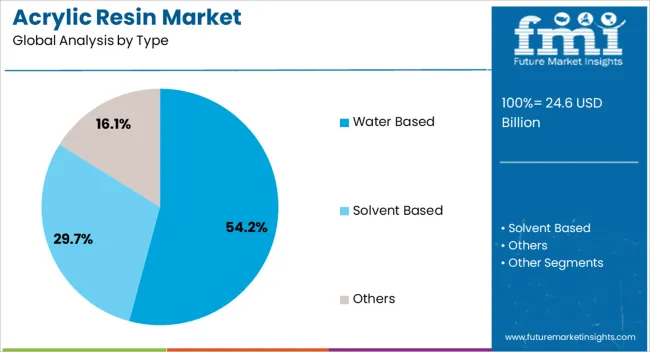
The below table highlights how water based segment is projected to lead the market in terms of type, and is expected to account for a CAGR of 5.4% through 2034.
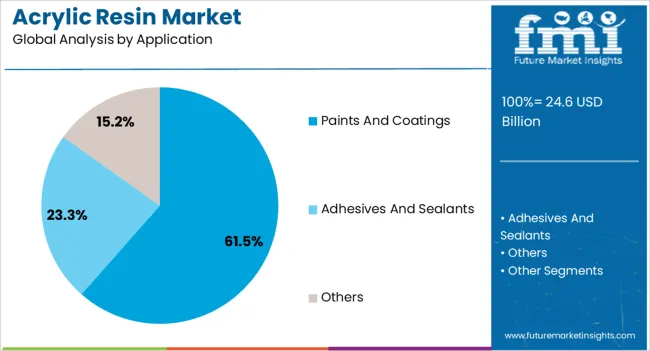
Based on application, the paints and coatings segment is expected to account for a CAGR of 5.3% through 2034.
Category | CAGR in 2034 |
---|---|
Water Based | 5.4% |
Paints and Coatings | 5.3% |
Based on type, the water based segment is expected to continue dominating the acrylic resin market. Water based acrylic resins emit lower levels of VOCs compared to solvent based alternatives. Industries and manufacturers are increasingly choosing water based formulations to comply with regulations and address environmental sustainability goals, as concerns about air quality and environmental impact grow.
Water based acrylic resins are generally considered safer for human health compared to solvent based counterparts. The lower toxicity and reduced flammability of water based formulations contribute to a healthier and safer working environment for operators and end users.
Water based acrylic resins find applications in various industries, including paints and coatings, adhesives, sealants, textiles, and construction. The versatility of water based formulations contributes to their widespread adoption across different sectors.
In terms of application, the paints and coatings segment is expected to continue dominating the acrylic resin market. Acrylic resins offer versatility and formulation flexibility, allowing manufacturers to tailor coatings to meet specific performance requirements. The adaptability makes acrylic resins suitable for a wide range of paints and coatings applications.
Acrylic resin based paints and coatings exhibit excellent weatherability, UV resistance, and durability. The properties make them suitable for outdoor applications, including architectural coatings, automotive coatings, and industrial coatings.
Acrylic resin based coatings typically have fast drying times compared to some other resin types. The attribute contributes to increased efficiency in manufacturing processes, allowing for quicker turnaround times in various applications.
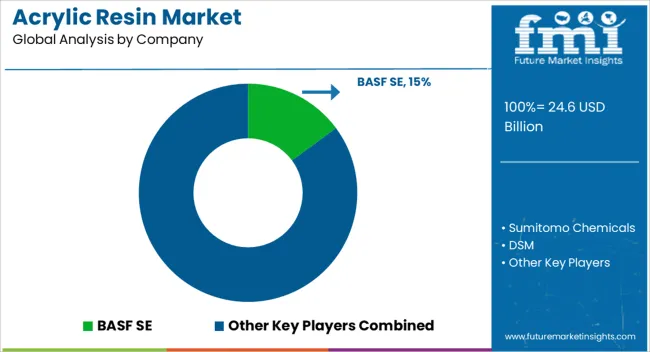
The acrylic resin industry exhibits a dynamic landscape featuring a combination of well established players, regional manufacturers, and emerging companies, all competing to secure their respective market shares. The sector is propelled by industrial expansion, adherence to safety regulations, and the demand for effective vertical access solutions.
Recent Developments
Attribute | Details |
---|---|
Estimated Market Size in 2024 | USD 23.3 billion |
Projected Market Valuation in 2034 | USD 40.0 billion |
Value-based CAGR 2024 to 2034 | 5.6% |
Forecast Period | 2024 to 2034 |
Historical Data Available for | 2019 to 2023 |
Market Analysis | Value in USD billion |
Key Regions Covered | North America; Latin America; Western Europe; Eastern Europe; South Asia and Pacific; East Asia; The Middle East & Africa |
Key Market Segments Covered | Type, Application, End User, Region |
Key Countries Profiled | The United States, Canada, Brazil, Mexico, Germany, France, France, Spain, Italy, Russia, Poland, Czech Republic, Romania, India, Bangladesh, Australia, New Zealand, China, Japan, South Korea, GCC countries, South Africa, Israel |
Key Companies Profiled | BASF SE; Sumitomo Chemicals; DSM; The Dow Company; Showa Denko Materials; Mitsubishi Chemical Holdings; Nippon Shokubai Co. Ltd.; Arkema; DIC Corporation |
Table 1: Global Market Value (US$ Million) Forecast by Region, 2019 to 2034
Table 2: Global Market Volume (Tons) Forecast by Region, 2019 to 2034
Table 3: Global Market Value (US$ Million) Forecast by Type, 2019 to 2034
Table 4: Global Market Volume (Tons) Forecast by Type, 2019 to 2034
Table 5: Global Market Value (US$ Million) Forecast by Application, 2019 to 2034
Table 6: Global Market Volume (Tons) Forecast by Application, 2019 to 2034
Table 7: Global Market Value (US$ Million) Forecast by End-User, 2019 to 2034
Table 8: Global Market Volume (Tons) Forecast by End-User, 2019 to 2034
Table 9: North America Market Value (US$ Million) Forecast by Country, 2019 to 2034
Table 10: North America Market Volume (Tons) Forecast by Country, 2019 to 2034
Table 11: North America Market Value (US$ Million) Forecast by Type, 2019 to 2034
Table 12: North America Market Volume (Tons) Forecast by Type, 2019 to 2034
Table 13: North America Market Value (US$ Million) Forecast by Application, 2019 to 2034
Table 14: North America Market Volume (Tons) Forecast by Application, 2019 to 2034
Table 15: North America Market Value (US$ Million) Forecast by End-User, 2019 to 2034
Table 16: North America Market Volume (Tons) Forecast by End-User, 2019 to 2034
Table 17: Latin America Market Value (US$ Million) Forecast by Country, 2019 to 2034
Table 18: Latin America Market Volume (Tons) Forecast by Country, 2019 to 2034
Table 19: Latin America Market Value (US$ Million) Forecast by Type, 2019 to 2034
Table 20: Latin America Market Volume (Tons) Forecast by Type, 2019 to 2034
Table 21: Latin America Market Value (US$ Million) Forecast by Application, 2019 to 2034
Table 22: Latin America Market Volume (Tons) Forecast by Application, 2019 to 2034
Table 23: Latin America Market Value (US$ Million) Forecast by End-User, 2019 to 2034
Table 24: Latin America Market Volume (Tons) Forecast by End-User, 2019 to 2034
Table 25: Western Europe Market Value (US$ Million) Forecast by Country, 2019 to 2034
Table 26: Western Europe Market Volume (Tons) Forecast by Country, 2019 to 2034
Table 27: Western Europe Market Value (US$ Million) Forecast by Type, 2019 to 2034
Table 28: Western Europe Market Volume (Tons) Forecast by Type, 2019 to 2034
Table 29: Western Europe Market Value (US$ Million) Forecast by Application, 2019 to 2034
Table 30: Western Europe Market Volume (Tons) Forecast by Application, 2019 to 2034
Table 31: Western Europe Market Value (US$ Million) Forecast by End-User, 2019 to 2034
Table 32: Western Europe Market Volume (Tons) Forecast by End-User, 2019 to 2034
Table 33: Eastern Europe Market Value (US$ Million) Forecast by Country, 2019 to 2034
Table 34: Eastern Europe Market Volume (Tons) Forecast by Country, 2019 to 2034
Table 35: Eastern Europe Market Value (US$ Million) Forecast by Type, 2019 to 2034
Table 36: Eastern Europe Market Volume (Tons) Forecast by Type, 2019 to 2034
Table 37: Eastern Europe Market Value (US$ Million) Forecast by Application, 2019 to 2034
Table 38: Eastern Europe Market Volume (Tons) Forecast by Application, 2019 to 2034
Table 39: Eastern Europe Market Value (US$ Million) Forecast by End-User, 2019 to 2034
Table 40: Eastern Europe Market Volume (Tons) Forecast by End-User, 2019 to 2034
Table 41: South Asia and Pacific Market Value (US$ Million) Forecast by Country, 2019 to 2034
Table 42: South Asia and Pacific Market Volume (Tons) Forecast by Country, 2019 to 2034
Table 43: South Asia and Pacific Market Value (US$ Million) Forecast by Type, 2019 to 2034
Table 44: South Asia and Pacific Market Volume (Tons) Forecast by Type, 2019 to 2034
Table 45: South Asia and Pacific Market Value (US$ Million) Forecast by Application, 2019 to 2034
Table 46: South Asia and Pacific Market Volume (Tons) Forecast by Application, 2019 to 2034
Table 47: South Asia and Pacific Market Value (US$ Million) Forecast by End-User, 2019 to 2034
Table 48: South Asia and Pacific Market Volume (Tons) Forecast by End-User, 2019 to 2034
Table 49: East Asia Market Value (US$ Million) Forecast by Country, 2019 to 2034
Table 50: East Asia Market Volume (Tons) Forecast by Country, 2019 to 2034
Table 51: East Asia Market Value (US$ Million) Forecast by Type, 2019 to 2034
Table 52: East Asia Market Volume (Tons) Forecast by Type, 2019 to 2034
Table 53: East Asia Market Value (US$ Million) Forecast by Application, 2019 to 2034
Table 54: East Asia Market Volume (Tons) Forecast by Application, 2019 to 2034
Table 55: East Asia Market Value (US$ Million) Forecast by End-User, 2019 to 2034
Table 56: East Asia Market Volume (Tons) Forecast by End-User, 2019 to 2034
Table 57: Middle East and Africa Market Value (US$ Million) Forecast by Country, 2019 to 2034
Table 58: Middle East and Africa Market Volume (Tons) Forecast by Country, 2019 to 2034
Table 59: Middle East and Africa Market Value (US$ Million) Forecast by Type, 2019 to 2034
Table 60: Middle East and Africa Market Volume (Tons) Forecast by Type, 2019 to 2034
Table 61: Middle East and Africa Market Value (US$ Million) Forecast by Application, 2019 to 2034
Table 62: Middle East and Africa Market Volume (Tons) Forecast by Application, 2019 to 2034
Table 63: Middle East and Africa Market Value (US$ Million) Forecast by End-User, 2019 to 2034
Table 64: Middle East and Africa Market Volume (Tons) Forecast by End-User, 2019 to 2034
Figure 1: Global Market Value (US$ Million) by Type, 2024 to 2034
Figure 2: Global Market Value (US$ Million) by Application, 2024 to 2034
Figure 3: Global Market Value (US$ Million) by End-User, 2024 to 2034
Figure 4: Global Market Value (US$ Million) by Region, 2024 to 2034
Figure 5: Global Market Value (US$ Million) Analysis by Region, 2019 to 2034
Figure 6: Global Market Volume (Tons) Analysis by Region, 2019 to 2034
Figure 7: Global Market Value Share (%) and BPS Analysis by Region, 2024 to 2034
Figure 8: Global Market Y-o-Y Growth (%) Projections by Region, 2024 to 2034
Figure 9: Global Market Value (US$ Million) Analysis by Type, 2019 to 2034
Figure 10: Global Market Volume (Tons) Analysis by Type, 2019 to 2034
Figure 11: Global Market Value Share (%) and BPS Analysis by Type, 2024 to 2034
Figure 12: Global Market Y-o-Y Growth (%) Projections by Type, 2024 to 2034
Figure 13: Global Market Value (US$ Million) Analysis by Application, 2019 to 2034
Figure 14: Global Market Volume (Tons) Analysis by Application, 2019 to 2034
Figure 15: Global Market Value Share (%) and BPS Analysis by Application, 2024 to 2034
Figure 16: Global Market Y-o-Y Growth (%) Projections by Application, 2024 to 2034
Figure 17: Global Market Value (US$ Million) Analysis by End-User, 2019 to 2034
Figure 18: Global Market Volume (Tons) Analysis by End-User, 2019 to 2034
Figure 19: Global Market Value Share (%) and BPS Analysis by End-User, 2024 to 2034
Figure 20: Global Market Y-o-Y Growth (%) Projections by End-User, 2024 to 2034
Figure 21: Global Market Attractiveness by Type, 2024 to 2034
Figure 22: Global Market Attractiveness by Application, 2024 to 2034
Figure 23: Global Market Attractiveness by End-User, 2024 to 2034
Figure 24: Global Market Attractiveness by Region, 2024 to 2034
Figure 25: North America Market Value (US$ Million) by Type, 2024 to 2034
Figure 26: North America Market Value (US$ Million) by Application, 2024 to 2034
Figure 27: North America Market Value (US$ Million) by End-User, 2024 to 2034
Figure 28: North America Market Value (US$ Million) by Country, 2024 to 2034
Figure 29: North America Market Value (US$ Million) Analysis by Country, 2019 to 2034
Figure 30: North America Market Volume (Tons) Analysis by Country, 2019 to 2034
Figure 31: North America Market Value Share (%) and BPS Analysis by Country, 2024 to 2034
Figure 32: North America Market Y-o-Y Growth (%) Projections by Country, 2024 to 2034
Figure 33: North America Market Value (US$ Million) Analysis by Type, 2019 to 2034
Figure 34: North America Market Volume (Tons) Analysis by Type, 2019 to 2034
Figure 35: North America Market Value Share (%) and BPS Analysis by Type, 2024 to 2034
Figure 36: North America Market Y-o-Y Growth (%) Projections by Type, 2024 to 2034
Figure 37: North America Market Value (US$ Million) Analysis by Application, 2019 to 2034
Figure 38: North America Market Volume (Tons) Analysis by Application, 2019 to 2034
Figure 39: North America Market Value Share (%) and BPS Analysis by Application, 2024 to 2034
Figure 40: North America Market Y-o-Y Growth (%) Projections by Application, 2024 to 2034
Figure 41: North America Market Value (US$ Million) Analysis by End-User, 2019 to 2034
Figure 42: North America Market Volume (Tons) Analysis by End-User, 2019 to 2034
Figure 43: North America Market Value Share (%) and BPS Analysis by End-User, 2024 to 2034
Figure 44: North America Market Y-o-Y Growth (%) Projections by End-User, 2024 to 2034
Figure 45: North America Market Attractiveness by Type, 2024 to 2034
Figure 46: North America Market Attractiveness by Application, 2024 to 2034
Figure 47: North America Market Attractiveness by End-User, 2024 to 2034
Figure 48: North America Market Attractiveness by Country, 2024 to 2034
Figure 49: Latin America Market Value (US$ Million) by Type, 2024 to 2034
Figure 50: Latin America Market Value (US$ Million) by Application, 2024 to 2034
Figure 51: Latin America Market Value (US$ Million) by End-User, 2024 to 2034
Figure 52: Latin America Market Value (US$ Million) by Country, 2024 to 2034
Figure 53: Latin America Market Value (US$ Million) Analysis by Country, 2019 to 2034
Figure 54: Latin America Market Volume (Tons) Analysis by Country, 2019 to 2034
Figure 55: Latin America Market Value Share (%) and BPS Analysis by Country, 2024 to 2034
Figure 56: Latin America Market Y-o-Y Growth (%) Projections by Country, 2024 to 2034
Figure 57: Latin America Market Value (US$ Million) Analysis by Type, 2019 to 2034
Figure 58: Latin America Market Volume (Tons) Analysis by Type, 2019 to 2034
Figure 59: Latin America Market Value Share (%) and BPS Analysis by Type, 2024 to 2034
Figure 60: Latin America Market Y-o-Y Growth (%) Projections by Type, 2024 to 2034
Figure 61: Latin America Market Value (US$ Million) Analysis by Application, 2019 to 2034
Figure 62: Latin America Market Volume (Tons) Analysis by Application, 2019 to 2034
Figure 63: Latin America Market Value Share (%) and BPS Analysis by Application, 2024 to 2034
Figure 64: Latin America Market Y-o-Y Growth (%) Projections by Application, 2024 to 2034
Figure 65: Latin America Market Value (US$ Million) Analysis by End-User, 2019 to 2034
Figure 66: Latin America Market Volume (Tons) Analysis by End-User, 2019 to 2034
Figure 67: Latin America Market Value Share (%) and BPS Analysis by End-User, 2024 to 2034
Figure 68: Latin America Market Y-o-Y Growth (%) Projections by End-User, 2024 to 2034
Figure 69: Latin America Market Attractiveness by Type, 2024 to 2034
Figure 70: Latin America Market Attractiveness by Application, 2024 to 2034
Figure 71: Latin America Market Attractiveness by End-User, 2024 to 2034
Figure 72: Latin America Market Attractiveness by Country, 2024 to 2034
Figure 73: Western Europe Market Value (US$ Million) by Type, 2024 to 2034
Figure 74: Western Europe Market Value (US$ Million) by Application, 2024 to 2034
Figure 75: Western Europe Market Value (US$ Million) by End-User, 2024 to 2034
Figure 76: Western Europe Market Value (US$ Million) by Country, 2024 to 2034
Figure 77: Western Europe Market Value (US$ Million) Analysis by Country, 2019 to 2034
Figure 78: Western Europe Market Volume (Tons) Analysis by Country, 2019 to 2034
Figure 79: Western Europe Market Value Share (%) and BPS Analysis by Country, 2024 to 2034
Figure 80: Western Europe Market Y-o-Y Growth (%) Projections by Country, 2024 to 2034
Figure 81: Western Europe Market Value (US$ Million) Analysis by Type, 2019 to 2034
Figure 82: Western Europe Market Volume (Tons) Analysis by Type, 2019 to 2034
Figure 83: Western Europe Market Value Share (%) and BPS Analysis by Type, 2024 to 2034
Figure 84: Western Europe Market Y-o-Y Growth (%) Projections by Type, 2024 to 2034
Figure 85: Western Europe Market Value (US$ Million) Analysis by Application, 2019 to 2034
Figure 86: Western Europe Market Volume (Tons) Analysis by Application, 2019 to 2034
Figure 87: Western Europe Market Value Share (%) and BPS Analysis by Application, 2024 to 2034
Figure 88: Western Europe Market Y-o-Y Growth (%) Projections by Application, 2024 to 2034
Figure 89: Western Europe Market Value (US$ Million) Analysis by End-User, 2019 to 2034
Figure 90: Western Europe Market Volume (Tons) Analysis by End-User, 2019 to 2034
Figure 91: Western Europe Market Value Share (%) and BPS Analysis by End-User, 2024 to 2034
Figure 92: Western Europe Market Y-o-Y Growth (%) Projections by End-User, 2024 to 2034
Figure 93: Western Europe Market Attractiveness by Type, 2024 to 2034
Figure 94: Western Europe Market Attractiveness by Application, 2024 to 2034
Figure 95: Western Europe Market Attractiveness by End-User, 2024 to 2034
Figure 96: Western Europe Market Attractiveness by Country, 2024 to 2034
Figure 97: Eastern Europe Market Value (US$ Million) by Type, 2024 to 2034
Figure 98: Eastern Europe Market Value (US$ Million) by Application, 2024 to 2034
Figure 99: Eastern Europe Market Value (US$ Million) by End-User, 2024 to 2034
Figure 100: Eastern Europe Market Value (US$ Million) by Country, 2024 to 2034
Figure 101: Eastern Europe Market Value (US$ Million) Analysis by Country, 2019 to 2034
Figure 102: Eastern Europe Market Volume (Tons) Analysis by Country, 2019 to 2034
Figure 103: Eastern Europe Market Value Share (%) and BPS Analysis by Country, 2024 to 2034
Figure 104: Eastern Europe Market Y-o-Y Growth (%) Projections by Country, 2024 to 2034
Figure 105: Eastern Europe Market Value (US$ Million) Analysis by Type, 2019 to 2034
Figure 106: Eastern Europe Market Volume (Tons) Analysis by Type, 2019 to 2034
Figure 107: Eastern Europe Market Value Share (%) and BPS Analysis by Type, 2024 to 2034
Figure 108: Eastern Europe Market Y-o-Y Growth (%) Projections by Type, 2024 to 2034
Figure 109: Eastern Europe Market Value (US$ Million) Analysis by Application, 2019 to 2034
Figure 110: Eastern Europe Market Volume (Tons) Analysis by Application, 2019 to 2034
Figure 111: Eastern Europe Market Value Share (%) and BPS Analysis by Application, 2024 to 2034
Figure 112: Eastern Europe Market Y-o-Y Growth (%) Projections by Application, 2024 to 2034
Figure 113: Eastern Europe Market Value (US$ Million) Analysis by End-User, 2019 to 2034
Figure 114: Eastern Europe Market Volume (Tons) Analysis by End-User, 2019 to 2034
Figure 115: Eastern Europe Market Value Share (%) and BPS Analysis by End-User, 2024 to 2034
Figure 116: Eastern Europe Market Y-o-Y Growth (%) Projections by End-User, 2024 to 2034
Figure 117: Eastern Europe Market Attractiveness by Type, 2024 to 2034
Figure 118: Eastern Europe Market Attractiveness by Application, 2024 to 2034
Figure 119: Eastern Europe Market Attractiveness by End-User, 2024 to 2034
Figure 120: Eastern Europe Market Attractiveness by Country, 2024 to 2034
Figure 121: South Asia and Pacific Market Value (US$ Million) by Type, 2024 to 2034
Figure 122: South Asia and Pacific Market Value (US$ Million) by Application, 2024 to 2034
Figure 123: South Asia and Pacific Market Value (US$ Million) by End-User, 2024 to 2034
Figure 124: South Asia and Pacific Market Value (US$ Million) by Country, 2024 to 2034
Figure 125: South Asia and Pacific Market Value (US$ Million) Analysis by Country, 2019 to 2034
Figure 126: South Asia and Pacific Market Volume (Tons) Analysis by Country, 2019 to 2034
Figure 127: South Asia and Pacific Market Value Share (%) and BPS Analysis by Country, 2024 to 2034
Figure 128: South Asia and Pacific Market Y-o-Y Growth (%) Projections by Country, 2024 to 2034
Figure 129: South Asia and Pacific Market Value (US$ Million) Analysis by Type, 2019 to 2034
Figure 130: South Asia and Pacific Market Volume (Tons) Analysis by Type, 2019 to 2034
Figure 131: South Asia and Pacific Market Value Share (%) and BPS Analysis by Type, 2024 to 2034
Figure 132: South Asia and Pacific Market Y-o-Y Growth (%) Projections by Type, 2024 to 2034
Figure 133: South Asia and Pacific Market Value (US$ Million) Analysis by Application, 2019 to 2034
Figure 134: South Asia and Pacific Market Volume (Tons) Analysis by Application, 2019 to 2034
Figure 135: South Asia and Pacific Market Value Share (%) and BPS Analysis by Application, 2024 to 2034
Figure 136: South Asia and Pacific Market Y-o-Y Growth (%) Projections by Application, 2024 to 2034
Figure 137: South Asia and Pacific Market Value (US$ Million) Analysis by End-User, 2019 to 2034
Figure 138: South Asia and Pacific Market Volume (Tons) Analysis by End-User, 2019 to 2034
Figure 139: South Asia and Pacific Market Value Share (%) and BPS Analysis by End-User, 2024 to 2034
Figure 140: South Asia and Pacific Market Y-o-Y Growth (%) Projections by End-User, 2024 to 2034
Figure 141: South Asia and Pacific Market Attractiveness by Type, 2024 to 2034
Figure 142: South Asia and Pacific Market Attractiveness by Application, 2024 to 2034
Figure 143: South Asia and Pacific Market Attractiveness by End-User, 2024 to 2034
Figure 144: South Asia and Pacific Market Attractiveness by Country, 2024 to 2034
Figure 145: East Asia Market Value (US$ Million) by Type, 2024 to 2034
Figure 146: East Asia Market Value (US$ Million) by Application, 2024 to 2034
Figure 147: East Asia Market Value (US$ Million) by End-User, 2024 to 2034
Figure 148: East Asia Market Value (US$ Million) by Country, 2024 to 2034
Figure 149: East Asia Market Value (US$ Million) Analysis by Country, 2019 to 2034
Figure 150: East Asia Market Volume (Tons) Analysis by Country, 2019 to 2034
Figure 151: East Asia Market Value Share (%) and BPS Analysis by Country, 2024 to 2034
Figure 152: East Asia Market Y-o-Y Growth (%) Projections by Country, 2024 to 2034
Figure 153: East Asia Market Value (US$ Million) Analysis by Type, 2019 to 2034
Figure 154: East Asia Market Volume (Tons) Analysis by Type, 2019 to 2034
Figure 155: East Asia Market Value Share (%) and BPS Analysis by Type, 2024 to 2034
Figure 156: East Asia Market Y-o-Y Growth (%) Projections by Type, 2024 to 2034
Figure 157: East Asia Market Value (US$ Million) Analysis by Application, 2019 to 2034
Figure 158: East Asia Market Volume (Tons) Analysis by Application, 2019 to 2034
Figure 159: East Asia Market Value Share (%) and BPS Analysis by Application, 2024 to 2034
Figure 160: East Asia Market Y-o-Y Growth (%) Projections by Application, 2024 to 2034
Figure 161: East Asia Market Value (US$ Million) Analysis by End-User, 2019 to 2034
Figure 162: East Asia Market Volume (Tons) Analysis by End-User, 2019 to 2034
Figure 163: East Asia Market Value Share (%) and BPS Analysis by End-User, 2024 to 2034
Figure 164: East Asia Market Y-o-Y Growth (%) Projections by End-User, 2024 to 2034
Figure 165: East Asia Market Attractiveness by Type, 2024 to 2034
Figure 166: East Asia Market Attractiveness by Application, 2024 to 2034
Figure 167: East Asia Market Attractiveness by End-User, 2024 to 2034
Figure 168: East Asia Market Attractiveness by Country, 2024 to 2034
Figure 169: Middle East and Africa Market Value (US$ Million) by Type, 2024 to 2034
Figure 170: Middle East and Africa Market Value (US$ Million) by Application, 2024 to 2034
Figure 171: Middle East and Africa Market Value (US$ Million) by End-User, 2024 to 2034
Figure 172: Middle East and Africa Market Value (US$ Million) by Country, 2024 to 2034
Figure 173: Middle East and Africa Market Value (US$ Million) Analysis by Country, 2019 to 2034
Figure 174: Middle East and Africa Market Volume (Tons) Analysis by Country, 2019 to 2034
Figure 175: Middle East and Africa Market Value Share (%) and BPS Analysis by Country, 2024 to 2034
Figure 176: Middle East and Africa Market Y-o-Y Growth (%) Projections by Country, 2024 to 2034
Figure 177: Middle East and Africa Market Value (US$ Million) Analysis by Type, 2019 to 2034
Figure 178: Middle East and Africa Market Volume (Tons) Analysis by Type, 2019 to 2034
Figure 179: Middle East and Africa Market Value Share (%) and BPS Analysis by Type, 2024 to 2034
Figure 180: Middle East and Africa Market Y-o-Y Growth (%) Projections by Type, 2024 to 2034
Figure 181: Middle East and Africa Market Value (US$ Million) Analysis by Application, 2019 to 2034
Figure 182: Middle East and Africa Market Volume (Tons) Analysis by Application, 2019 to 2034
Figure 183: Middle East and Africa Market Value Share (%) and BPS Analysis by Application, 2024 to 2034
Figure 184: Middle East and Africa Market Y-o-Y Growth (%) Projections by Application, 2024 to 2034
Figure 185: Middle East and Africa Market Value (US$ Million) Analysis by End-User, 2019 to 2034
Figure 186: Middle East and Africa Market Volume (Tons) Analysis by End-User, 2019 to 2034
Figure 187: Middle East and Africa Market Value Share (%) and BPS Analysis by End-User, 2024 to 2034
Figure 188: Middle East and Africa Market Y-o-Y Growth (%) Projections by End-User, 2024 to 2034
Figure 189: Middle East and Africa Market Attractiveness by Type, 2024 to 2034
Figure 190: Middle East and Africa Market Attractiveness by Application, 2024 to 2034
Figure 191: Middle East and Africa Market Attractiveness by End-User, 2024 to 2034
Figure 192: Middle East and Africa Market Attractiveness by Country, 2024 to 2034
The acrylic resin market is projected to reach a valuation of USD 23.3 billion in 2024.
The acrylic resin industry is set to expand by a CAGR of 5.6% through 2034.
The acrylic resin market is forecast to reach USD 40.0 billion by 2034.
Korea is expected to be the top performing market, exhibiting a CAGR of 7.9% through 2034.
Water based is preferred, and is expected to account for a share of 5.4% in 2024.
Explore Similar Insights
Thank you!
You will receive an email from our Business Development Manager. Please be sure to check your SPAM/JUNK folder too.