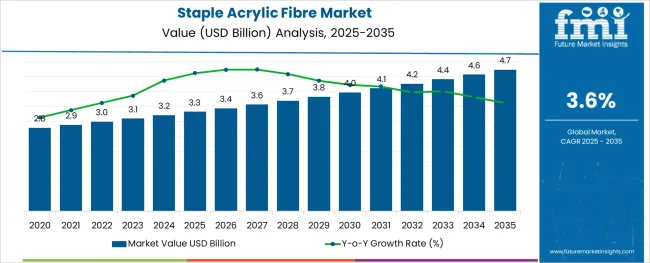
The Staple Acrylic Fibre Market is estimated to be valued at USD 3.3 billion in 2025 and is projected to reach USD 4.7 billion by 2035, registering a compound annual growth rate (CAGR) of 3.6% over the forecast period.
The staple acrylic fibre market is experiencing a stable growth trajectory supported by increasing demand for cost effective, lightweight, and warm synthetic alternatives to natural wool. The fibre's superior softness, moisture resistance, and color retention make it suitable for a wide range of applications in apparel, home textiles, and industrial fabrics.
Technological advancements in dyeing and spinning processes have enhanced fibre performance and versatility, further encouraging adoption across seasonal clothing and blended fabrics. Environmental regulations and raw material innovations are reshaping production strategies toward more energy efficient and sustainable outputs.
With fashion retailers and textile manufacturers seeking reliable substitutes that combine durability and aesthetic appeal, the outlook for staple acrylic fibre remains positive, especially in regions where demand for winter wear and blended textiles continues to grow.
The market is segmented by Dyeing Method, Blend, and End Use and region. By Dyeing Method, the market is divided into Dyed and Undyed. In terms of Blend, the market is classified into Acrylic-Wool, Acrylic-Viscose, Acrylic-Nylon, Acrylic-Cotton, and Others. Based on End Use, the market is segmented into Textiles & Apparel, Hand knitting Yarn, Knitwear, Fur Items, Sportswear, Others, Furniture Upholstery, Industrial Filtration Material, Building & Construction, Automotive, and Others. Regionally, the market is classified into North America, Latin America, Western Europe, Eastern Europe, Balkan & Baltic Countries, Russia & Belarus, Central Asia, East Asia, South Asia & Pacific, and the Middle East & Africa.
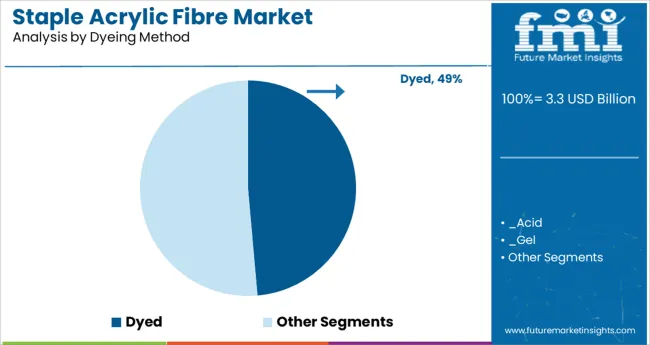
The dyed segment is projected to account for 48.60% of the total market revenue by 2025 under the dyeing method category, making it the dominant approach. This preference is driven by its ability to deliver consistent color quality, reduced production time, and lower water usage compared to conventional piece dyeing.
Dyed fibres enhance product uniformity and aesthetic value while offering better fade resistance, which is crucial for garments exposed to repeated washing and sunlight. Manufacturers are increasingly integrating dyed fibre processing into their supply chains to improve efficiency and maintain design consistency across batches.
As fashion and textile industries demand vibrant, long lasting shades with minimal environmental impact, the dyed method remains the leading solution in the staple acrylic fibre market.
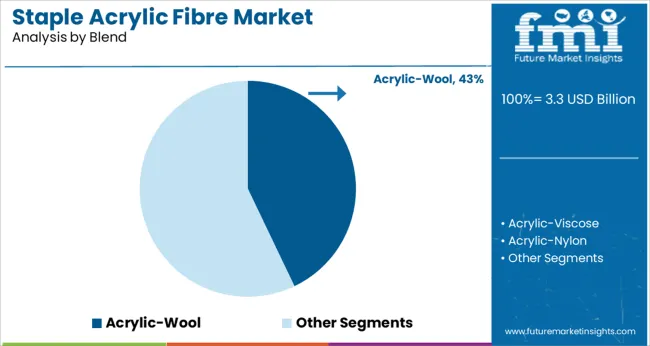
The acrylic wool blend segment is expected to contribute 42.90% of the total market revenue by 2025 within the blend category, establishing it as the leading segment. This blend is favored for combining the warmth and breathability of wool with the durability, wrinkle resistance, and ease of care provided by acrylic fibres.
The resulting fabric mimics natural wool in texture while offering improved affordability and performance under diverse weather conditions. It is widely used in winter clothing, blankets, and knitted garments, where thermal insulation and tactile comfort are essential.
The blend also supports better dye uptake and dimensional stability, making it suitable for mass production. As consumer preference shifts toward hybrid textiles that balance comfort, style, and practicality, the acrylic wool blend continues to be a popular and commercially viable choice in the staple acrylic fibre market.
The staple acrylic fibre market witnessed a CAGR of 0.5% during the historical period of 2020 to 2024. However, with burgeoning demand for staple acrylic fibre from various industries, FMI predicts the global market to exhibit a CAGR of 3.6% between 2025 and 2035.
Staple acrylic fibers have become ideal materials for making a wide range of clothing including sweaters, underwear, sportswear, socks, etc. on account of their high durability, wear resistance, and excellent flexibility.
The rapid growth of industries like textiles & apparel, furniture upholstery, automotive, and others will therefore continue to boost the global staple acrylic fiber market during the forecast period.
Similarly, the development of new staple acrylic blends by using novel technologies is expected to aid in the expansion of the global market over the next ten years.
Widening Application Area of Emerging Acrylic Fibre Creating Lucrative Prospects for the Market
Acrylic fibre can be used as a predecessor in the manufacturing of different fibers, such as carbon fibers. This application of acrylic fibers is growing rapidly, but consumption of acrylic fibre for the manufacturing of carbon fibers is low, which will have an impact on the market in the near future. The top market players are investing heavily in research and development to embrace technology that will benefit the acrylic fibre market.
Recent developments in acrylic fibre include flame-retardant acrylic fibre, weather-resistance acrylic fibre, anti-microbial acrylic fibre, etc. They are used in manufacturing industries, hospitals, etc. This widening application area of acrylic fibre is expected to drive the global market forward during the projection period.
Furthermore, demand for staple acrylic fibre will rise as a result of advancements in processing and technologies that enable the production of acrylic fibre from entirely new sources.
Fluctuation in Raw Material Prices and Rising Environmental Concerns to Limit Market Expansion
Fluctuation in the prices of raw materials like acrylonitrile which is used in the manufacturing of acrylic fibers is a key factor restraining the growth of the global market.
The oil and gas industry is a major source of propylene for acrylonitrile manufacturers. Variations in the price of crude oil will raise the price of petroleum fraction products, which will raise the price of making acrylonitrile. As a result, it is anticipated that the market's high acrylonitrile dependence will impede the expansion of sales.
Similarly, growing environmental concerns is another factor that is limiting the expansion of the staple acrylic fibre market. The environmental impact of acrylic fabric is negative. Further, the industrial methods used to create acrylic fabric are extremely volatile, and the factories that make this fibre are always in danger of blowing up if the required safety precautions aren't taken.
During the making of acrylic fabric, several harmful compounds are employed, and if these substances are not managed or disposed of properly, they invade nearby ecosystems and endanger nearby species and people.
Booming Textiles Industry Driving Demand in India
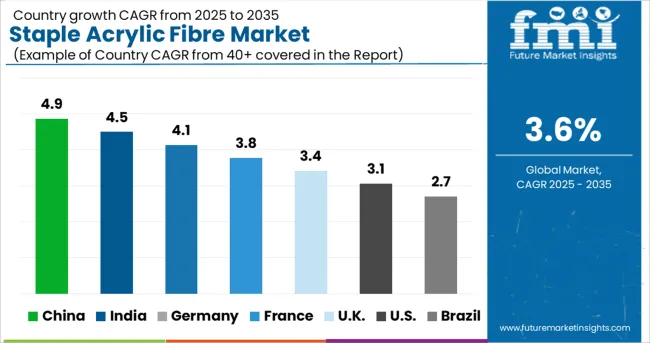
The staple acrylic fibre market in India is expected to reach a valuation of USD 4.7 Million by the end of 2035. This can be attributed to the rapid expansion of the textile industry, favorable government support, and easy availability of raw materials.
The Indian textile industry is one of the country's oldest, stretching back several centuries. The primary basis of India's textile industry is its strong manufacturing base of a diverse variety of bras ranging from natural fibers such as jute, cotton, silk, and wool to man-made fibers such as acrylic, viscose, polyester, viscose, and nylon. India has a 4% share of the global trade in textiles and apparel according to IBEF.
India is one of the major producers of staple acrylic fibre in the global market. The country is home to several key market players which hold a significant share in the global staple fibre market, such as Vardhman, Pasupati, and Indian Acrylics. The economic development, FDI investments, favorable manufacturing conditions, and availability of raw materials & natural fibers for blending are some of the key factors that are expected to propel the growth of the Indian staple acrylic fibre market.
According to the World Trade Organization, India has the world's third-largest textile manufacturing industry, accounting for more than 6% of total textile production. The textile & apparel segment is the major consumer of staple acrylic fibre, which will get benefitted from the growing textile industry.
Rise in Export of Textiles and Clothing Boosting Sales in China
As per FMI, the overall staple acrylic fibre market in China is expected to expand at a steady CAGR of 3.7% during the forecast period (2025 to 2035). Growth in the market is driven by increasing export of textiles and apparel, adoption of advanced manufacturing technologies, and reduced material prices.
China is the world's largest producer and exporter of both raw textiles and finished clothing. Despite shipping fewer clothes and more textiles to the world as a result of the coronavirus pandemic, China maintains its position as the world's leading manufacturer and exporter.
China is and has been, a country on the cutting edge of research for decades. This allows them to develop novel synthetic fibers that aid in the production of textiles. In fact, it is the world's largest producer of acrylic fabric. The country manufactures more than 30% of the world's acrylic fabric and garments and has the largest acrylic clothing market.
The favorable manufacturing conditions, government initiatives, presence of market players & advanced technologies are key crucial factors expected to boost the China staple acrylic fibre market during the next ten years.
Acrylic-Wool Remains the Most Sought-After Blend in the Market
As per FMI, the acrylic-wool segment is anticipated to grow at a CAGR of 4.1% during the forecast period, making it one of the leading segments in terms of the blend. This can be attributed to the rising usage of an acrylic-wool blend across various industries.
Wool has been utilized for clothing since the classical era and has exceptional qualities like warmth, moisture absorption, and wrinkle resistance. Wool's capacity to gradually heal from deformation is a key characteristic. The production of clothing such as sweaters, boots & boot linings, hoodies, hats, gloves, athletic wear, carpeting, blankets, roller brushes, upholstery, area rugs, protective garments, wigs, and hair extensions has come to rely on 100% wool-based fabrics.
Wool and acrylic blends, which are quite popular, are made primarily from the acrylic fibre. Circular knit products are made with these mixes of 45% acrylic and 55% wool fibre. Sportswear with qualities including ease of care, durability, appearance retention, color style, and palatability is made mostly from this combination. Popular blends of acrylic wool that are affordable, appealing, and simple to handle including the 50/50 and 70/30 varieties.
Textile & Apparel Segment to Generate Maximum Revenues Through 2035
Based on end use, the textile & apparel segment is anticipated to reach around USD 2,475.2 Million by the end of 2035. This can be attributed to the rising usage of staple acrylic for making various textiles and apparel products including knitwear, fur items, and sportswear.
Staple acrylic fibers are used to produce garments with a natural appearance due to their capacity to accept multi-color dyes in transparent, vibrant, and subdued tones. Additionally, they exhibit outstanding resistance to the effects of UV deterioration, microbiological attack, and weak alkalis. The demand for staple acrylic fibers from the textile sector is anticipated to increase due to the various qualities that staple acrylic fibre offers.
Acrylic fibers have properties that are most similar to wool fibers. They are soft and light fibers that feel light and warm against the human skin. Acrylic fibers are commonly utilized in knitted products such as sweatshirts, sweaters, and jerseys, bedding fabrics such as blankets and Pile sheets, and home carpets. Although acrylic is very close to wool in its natural condition, depending on the spinning mechanism employed, it can be modified to look like other fabrics, such as cotton.
Increasing apparel demand from the fashion industry, combined with the expansion of e-commerce platforms, is likely to drive market growth throughout the forecast period. The industry is based on three basic principles: creating, manufacturing, and distributing various flexible materials such as yarn and garments. Furthermore, increased consumer demand for wrinkle suiting and shirting materials, as well as quality-dyed and printed fabrics, will push category expansion even further.
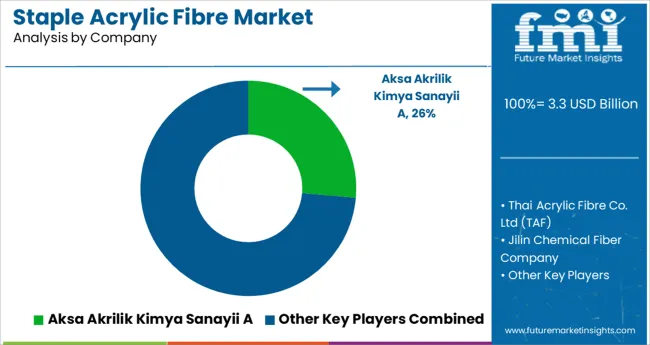
Staple acrylic fibre is an oligopolistic market with a small number of players holding a majority of shares in the market. Key market participants are strategically focusing on the expansion of their production capacities to cater for the remarkable growth in demand for the product over recent years. They are also investing a fair share of their revenue in research and development (Research and Development) and are concentrating on the adoption of new & modified manufacturing techniques to get high-quality products.
For instance:
In recent years, thriving textile and apparel industries worldwide have tempted various companies to enter into the staple acrylic fibre business. As a result, there has been a significant rise in the number of new start-ups, especially across emerging countries like India and China during the last few decades. One such start-up is Cedaar Textile.
Headquartered in Ludhiana India, Ceedar Textile has become a leading textile manufacturing company in India. The company was founded in 1995 and offers a wide range of Melange yarns, polyester, acrylic, viscose, Tencel, and several other products. The company is focused towards offering sustainable products and uses innovative manufacturing technologies to reduce environmental impact and comply with government regulations.
| Attribute | Details |
|---|---|
| Estimated Market Size (2025) | USD 3.3 billion |
| Projected Market Size (2035) | USD 4.7 billion |
| Anticipated Growth Rate (2025 to 2035) | 3.6% CAGR |
| Forecast Period | 2025 to 2035 |
| Historical Data Available for | 2020 to 2024 |
| Market Analysis | million for Value and KT for Volume |
| Key Countries Covered | USA, Canada, Brazil, Mexico, Germany, Italy, France, UK, Spain, BENELUX, Russia, China, Japan, South Korea, India, ASEAN, ANZ, GCC Countries, Turkey, and South Africa |
| Key Segments Covered | Dyeing Method, Blend, End Use, and Region |
| Key Companies Profiled | Aksa Akrilik Kimya Sanayii AS; Thai Acrylic Fibre Co. Ltd (TAF); Jilin Chemical Fiber Co., Ltd.; Taekwang Industry Co. Ltd.; Indian Acrylics Ltd.; CHEMTEX GLOBAL CORPORATION; Vardhman Acrylics Ltd; Pasupati Acrylon Ltd; Japan Exlan Co. Ltd; Kaneka Corporation |
| Report Coverage | Market Forecast, Company Share Analysis, Competition Intelligence, DROT Analysis, Market Dynamics and Challenges, and Strategic Growth Initiatives |
The global staple acrylic fibre market is estimated to be valued at USD 3.3 billion in 2025.
It is projected to reach USD 4.7 billion by 2035.
The market is expected to grow at a 3.6% CAGR between 2025 and 2035.
The key product types are dyed, _acid, _gel and undyed.
acrylic-wool segment is expected to dominate with a 42.9% industry share in 2025.


Our Research Products

The "Full Research Suite" delivers actionable market intel, deep dives on markets or technologies, so clients act faster, cut risk, and unlock growth.

The Leaderboard benchmarks and ranks top vendors, classifying them as Established Leaders, Leading Challengers, or Disruptors & Challengers.

Locates where complements amplify value and substitutes erode it, forecasting net impact by horizon

We deliver granular, decision-grade intel: market sizing, 5-year forecasts, pricing, adoption, usage, revenue, and operational KPIs—plus competitor tracking, regulation, and value chains—across 60 countries broadly.

Spot the shifts before they hit your P&L. We track inflection points, adoption curves, pricing moves, and ecosystem plays to show where demand is heading, why it is changing, and what to do next across high-growth markets and disruptive tech

Real-time reads of user behavior. We track shifting priorities, perceptions of today’s and next-gen services, and provider experience, then pace how fast tech moves from trial to adoption, blending buyer, consumer, and channel inputs with social signals (#WhySwitch, #UX).

Partner with our analyst team to build a custom report designed around your business priorities. From analysing market trends to assessing competitors or crafting bespoke datasets, we tailor insights to your needs.
Supplier Intelligence
Discovery & Profiling
Capacity & Footprint
Performance & Risk
Compliance & Governance
Commercial Readiness
Who Supplies Whom
Scorecards & Shortlists
Playbooks & Docs
Category Intelligence
Definition & Scope
Demand & Use Cases
Cost Drivers
Market Structure
Supply Chain Map
Trade & Policy
Operating Norms
Deliverables
Buyer Intelligence
Account Basics
Spend & Scope
Procurement Model
Vendor Requirements
Terms & Policies
Entry Strategy
Pain Points & Triggers
Outputs
Pricing Analysis
Benchmarks
Trends
Should-Cost
Indexation
Landed Cost
Commercial Terms
Deliverables
Brand Analysis
Positioning & Value Prop
Share & Presence
Customer Evidence
Go-to-Market
Digital & Reputation
Compliance & Trust
KPIs & Gaps
Outputs
Full Research Suite comprises of:
Market outlook & trends analysis
Interviews & case studies
Strategic recommendations
Vendor profiles & capabilities analysis
5-year forecasts
8 regions and 60+ country-level data splits
Market segment data splits
12 months of continuous data updates
DELIVERED AS:
PDF EXCEL ONLINE
Staple Fiber Market Size and Share Forecast Outlook 2025 to 2035
Staples PP Nonwovens Market Size and Share Forecast Outlook 2025 to 2035
Textile Staples Market Size & Trends 2025 to 2035
Powered Surgical Staplers Market Size and Share Forecast Outlook 2025 to 2035
Acrylic Paint Market Forecast and Outlook 2025 to 2035
Acrylic Emulsions Market Size and Share Forecast Outlook 2025 to 2035
Acrylic Polymer Market Size and Share Forecast Outlook 2025 to 2035
Acrylic Resin Market Size and Share Forecast Outlook 2025 to 2035
Acrylic Fine Particle Market Size and Share Forecast Outlook 2025 to 2035
Acrylic Boxes Market Size and Share Forecast Outlook 2025 to 2035
Acrylic Paper Market Size and Share Forecast Outlook 2025 to 2035
Acrylic Pad Market Size and Share Forecast Outlook 2025 to 2035
Acrylic Adhesives Market Growth - Trends & Forecast 2025 to 2035
Acrylic Teeth Market Trends and Assessment for 2025 to 2035
Acrylic Styrene Acrylonitrile (ASA) Resin Market- Growth & Demand 2025 to 2035
Key Companies & Market Share in the Acrylic Airless Bottle Sector
Analyzing Acrylic Boxes Market Share & Industry Leaders
Acrylic Acid Market Growth - Trends & Forecast 2024 to 2034
Acrylic Airless Bottle Market Trends - Demand & Forecast 2024 to 2034
Acrylic Colors Market

Thank you!
You will receive an email from our Business Development Manager. Please be sure to check your SPAM/JUNK folder too.
Chat With
MaRIA