Reports
- Global Locations -
Headquarters
Future Market Insights, Inc.
Christiana Corporate, 200
Continental Drive, Suite 401,
Newark, Delaware - 19713,
United States
Americas
Future Market Insights, Inc.
616 Corporate Way, Suite 2-9018,
Valley Cottage, NY 10989, United States
MEA
Future Market Insights
1602-6 Jumeirah Bay X2 Tower, Plot No: JLT-PH2-X2A,
Jumeirah Lakes Towers, Dubai,
United Arab Emirates
Europe
Future Market Insights
3rd Floor, 207 Regent Street,
W1B 3HH London
United Kingdom
Asia Pacific
Future Market Insights
Office No. 401-A, 4th Floor,
VANTAGE 9, S.No. 36/1/1,
Baner, Pune 411045, India
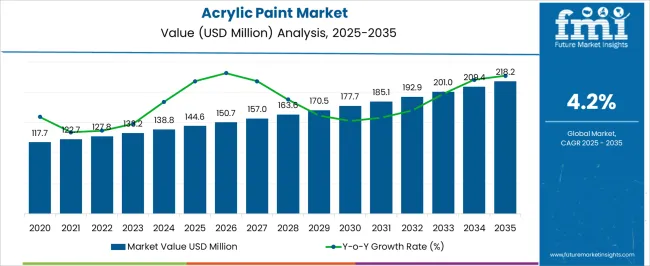
The acrylic paints market is growing at an average pace and is anticipated to record a CAGR of 4.5 % from 2022 to 2032.
One of the primary differentiating competitive tactics is the development of high-performance acrylic paint bonding for manufacturers to emerge as winners in the market.
Advances in technology-driven end-use applications of acrylic paints are significant factors driving market expansion. The expansion of infrastructure also plays a pivotal role in fuelling the growth of the acrylic paints market as factors such as water resistance and superior finish boost its popularity.
Attributes | Details |
---|---|
Acrylic Paints Market Value in 2020 | US $ 117.7 Million |
Acrylic Paints Market CAGR (2022 to 2032) | 4.5 % |
Don't pay for what you don't need
Customize your report by selecting specific countries or regions and save 30%!
The high reliance of artists on acrylic paints to get consistency and finishes in their portraits is one of the major revenue channels for the market.
Stemming from the popularity of water-based acrylic binders in house paints and artisanal professionals, the global acrylic paint market will continue to make material progress over the decade ahead. Known for their durability, flexibility, and affordability, the acrylic paints market has established itself as a sizeable market over the years.
Tech-driven advancements in acrylic paints are key factors fuelling the market growth. An increasing number of compatible media is expanding the application scope of acrylic paints.
Significant players are leveraging market intelligence such as consumer trends and region-wise analysis to devise research and development efforts.
The rise in infrastructure development is a major factor of growth for the acrylic paints market. Factors such as water resistance, superior finish, and consistent drying time are propelling their adoption in construction projects.
Consumer demand for high-performance exterior paint sun-reflective and water-resistant - and improved finish quality is making acrylic paints the preferred choice for exterior surfaces.
Acrylic paints do not deteriorate under excessive sunlight and offer enhanced adhesion and thermoplastic properties. Hence, real estate companies are selecting acrylic paints to differentiate themselves in the competitive real estate market. As a result, construction contractors will continue to buy more acrylic paint products thereby expanding the acrylic paints market.
Acrylic paint set out to be a medium for elementary use has gained a wide range of applications & preferences in recent times with diversified products.
Acrylic paint has been treated as a type of medium that is suitable for kindergarten classrooms only over the past few decades. However, with the advancement of pigmentation, consistency, and finishes, many artists - David Hockey, Helen Frankenthaler, Mark Rothko - are preferring acrylic paints as an ideal choice for acrylic art.
This changing preference has boosted the prominence of acrylic paints among artists over the years. In addition, the excellent properties of acrylic paint are broadening their adoption among artists, globally.
Acrylic paints are low-maintenance mediums that do not require custom supplies such as conventional oil paints. They offer the benefits of enhanced consistency and texture. The versatile nature of acrylic paints is making them an ideal medium that allows artists to do acrylic painting on canvas.
Artists are the key consumers of acrylic paints. Companies focused on stationery products are increasing their investments in acrylic paint, further creating lucrative prospects for manufacturers. Hence, the increasing adoption of acrylic paint as a professional medium of painting will continue to drive market growth in the coming years.
North America has been the most remunerative region for market players, owing to the surging adoption of acrylic paints in construction activities. However, with the saturation of opportunities in infrastructure development projects, the North American acrylic paints market is poised to attain a mature market in the near term. As such, market players are turning to untapped regions such as Latin America and Asia Pacific (APAC) for revenue generation.
Increasing foreign direct investments (FDI) and the proliferation of technology in countries such as Mexico, India, Colombia, and Indonesia are creating remunerative opportunities for acrylic paint manufacturers.
Supportive government investments and tax policies further the growth of infrastructure development, which in turn is resulting in demand for acrylic paint and boosting the acrylic paints market.
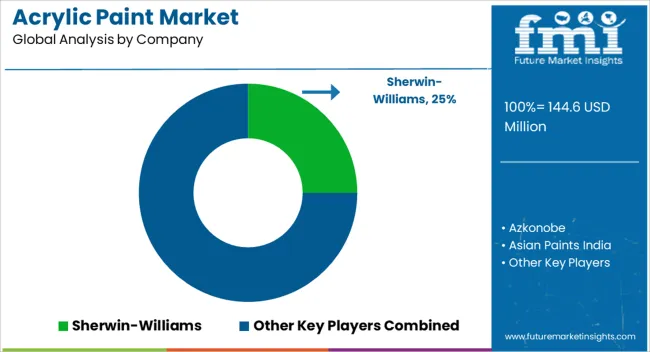
Key players in the acrylic paints market are AkzoNobel, Asian Paints India, BASF SE, Berger Paints India, and Berkshire Hathaway among others.
Manufacturers are focusing on enhancing their product portfolios for manufacturing the best acrylic paint and complementing features such as colors, finish, adhesion, consistency, resistance to water, and sunlight.
Major players are leveraging industrial automation to expand their production capacity and global footprint.
As residential infrastructure is a high-growth area in developing countries, market players are capitalizing on research efforts toward evolving consumer trends in color preference and desired finishes.
Get the data you need at a Fraction of the cost
Personalize your report by choosing insights you need
and save 40%!
Attributes | Details |
---|---|
Forecast Period | 2022 to 2032 |
Historical Data Available For | 2015 to 2020 |
Market Analysis | US$ Million for Value |
By Type |
|
By Application |
|
By End Use |
|
By Region |
|
Key Players |
|
1. Executive Summary | Acrylic Paints Market 1.1. Global Market Outlook 1.2. Demand-side Trends 1.3. Supply-side Trends 1.4. Technology Roadmap Analysis 1.5. Analysis and Recommendations 2. Market Overview 2.1. Market Coverage / Taxonomy 2.2. Market Definition / Scope / Limitations 3. Market Background 3.1. Market Dynamics 3.1.1. Drivers 3.1.2. Restraints 3.1.3. Opportunity 3.1.4. Trends 3.2. Scenario Forecast 3.2.1. Demand in Optimistic Scenario 3.2.2. Demand in Likely Scenario 3.2.3. Demand in Conservative Scenario 3.3. Opportunity Map Analysis 3.4. Product Life Cycle Analysis 3.5. Supply Chain Analysis 3.5.1. Supply Side Participants and their Roles 3.5.1.1. Producers 3.5.1.2. Mid-Level Participants (Traders/ Agents/ Brokers) 3.5.1.3. Wholesalers and Distributors 3.5.2. Value Added and Value Created at Node in the Supply Chain 3.5.3. List of Raw Material Suppliers 3.5.4. List of Existing and Potential Buyers 3.6. Investment Feasibility Matrix 3.7. Value Chain Analysis 3.7.1. Profit Margin Analysis 3.7.2. Wholesalers and Distributors 3.7.3. Retailers 3.8. PESTLE and Porter’s Analysis 3.9. Regulatory Landscape 3.9.1. By Key Regions 3.9.2. By Key Countries 3.10. Regional Parent Market Outlook 3.11. Production and Consumption Statistics 3.12. Import and Export Statistics 4. Global Market Analysis 2017 to 2021 and Forecast, 2022 to 2032 4.1. Historical Market Size Value (US$ Million) & Volume (Liters) Analysis, 2017 to 2021 4.2. Current and Future Market Size Value (US$ Million) & Volume (Liters) Projections, 2022 to 2032 4.2.1. Y-o-Y Growth Trend Analysis 4.2.2. Absolute $ Opportunity Analysis 5. Global Market Analysis 2017 to 2021 and Forecast 2022 to 2032, By Viscosity 5.1. Introduction / Key Findings 5.2. Historical Market Size Value (US$ Million) & Volume (Liters) Analysis By Viscosity, 2017 to 2021 5.3. Current and Future Market Size Value (US$ Million) & Volume (Liters) Analysis and Forecast By Viscosity, 2022 to 2032 5.3.1. Heavy Body Acrylic 5.3.2. Soft Body (Fluid) Acrylic 5.4. Y-o-Y Growth Trend Analysis By Viscosity, 2017 to 2021 5.5. Absolute $ Opportunity Analysis By Viscosity, 2022 to 2032 6. Global Market Analysis 2017 to 2021 and Forecast 2022 to 2032, By Grade 6.1. Introduction / Key Findings 6.2. Historical Market Size Value (US$ Million) & Volume (Liters) Analysis By Grade, 2017 to 2021 6.3. Current and Future Market Size Value (US$ Million) & Volume (Liters) Analysis and Forecast By Grade, 2022 to 2032 6.3.1. Artist/ Professional Acrylic 6.3.2. Beginners Acrylic 6.4. Y-o-Y Growth Trend Analysis By Grade, 2017 to 2021 6.5. Absolute $ Opportunity Analysis By Grade, 2022 to 2032 7. Global Market Analysis 2017 to 2021 and Forecast 2022 to 2032, By Property 7.1. Introduction / Key Findings 7.2. Historical Market Size Value (US$ Million) & Volume (Liters) Analysis By Property, 2017 to 2021 7.3. Current and Future Market Size Value (US$ Million) & Volume (Liters) Analysis and Forecast By Property, 2022 to 2032 7.3.1. Gouache(for Opaque surfaces) 7.3.2. Transparent 7.3.3. Translucent 7.4. Y-o-Y Growth Trend Analysis By Property, 2017 to 2021 7.5. Absolute $ Opportunity Analysis By Property, 2022 to 2032 8. Global Market Analysis 2017 to 2021 and Forecast 2022 to 2032, By Surface Type 8.1. Introduction / Key Findings 8.2. Historical Market Size Value (US$ Million) & Volume (Liters) Analysis By Surface Type, 2017 to 2021 8.3. Current and Future Market Size Value (US$ Million) & Volume (Liters) Analysis and Forecast By Surface Type, 2022 to 2032 8.3.1. Canvas 8.3.2. Craft 8.4. Y-o-Y Growth Trend Analysis By Surface Type, 2017 to 2021 8.5. Absolute $ Opportunity Analysis By Surface Type, 2022 to 2032 9. Global Market Analysis 2017 to 2021 and Forecast 2022 to 2032, By Drying Ability 9.1. Introduction / Key Findings 9.2. Historical Market Size Value (US$ Million) & Volume (Liters) Analysis By Drying Ability, 2017 to 2021 9.3. Current and Future Market Size Value (US$ Million) & Volume (Liters) Analysis and Forecast By Drying Ability, 2022 to 2032 9.3.1. Open / Interactive 9.3.2. Fast Dry 9.4. Y-o-Y Growth Trend Analysis By Drying Ability, 2017 to 2021 9.5. Absolute $ Opportunity Analysis By Drying Ability, 2022 to 2032 10. Global Market Analysis 2017 to 2021 and Forecast 2022 to 2032, By Region 10.1. Introduction 10.2. Historical Market Size Value (US$ Million) & Volume (Liters) Analysis By Region, 2017 to 2021 10.3. Current Market Size Value (US$ Million) & Volume (Liters) Analysis and Forecast By Region, 2022 to 2032 10.3.1. North America 10.3.2. Latin America 10.3.3. Europe 10.3.4. Asia Pacific 10.3.5. Middle East and Africa 10.4. Market Attractiveness Analysis By Region 11. North America Market Analysis 2017 to 2021 and Forecast 2022 to 2032, By Country 11.1. Historical Market Size Value (US$ Million) & Volume (Liters) Trend Analysis By Market Taxonomy, 2017 to 2021 11.2. Market Size Value (US$ Million) & Volume (Liters) Forecast By Market Taxonomy, 2022 to 2032 11.2.1. By Country 11.2.1.1. USA 11.2.1.2. Canada 11.2.2. By Viscosity 11.2.3. By Grade 11.2.4. By Property 11.2.5. By Surface Type 11.2.6. By Drying Ability 11.3. Market Attractiveness Analysis 11.3.1. By Country 11.3.2. By Viscosity 11.3.3. By Grade 11.3.4. By Property 11.3.5. By Surface Type 11.3.6. By Drying Ability 11.4. Key Takeaways 12. Latin America Market Analysis 2017 to 2021 and Forecast 2022 to 2032, By Country 12.1. Historical Market Size Value (US$ Million) & Volume (Liters) Trend Analysis By Market Taxonomy, 2017 to 2021 12.2. Market Size Value (US$ Million) & Volume (Liters) Forecast By Market Taxonomy, 2022 to 2032 12.2.1. By Country 12.2.1.1. Brazil 12.2.1.2. Mexico 12.2.1.3. Rest of Latin America 12.2.2. By Viscosity 12.2.3. By Grade 12.2.4. By Property 12.2.5. By Surface Type 12.2.6. By Drying Ability 12.3. Market Attractiveness Analysis 12.3.1. By Country 12.3.2. By Viscosity 12.3.3. By Grade 12.3.4. By Property 12.3.5. By Surface Type 12.3.6. By Drying Ability 12.4. Key Takeaways 13. Europe Market Analysis 2017 to 2021 and Forecast 2022 to 2032, By Country 13.1. Historical Market Size Value (US$ Million) & Volume (Liters) Trend Analysis By Market Taxonomy, 2017 to 2021 13.2. Market Size Value (US$ Million) & Volume (Liters) Forecast By Market Taxonomy, 2022 to 2032 13.2.1. By Country 13.2.1.1. Germany 13.2.1.2. United Kingdom 13.2.1.3. France 13.2.1.4. Spain 13.2.1.5. Italy 13.2.1.6. Rest of Europe 13.2.2. By Viscosity 13.2.3. By Grade 13.2.4. By Property 13.2.5. By Surface Type 13.2.6. By Drying Ability 13.3. Market Attractiveness Analysis 13.3.1. By Country 13.3.2. By Viscosity 13.3.3. By Grade 13.3.4. By Property 13.3.5. By Surface Type 13.3.6. By Drying Ability 13.4. Key Takeaways 14. Asia Pacific Market Analysis 2017 to 2021 and Forecast 2022 to 2032, By Country 14.1. Historical Market Size Value (US$ Million) & Volume (Liters) Trend Analysis By Market Taxonomy, 2017 to 2021 14.2. Market Size Value (US$ Million) & Volume (Liters) Forecast By Market Taxonomy, 2022 to 2032 14.2.1. By Country 14.2.1.1. China 14.2.1.2. Japan 14.2.1.3. South Korea 14.2.1.4. Malaysia 14.2.1.5. Singapore 14.2.1.6. Australia 14.2.1.7. New Zealand 14.2.1.8. Rest of Asia Pacific 14.2.2. By Viscosity 14.2.3. By Grade 14.2.4. By Property 14.2.5. By Surface Type 14.2.6. By Drying Ability 14.3. Market Attractiveness Analysis 14.3.1. By Country 14.3.2. By Viscosity 14.3.3. By Grade 14.3.4. By Property 14.3.5. By Surface Type 14.3.6. By Drying Ability 14.4. Key Takeaways 15. Middle East and Africa Market Analysis 2017 to 2021 and Forecast 2022 to 2032, By Country 15.1. Historical Market Size Value (US$ Million) & Volume (Liters) Trend Analysis By Market Taxonomy, 2017 to 2021 15.2. Market Size Value (US$ Million) & Volume (Liters) Forecast By Market Taxonomy, 2022 to 2032 15.2.1. By Country 15.2.1.1. GCC Countries 15.2.1.2. South Africa 15.2.1.3. Israel 15.2.1.4. Rest of Middle East and Africa 15.2.2. By Viscosity 15.2.3. By Grade 15.2.4. By Property 15.2.5. By Surface Type 15.2.6. By Drying Ability 15.3. Market Attractiveness Analysis 15.3.1. By Country 15.3.2. By Viscosity 15.3.3. By Grade 15.3.4. By Property 15.3.5. By Surface Type 15.3.6. By Drying Ability 15.4. Key Takeaways 16. Key Countries Market Analysis 16.1. USA 16.1.1. Pricing Analysis 16.1.2. Market Share Analysis, 2021 16.1.2.1. By Viscosity 16.1.2.2. By Grade 16.1.2.3. By Property 16.1.2.4. By Surface Type 16.1.2.5. By Drying Ability 16.2. Canada 16.2.1. Pricing Analysis 16.2.2. Market Share Analysis, 2021 16.2.2.1. By Viscosity 16.2.2.2. By Grade 16.2.2.3. By Property 16.2.2.4. By Surface Type 16.2.2.5. By Drying Ability 16.3. Brazil 16.3.1. Pricing Analysis 16.3.2. Market Share Analysis, 2021 16.3.2.1. By Viscosity 16.3.2.2. By Grade 16.3.2.3. By Property 16.3.2.4. By Surface Type 16.3.2.5. By Drying Ability 16.4. Mexico 16.4.1. Pricing Analysis 16.4.2. Market Share Analysis, 2021 16.4.2.1. By Viscosity 16.4.2.2. By Grade 16.4.2.3. By Property 16.4.2.4. By Surface Type 16.4.2.5. By Drying Ability 16.5. Germany 16.5.1. Pricing Analysis 16.5.2. Market Share Analysis, 2021 16.5.2.1. By Viscosity 16.5.2.2. By Grade 16.5.2.3. By Property 16.5.2.4. By Surface Type 16.5.2.5. By Drying Ability 16.6. United Kingdom 16.6.1. Pricing Analysis 16.6.2. Market Share Analysis, 2021 16.6.2.1. By Viscosity 16.6.2.2. By Grade 16.6.2.3. By Property 16.6.2.4. By Surface Type 16.6.2.5. By Drying Ability 16.7. France 16.7.1. Pricing Analysis 16.7.2. Market Share Analysis, 2021 16.7.2.1. By Viscosity 16.7.2.2. By Grade 16.7.2.3. By Property 16.7.2.4. By Surface Type 16.7.2.5. By Drying Ability 16.8. Spain 16.8.1. Pricing Analysis 16.8.2. Market Share Analysis, 2021 16.8.2.1. By Viscosity 16.8.2.2. By Grade 16.8.2.3. By Property 16.8.2.4. By Surface Type 16.8.2.5. By Drying Ability 16.9. Italy 16.9.1. Pricing Analysis 16.9.2. Market Share Analysis, 2021 16.9.2.1. By Viscosity 16.9.2.2. By Grade 16.9.2.3. By Property 16.9.2.4. By Surface Type 16.9.2.5. By Drying Ability 16.10. China 16.10.1. Pricing Analysis 16.10.2. Market Share Analysis, 2021 16.10.2.1. By Viscosity 16.10.2.2. By Grade 16.10.2.3. By Property 16.10.2.4. By Surface Type 16.10.2.5. By Drying Ability 16.11. Japan 16.11.1. Pricing Analysis 16.11.2. Market Share Analysis, 2021 16.11.2.1. By Viscosity 16.11.2.2. By Grade 16.11.2.3. By Property 16.11.2.4. By Surface Type 16.11.2.5. By Drying Ability 16.12. South Korea 16.12.1. Pricing Analysis 16.12.2. Market Share Analysis, 2021 16.12.2.1. By Viscosity 16.12.2.2. By Grade 16.12.2.3. By Property 16.12.2.4. By Surface Type 16.12.2.5. By Drying Ability 16.13. Malaysia 16.13.1. Pricing Analysis 16.13.2. Market Share Analysis, 2021 16.13.2.1. By Viscosity 16.13.2.2. By Grade 16.13.2.3. By Property 16.13.2.4. By Surface Type 16.13.2.5. By Drying Ability 16.14. Singapore 16.14.1. Pricing Analysis 16.14.2. Market Share Analysis, 2021 16.14.2.1. By Viscosity 16.14.2.2. By Grade 16.14.2.3. By Property 16.14.2.4. By Surface Type 16.14.2.5. By Drying Ability 16.15. Australia 16.15.1. Pricing Analysis 16.15.2. Market Share Analysis, 2021 16.15.2.1. By Viscosity 16.15.2.2. By Grade 16.15.2.3. By Property 16.15.2.4. By Surface Type 16.15.2.5. By Drying Ability 16.16. New Zealand 16.16.1. Pricing Analysis 16.16.2. Market Share Analysis, 2021 16.16.2.1. By Viscosity 16.16.2.2. By Grade 16.16.2.3. By Property 16.16.2.4. By Surface Type 16.16.2.5. By Drying Ability 16.17. GCC Countries 16.17.1. Pricing Analysis 16.17.2. Market Share Analysis, 2021 16.17.2.1. By Viscosity 16.17.2.2. By Grade 16.17.2.3. By Property 16.17.2.4. By Surface Type 16.17.2.5. By Drying Ability 16.18. South Africa 16.18.1. Pricing Analysis 16.18.2. Market Share Analysis, 2021 16.18.2.1. By Viscosity 16.18.2.2. By Grade 16.18.2.3. By Property 16.18.2.4. By Surface Type 16.18.2.5. By Drying Ability 16.19. Israel 16.19.1. Pricing Analysis 16.19.2. Market Share Analysis, 2021 16.19.2.1. By Viscosity 16.19.2.2. By Grade 16.19.2.3. By Property 16.19.2.4. By Surface Type 16.19.2.5. By Drying Ability 17. Market Structure Analysis 17.1. Competition Dashboard 17.2. Competition Benchmarking 17.3. Market Share Analysis of Top Players 17.3.1. By Regional 17.3.2. By Viscosity 17.3.3. By Grade 17.3.4. By Property 17.3.5. By Surface Type 17.3.6. By Drying Ability 18. Competition Analysis 18.1. Competition Deep Dive 18.1.1. Golden Artist Color Inc. 18.1.1.1. Overview 18.1.1.2. Product Portfolio 18.1.1.3. Profitability by Market Segments 18.1.1.4. Sales Footprint 18.1.1.5. Strategy Overview 18.1.1.5.1. Marketing Strategy 18.1.1.5.2. Product Strategy 18.1.1.5.3. Channel Strategy 18.1.2. Winsor & Newton 18.1.2.1. Overview 18.1.2.2. Product Portfolio 18.1.2.3. Profitability by Market Segments 18.1.2.4. Sales Footprint 18.1.2.5. Strategy Overview 18.1.2.5.1. Marketing Strategy 18.1.2.5.2. Product Strategy 18.1.2.5.3. Channel Strategy 18.1.3. Liquitex Artist Materials 18.1.3.1. Overview 18.1.3.2. Product Portfolio 18.1.3.3. Profitability by Market Segments 18.1.3.4. Sales Footprint 18.1.3.5. Strategy Overview 18.1.3.5.1. Marketing Strategy 18.1.3.5.2. Product Strategy 18.1.3.5.3. Channel Strategy 18.1.4. M.Graham 18.1.4.1. Overview 18.1.4.2. Product Portfolio 18.1.4.3. Profitability by Market Segments 18.1.4.4. Sales Footprint 18.1.4.5. Strategy Overview 18.1.4.5.1. Marketing Strategy 18.1.4.5.2. Product Strategy 18.1.4.5.3. Channel Strategy 18.1.5. Chroma Australia Pty. Ltd. 18.1.5.1. Overview 18.1.5.2. Product Portfolio 18.1.5.3. Profitability by Market Segments 18.1.5.4. Sales Footprint 18.1.5.5. Strategy Overview 18.1.5.5.1. Marketing Strategy 18.1.5.5.2. Product Strategy 18.1.5.5.3. Channel Strategy 18.1.6. Derivan pty ltd 18.1.6.1. Overview 18.1.6.2. Product Portfolio 18.1.6.3. Profitability by Market Segments 18.1.6.4. Sales Footprint 18.1.6.5. Strategy Overview 18.1.6.5.1. Marketing Strategy 18.1.6.5.2. Product Strategy 18.1.6.5.3. Channel Strategy 18.1.7. Daler-Rowney 18.1.7.1. Overview 18.1.7.2. Product Portfolio 18.1.7.3. Profitability by Market Segments 18.1.7.4. Sales Footprint 18.1.7.5. Strategy Overview 18.1.7.5.1. Marketing Strategy 18.1.7.5.2. Product Strategy 18.1.7.5.3. Channel Strategy 18.1.8. Utrecht Art Supplies 18.1.8.1. Overview 18.1.8.2. Product Portfolio 18.1.8.3. Profitability by Market Segments 18.1.8.4. Sales Footprint 18.1.8.5. Strategy Overview 18.1.8.5.1. Marketing Strategy 18.1.8.5.2. Product Strategy 18.1.8.5.3. Channel Strategy 18.1.9. Tri-Art 18.1.9.1. Overview 18.1.9.2. Product Portfolio 18.1.9.3. Profitability by Market Segments 18.1.9.4. Sales Footprint 18.1.9.5. Strategy Overview 18.1.9.5.1. Marketing Strategy 18.1.9.5.2. Product Strategy 18.1.9.5.3. Channel Strategy 18.1.10. Createx Colors 18.1.10.1. Overview 18.1.10.2. Product Portfolio 18.1.10.3. Profitability by Market Segments 18.1.10.4. Sales Footprint 18.1.10.5. Strategy Overview 18.1.10.5.1. Marketing Strategy 18.1.10.5.2. Product Strategy 18.1.10.5.3. Channel Strategy 18.1.11. Sennelier 18.1.11.1. Overview 18.1.11.2. Product Portfolio 18.1.11.3. Profitability by Market Segments 18.1.11.4. Sales Footprint 18.1.11.5. Strategy Overview 18.1.11.5.1. Marketing Strategy 18.1.11.5.2. Product Strategy 18.1.11.5.3. Channel Strategy 18.1.12. Specialty Polymers, Inc. 18.1.12.1. Overview 18.1.12.2. Product Portfolio 18.1.12.3. Profitability by Market Segments 18.1.12.4. Sales Footprint 18.1.12.5. Strategy Overview 18.1.12.5.1. Marketing Strategy 18.1.12.5.2. Product Strategy 18.1.12.5.3. Channel Strategy 18.1.13. Kansai Paint 18.1.13.1. Overview 18.1.13.2. Product Portfolio 18.1.13.3. Profitability by Market Segments 18.1.13.4. Sales Footprint 18.1.13.5. Strategy Overview 18.1.13.5.1. Marketing Strategy 18.1.13.5.2. Product Strategy 18.1.13.5.3. Channel Strategy 18.1.14. Nippon Paint 18.1.14.1. Overview 18.1.14.2. Product Portfolio 18.1.14.3. Profitability by Market Segments 18.1.14.4. Sales Footprint 18.1.14.5. Strategy Overview 18.1.14.5.1. Marketing Strategy 18.1.14.5.2. Product Strategy 18.1.14.5.3. Channel Strategy 18.1.15. Peter Kwasny GmbH. 18.1.15.1. Overview 18.1.15.2. Product Portfolio 18.1.15.3. Profitability by Market Segments 18.1.15.4. Sales Footprint 18.1.15.5. Strategy Overview 18.1.15.5.1. Marketing Strategy 18.1.15.5.2. Product Strategy 18.1.15.5.3. Channel Strategy 18.1.16. Chroma Australia Pty Ltd 18.1.16.1. Overview 18.1.16.2. Product Portfolio 18.1.16.3. Profitability by Market Segments 18.1.16.4. Sales Footprint 18.1.16.5. Strategy Overview 18.1.16.5.1. Marketing Strategy 18.1.16.5.2. Product Strategy 18.1.16.5.3. Channel Strategy 18.1.17. Gellner Industrial LLC 18.1.17.1. Overview 18.1.17.2. Product Portfolio 18.1.17.3. Profitability by Market Segments 18.1.17.4. Sales Footprint 18.1.17.5. Strategy Overview 18.1.17.5.1. Marketing Strategy 18.1.17.5.2. Product Strategy 18.1.17.5.3. Channel Strategy 19. Assumptions & Acronyms Used 20. Research Methodology
Don't pay for what you don't need
Customize your report by selecting specific countries or regions and save 30%!
Table 01: Global Market Value (US$ Million) Forecast by Region, 2017 to 2032 Table 02: Global Market Volume (Liters) Forecast by Region, 2017 to 2032 Table 03: Global Market Value (US$ Million) Forecast by Viscosity, 2017 to 2032 Table 04: Global Market Volume (Liters) Forecast by Viscosity, 2017 to 2032 Table 05: Global Market Value (US$ Million) Forecast by Grade, 2017 to 2032 Table 06: Global Market Volume (Liters) Forecast by Grade, 2017 to 2032 Table 07: Global Market Value (US$ Million) Forecast by Property, 2017 to 2032 Table 08: Global Market Volume (Liters) Forecast by Property, 2017 to 2032 Table 09: Global Market Value (US$ Million) Forecast by Surface Type, 2017 to 2032 Table 10: Global Market Volume (Liters) Forecast by Surface Type, 2017 to 2032 Table 11: Global Market Value (US$ Million) Forecast by Drying Ability, 2017 to 2032 Table 12: Global Market Volume (Liters) Forecast by Drying Ability, 2017 to 2032 Table 13: North America Market Value (US$ Million) Forecast by Country, 2017 to 2032 Table 14: North America Market Volume (Liters) Forecast by Country, 2017 to 2032 Table 15: North America Market Value (US$ Million) Forecast by Viscosity, 2017 to 2032 Table 16: North America Market Volume (Liters) Forecast by Viscosity, 2017 to 2032 Table 17: North America Market Value (US$ Million) Forecast by Grade, 2017 to 2032 Table 18: North America Market Volume (Liters) Forecast by Grade, 2017 to 2032 Table 19: North America Market Value (US$ Million) Forecast by Property, 2017 to 2032 Table 20: North America Market Volume (Liters) Forecast by Property, 2017 to 2032 Table 21: North America Market Value (US$ Million) Forecast by Surface Type, 2017 to 2032 Table 22: North America Market Volume (Liters) Forecast by Surface Type, 2017 to 2032 Table 23: North America Market Value (US$ Million) Forecast by Drying Ability, 2017 to 2032 Table 24: North America Market Volume (Liters) Forecast by Drying Ability, 2017 to 2032 Table 25: Latin America Market Value (US$ Million) Forecast by Country, 2017 to 2032 Table 26: Latin America Market Volume (Liters) Forecast by Country, 2017 to 2032 Table 27: Latin America Market Value (US$ Million) Forecast by Viscosity, 2017 to 2032 Table 28: Latin America Market Volume (Liters) Forecast by Viscosity, 2017 to 2032 Table 29: Latin America Market Value (US$ Million) Forecast by Grade, 2017 to 2032 Table 30: Latin America Market Volume (Liters) Forecast by Grade, 2017 to 2032 Table 31: Latin America Market Value (US$ Million) Forecast by Property, 2017 to 2032 Table 32: Latin America Market Volume (Liters) Forecast by Property, 2017 to 2032 Table 33: Latin America Market Value (US$ Million) Forecast by Surface Type, 2017 to 2032 Table 34: Latin America Market Volume (Liters) Forecast by Surface Type, 2017 to 2032 Table 35: Latin America Market Value (US$ Million) Forecast by Drying Ability, 2017 to 2032 Table 36: Latin America Market Volume (Liters) Forecast by Drying Ability, 2017 to 2032 Table 37: Europe Market Value (US$ Million) Forecast by Country, 2017 to 2032 Table 38: Europe Market Volume (Liters) Forecast by Country, 2017 to 2032 Table 39: Europe Market Value (US$ Million) Forecast by Viscosity, 2017 to 2032 Table 40: Europe Market Volume (Liters) Forecast by Viscosity, 2017 to 2032 Table 41: Europe Market Value (US$ Million) Forecast by Grade, 2017 to 2032 Table 42: Europe Market Volume (Liters) Forecast by Grade, 2017 to 2032 Table 43: Europe Market Value (US$ Million) Forecast by Property, 2017 to 2032 Table 44: Europe Market Volume (Liters) Forecast by Property, 2017 to 2032 Table 45: Europe Market Value (US$ Million) Forecast by Surface Type, 2017 to 2032 Table 46: Europe Market Volume (Liters) Forecast by Surface Type, 2017 to 2032 Table 47: Europe Market Value (US$ Million) Forecast by Drying Ability, 2017 to 2032 Table 48: Europe Market Volume (Liters) Forecast by Drying Ability, 2017 to 2032 Table 49: Asia Pacific Market Value (US$ Million) Forecast by Country, 2017 to 2032 Table 50: Asia Pacific Market Volume (Liters) Forecast by Country, 2017 to 2032 Table 51: Asia Pacific Market Value (US$ Million) Forecast by Viscosity, 2017 to 2032 Table 52: Asia Pacific Market Volume (Liters) Forecast by Viscosity, 2017 to 2032 Table 53: Asia Pacific Market Value (US$ Million) Forecast by Grade, 2017 to 2032 Table 54: Asia Pacific Market Volume (Liters) Forecast by Grade, 2017 to 2032 Table 55: Asia Pacific Market Value (US$ Million) Forecast by Property, 2017 to 2032 Table 56: Asia Pacific Market Volume (Liters) Forecast by Property, 2017 to 2032 Table 57: Asia Pacific Market Value (US$ Million) Forecast by Surface Type, 2017 to 2032 Table 58: Asia Pacific Market Volume (Liters) Forecast by Surface Type, 2017 to 2032 Table 59: Asia Pacific Market Value (US$ Million) Forecast by Drying Ability, 2017 to 2032 Table 60: Asia Pacific Market Volume (Liters) Forecast by Drying Ability, 2017 to 2032 Table 61: MEA Market Value (US$ Million) Forecast by Country, 2017 to 2032 Table 62: MEA Market Volume (Liters) Forecast by Country, 2017 to 2032 Table 63: MEA Market Value (US$ Million) Forecast by Viscosity, 2017 to 2032 Table 64: MEA Market Volume (Liters) Forecast by Viscosity, 2017 to 2032 Table 65: MEA Market Value (US$ Million) Forecast by Grade, 2017 to 2032 Table 66: MEA Market Volume (Liters) Forecast by Grade, 2017 to 2032 Table 67: MEA Market Value (US$ Million) Forecast by Property, 2017 to 2032 Table 68: MEA Market Volume (Liters) Forecast by Property, 2017 to 2032 Table 69: MEA Market Value (US$ Million) Forecast by Surface Type, 2017 to 2032 Table 70: MEA Market Volume (Liters) Forecast by Surface Type, 2017 to 2032 Table 71: MEA Market Value (US$ Million) Forecast by Drying Ability, 2017 to 2032 Table 72: MEA Market Volume (Liters) Forecast by Drying Ability, 2017 to 2032
Figure 01: Global Market Value (US$ Million) by Viscosity, 2022 to 2032 Figure 02: Global Market Value (US$ Million) by Grade, 2022 to 2032 Figure 03: Global Market Value (US$ Million) by Property, 2022 to 2032 Figure 04: Global Market Value (US$ Million) by Surface Type, 2022 to 2032 Figure 05: Global Market Value (US$ Million) by Drying Ability, 2022 to 2032 Figure 06: Global Market Value (US$ Million) by Region, 2022 to 2032 Figure 07: Global Market Value (US$ Million) Analysis by Region, 2017 to 2032 Figure 08: Global Market Volume (Liters) Analysis by Region, 2017 to 2032 Figure 09: Global Market Value Share (%) and BPS Analysis by Region, 2022 to 2032 Figure 10: Global Market Y-o-Y Growth (%) Projections by Region, 2022 to 2032 Figure 11: Global Market Value (US$ Million) Analysis by Viscosity, 2017 to 2032 Figure 12: Global Market Volume (Liters) Analysis by Viscosity, 2017 to 2032 Figure 13: Global Market Value Share (%) and BPS Analysis by Viscosity, 2022 to 2032 Figure 14: Global Market Y-o-Y Growth (%) Projections by Viscosity, 2022 to 2032 Figure 15: Global Market Value (US$ Million) Analysis by Grade, 2017 to 2032 Figure 16: Global Market Volume (Liters) Analysis by Grade, 2017 to 2032 Figure 17: Global Market Value Share (%) and BPS Analysis by Grade, 2022 to 2032 Figure 18: Global Market Y-o-Y Growth (%) Projections by Grade, 2022 to 2032 Figure 19: Global Market Value (US$ Million) Analysis by Property, 2017 to 2032 Figure 20: Global Market Volume (Liters) Analysis by Property, 2017 to 2032 Figure 21: Global Market Value Share (%) and BPS Analysis by Property, 2022 to 2032 Figure 22: Global Market Y-o-Y Growth (%) Projections by Property, 2022 to 2032 Figure 23: Global Market Value (US$ Million) Analysis by Surface Type, 2017 to 2032 Figure 24: Global Market Volume (Liters) Analysis by Surface Type, 2017 to 2032 Figure 25: Global Market Value Share (%) and BPS Analysis by Surface Type, 2022 to 2032 Figure 26: Global Market Y-o-Y Growth (%) Projections by Surface Type, 2022 to 2032 Figure 27: Global Market Value (US$ Million) Analysis by Drying Ability, 2017 to 2032 Figure 28: Global Market Volume (Liters) Analysis by Drying Ability, 2017 to 2032 Figure 29: Global Market Value Share (%) and BPS Analysis by Drying Ability, 2022 to 2032 Figure 30: Global Market Y-o-Y Growth (%) Projections by Drying Ability, 2022 to 2032 Figure 31: Global Market Attractiveness by Viscosity, 2022 to 2032 Figure 32: Global Market Attractiveness by Grade, 2022 to 2032 Figure 33: Global Market Attractiveness by Property, 2022 to 2032 Figure 34: Global Market Attractiveness by Surface Type, 2022 to 2032 Figure 35: Global Market Attractiveness by Drying Ability, 2022 to 2032 Figure 36: Global Market Attractiveness by Region, 2022 to 2032 Figure 37: North America Market Value (US$ Million) by Viscosity, 2022 to 2032 Figure 38: North America Market Value (US$ Million) by Grade, 2022 to 2032 Figure 39: North America Market Value (US$ Million) by Property, 2022 to 2032 Figure 40: North America Market Value (US$ Million) by Surface Type, 2022 to 2032 Figure 41: North America Market Value (US$ Million) by Drying Ability, 2022 to 2032 Figure 42: North America Market Value (US$ Million) by Country, 2022 to 2032 Figure 43: North America Market Value (US$ Million) Analysis by Country, 2017 to 2032 Figure 44: North America Market Volume (Liters) Analysis by Country, 2017 to 2032 Figure 45: North America Market Value Share (%) and BPS Analysis by Country, 2022 to 2032 Figure 46: North America Market Y-o-Y Growth (%) Projections by Country, 2022 to 2032 Figure 47: North America Market Value (US$ Million) Analysis by Viscosity, 2017 to 2032 Figure 48: North America Market Volume (Liters) Analysis by Viscosity, 2017 to 2032 Figure 49: North America Market Value Share (%) and BPS Analysis by Viscosity, 2022 to 2032 Figure 50: North America Market Y-o-Y Growth (%) Projections by Viscosity, 2022 to 2032 Figure 51: North America Market Value (US$ Million) Analysis by Grade, 2017 to 2032 Figure 52: North America Market Volume (Liters) Analysis by Grade, 2017 to 2032 Figure 53: North America Market Value Share (%) and BPS Analysis by Grade, 2022 to 2032 Figure 54: North America Market Y-o-Y Growth (%) Projections by Grade, 2022 to 2032 Figure 55: North America Market Value (US$ Million) Analysis by Property, 2017 to 2032 Figure 56: North America Market Volume (Liters) Analysis by Property, 2017 to 2032 Figure 57: North America Market Value Share (%) and BPS Analysis by Property, 2022 to 2032 Figure 58: North America Market Y-o-Y Growth (%) Projections by Property, 2022 to 2032 Figure 59: North America Market Value (US$ Million) Analysis by Surface Type, 2017 to 2032 Figure 60: North America Market Volume (Liters) Analysis by Surface Type, 2017 to 2032 Figure 61: North America Market Value Share (%) and BPS Analysis by Surface Type, 2022 to 2032 Figure 62: North America Market Y-o-Y Growth (%) Projections by Surface Type, 2022 to 2032 Figure 63: North America Market Value (US$ Million) Analysis by Drying Ability, 2017 to 2032 Figure 64: North America Market Volume (Liters) Analysis by Drying Ability, 2017 to 2032 Figure 65: North America Market Value Share (%) and BPS Analysis by Drying Ability, 2022 to 2032 Figure 66: North America Market Y-o-Y Growth (%) Projections by Drying Ability, 2022 to 2032 Figure 67: North America Market Attractiveness by Viscosity, 2022 to 2032 Figure 68: North America Market Attractiveness by Grade, 2022 to 2032 Figure 69: North America Market Attractiveness by Property, 2022 to 2032 Figure 70: North America Market Attractiveness by Surface Type, 2022 to 2032 Figure 71: North America Market Attractiveness by Drying Ability, 2022 to 2032 Figure 72: North America Market Attractiveness by Country, 2022 to 2032 Figure 73: Latin America Market Value (US$ Million) by Viscosity, 2022 to 2032 Figure 74: Latin America Market Value (US$ Million) by Grade, 2022 to 2032 Figure 75: Latin America Market Value (US$ Million) by Property, 2022 to 2032 Figure 76: Latin America Market Value (US$ Million) by Surface Type, 2022 to 2032 Figure 77: Latin America Market Value (US$ Million) by Drying Ability, 2022 to 2032 Figure 78: Latin America Market Value (US$ Million) by Country, 2022 to 2032 Figure 79: Latin America Market Value (US$ Million) Analysis by Country, 2017 to 2032 Figure 80: Latin America Market Volume (Liters) Analysis by Country, 2017 to 2032 Figure 81: Latin America Market Value Share (%) and BPS Analysis by Country, 2022 to 2032 Figure 82: Latin America Market Y-o-Y Growth (%) Projections by Country, 2022 to 2032 Figure 83: Latin America Market Value (US$ Million) Analysis by Viscosity, 2017 to 2032 Figure 84: Latin America Market Volume (Liters) Analysis by Viscosity, 2017 to 2032 Figure 85: Latin America Market Value Share (%) and BPS Analysis by Viscosity, 2022 to 2032 Figure 86: Latin America Market Y-o-Y Growth (%) Projections by Viscosity, 2022 to 2032 Figure 87: Latin America Market Value (US$ Million) Analysis by Grade, 2017 to 2032 Figure 88: Latin America Market Volume (Liters) Analysis by Grade, 2017 to 2032 Figure 89: Latin America Market Value Share (%) and BPS Analysis by Grade, 2022 to 2032 Figure 90: Latin America Market Y-o-Y Growth (%) Projections by Grade, 2022 to 2032 Figure 91: Latin America Market Value (US$ Million) Analysis by Property, 2017 to 2032 Figure 92: Latin America Market Volume (Liters) Analysis by Property, 2017 to 2032 Figure 93: Latin America Market Value Share (%) and BPS Analysis by Property, 2022 to 2032 Figure 94: Latin America Market Y-o-Y Growth (%) Projections by Property, 2022 to 2032 Figure 95: Latin America Market Value (US$ Million) Analysis by Surface Type, 2017 to 2032 Figure 96: Latin America Market Volume (Liters) Analysis by Surface Type, 2017 to 2032 Figure 97: Latin America Market Value Share (%) and BPS Analysis by Surface Type, 2022 to 2032 Figure 98: Latin America Market Y-o-Y Growth (%) Projections by Surface Type, 2022 to 2032 Figure 99: Latin America Market Value (US$ Million) Analysis by Drying Ability, 2017 to 2032 Figure 100: Latin America Market Volume (Liters) Analysis by Drying Ability, 2017 to 2032 Figure 101: Latin America Market Value Share (%) and BPS Analysis by Drying Ability, 2022 to 2032 Figure 102: Latin America Market Y-o-Y Growth (%) Projections by Drying Ability, 2022 to 2032 Figure 103: Latin America Market Attractiveness by Viscosity, 2022 to 2032 Figure 104: Latin America Market Attractiveness by Grade, 2022 to 2032 Figure 105: Latin America Market Attractiveness by Property, 2022 to 2032 Figure 106: Latin America Market Attractiveness by Surface Type, 2022 to 2032 Figure 107: Latin America Market Attractiveness by Drying Ability, 2022 to 2032 Figure 108: Latin America Market Attractiveness by Country, 2022 to 2032 Figure 109: Europe Market Value (US$ Million) by Viscosity, 2022 to 2032 Figure 110: Europe Market Value (US$ Million) by Grade, 2022 to 2032 Figure 111: Europe Market Value (US$ Million) by Property, 2022 to 2032 Figure 112: Europe Market Value (US$ Million) by Surface Type, 2022 to 2032 Figure 113: Europe Market Value (US$ Million) by Drying Ability, 2022 to 2032 Figure 114: Europe Market Value (US$ Million) by Country, 2022 to 2032 Figure 115: Europe Market Value (US$ Million) Analysis by Country, 2017 to 2032 Figure 116: Europe Market Volume (Liters) Analysis by Country, 2017 to 2032 Figure 117: Europe Market Value Share (%) and BPS Analysis by Country, 2022 to 2032 Figure 118: Europe Market Y-o-Y Growth (%) Projections by Country, 2022 to 2032 Figure 119: Europe Market Value (US$ Million) Analysis by Viscosity, 2017 to 2032 Figure 120: Europe Market Volume (Liters) Analysis by Viscosity, 2017 to 2032 Figure 121: Europe Market Value Share (%) and BPS Analysis by Viscosity, 2022 to 2032 Figure 122: Europe Market Y-o-Y Growth (%) Projections by Viscosity, 2022 to 2032 Figure 123: Europe Market Value (US$ Million) Analysis by Grade, 2017 to 2032 Figure 124: Europe Market Volume (Liters) Analysis by Grade, 2017 to 2032 Figure 125: Europe Market Value Share (%) and BPS Analysis by Grade, 2022 to 2032 Figure 126: Europe Market Y-o-Y Growth (%) Projections by Grade, 2022 to 2032 Figure 127: Europe Market Value (US$ Million) Analysis by Property, 2017 to 2032 Figure 128: Europe Market Volume (Liters) Analysis by Property, 2017 to 2032 Figure 129: Europe Market Value Share (%) and BPS Analysis by Property, 2022 to 2032 Figure 130: Europe Market Y-o-Y Growth (%) Projections by Property, 2022 to 2032 Figure 131: Europe Market Value (US$ Million) Analysis by Surface Type, 2017 to 2032 Figure 132: Europe Market Volume (Liters) Analysis by Surface Type, 2017 to 2032 Figure 133: Europe Market Value Share (%) and BPS Analysis by Surface Type, 2022 to 2032 Figure 134: Europe Market Y-o-Y Growth (%) Projections by Surface Type, 2022 to 2032 Figure 135: Europe Market Value (US$ Million) Analysis by Drying Ability, 2017 to 2032 Figure 136: Europe Market Volume (Liters) Analysis by Drying Ability, 2017 to 2032 Figure 137: Europe Market Value Share (%) and BPS Analysis by Drying Ability, 2022 to 2032 Figure 138: Europe Market Y-o-Y Growth (%) Projections by Drying Ability, 2022 to 2032 Figure 139: Europe Market Attractiveness by Viscosity, 2022 to 2032 Figure 140: Europe Market Attractiveness by Grade, 2022 to 2032 Figure 141: Europe Market Attractiveness by Property, 2022 to 2032 Figure 142: Europe Market Attractiveness by Surface Type, 2022 to 2032 Figure 143: Europe Market Attractiveness by Drying Ability, 2022 to 2032 Figure 144: Europe Market Attractiveness by Country, 2022 to 2032 Figure 145: Asia Pacific Market Value (US$ Million) by Viscosity, 2022 to 2032 Figure 146: Asia Pacific Market Value (US$ Million) by Grade, 2022 to 2032 Figure 147: Asia Pacific Market Value (US$ Million) by Property, 2022 to 2032 Figure 148: Asia Pacific Market Value (US$ Million) by Surface Type, 2022 to 2032 Figure 149: Asia Pacific Market Value (US$ Million) by Drying Ability, 2022 to 2032 Figure 150: Asia Pacific Market Value (US$ Million) by Country, 2022 to 2032 Figure 151: Asia Pacific Market Value (US$ Million) Analysis by Country, 2017 to 2032 Figure 152: Asia Pacific Market Volume (Liters) Analysis by Country, 2017 to 2032 Figure 153: Asia Pacific Market Value Share (%) and BPS Analysis by Country, 2022 to 2032 Figure 154: Asia Pacific Market Y-o-Y Growth (%) Projections by Country, 2022 to 2032 Figure 155: Asia Pacific Market Value (US$ Million) Analysis by Viscosity, 2017 to 2032 Figure 156: Asia Pacific Market Volume (Liters) Analysis by Viscosity, 2017 to 2032 Figure 157: Asia Pacific Market Value Share (%) and BPS Analysis by Viscosity, 2022 to 2032 Figure 158: Asia Pacific Market Y-o-Y Growth (%) Projections by Viscosity, 2022 to 2032 Figure 159: Asia Pacific Market Value (US$ Million) Analysis by Grade, 2017 to 2032 Figure 160: Asia Pacific Market Volume (Liters) Analysis by Grade, 2017 to 2032 Figure 161: Asia Pacific Market Value Share (%) and BPS Analysis by Grade, 2022 to 2032 Figure 162: Asia Pacific Market Y-o-Y Growth (%) Projections by Grade, 2022 to 2032 Figure 163: Asia Pacific Market Value (US$ Million) Analysis by Property, 2017 to 2032 Figure 164: Asia Pacific Market Volume (Liters) Analysis by Property, 2017 to 2032 Figure 165: Asia Pacific Market Value Share (%) and BPS Analysis by Property, 2022 to 2032 Figure 166: Asia Pacific Market Y-o-Y Growth (%) Projections by Property, 2022 to 2032 Figure 167: Asia Pacific Market Value (US$ Million) Analysis by Surface Type, 2017 to 2032 Figure 168: Asia Pacific Market Volume (Liters) Analysis by Surface Type, 2017 to 2032 Figure 169: Asia Pacific Market Value Share (%) and BPS Analysis by Surface Type, 2022 to 2032 Figure 170: Asia Pacific Market Y-o-Y Growth (%) Projections by Surface Type, 2022 to 2032 Figure 171: Asia Pacific Market Value (US$ Million) Analysis by Drying Ability, 2017 to 2032 Figure 172: Asia Pacific Market Volume (Liters) Analysis by Drying Ability, 2017 to 2032 Figure 173: Asia Pacific Market Value Share (%) and BPS Analysis by Drying Ability, 2022 to 2032 Figure 174: Asia Pacific Market Y-o-Y Growth (%) Projections by Drying Ability, 2022 to 2032 Figure 175: Asia Pacific Market Attractiveness by Viscosity, 2022 to 2032 Figure 176: Asia Pacific Market Attractiveness by Grade, 2022 to 2032 Figure 177: Asia Pacific Market Attractiveness by Property, 2022 to 2032 Figure 178: Asia Pacific Market Attractiveness by Surface Type, 2022 to 2032 Figure 179: Asia Pacific Market Attractiveness by Drying Ability, 2022 to 2032 Figure 180: Asia Pacific Market Attractiveness by Country, 2022 to 2032 Figure 181: MEA Market Value (US$ Million) by Viscosity, 2022 to 2032 Figure 182: MEA Market Value (US$ Million) by Grade, 2022 to 2032 Figure 183: MEA Market Value (US$ Million) by Property, 2022 to 2032 Figure 184: MEA Market Value (US$ Million) by Surface Type, 2022 to 2032 Figure 185: MEA Market Value (US$ Million) by Drying Ability, 2022 to 2032 Figure 186: MEA Market Value (US$ Million) by Country, 2022 to 2032 Figure 187: MEA Market Value (US$ Million) Analysis by Country, 2017 to 2032 Figure 188: MEA Market Volume (Liters) Analysis by Country, 2017 to 2032 Figure 189: MEA Market Value Share (%) and BPS Analysis by Country, 2022 to 2032 Figure 190: MEA Market Y-o-Y Growth (%) Projections by Country, 2022 to 2032 Figure 191: MEA Market Value (US$ Million) Analysis by Viscosity, 2017 to 2032 Figure 192: MEA Market Volume (Liters) Analysis by Viscosity, 2017 to 2032 Figure 193: MEA Market Value Share (%) and BPS Analysis by Viscosity, 2022 to 2032 Figure 194: MEA Market Y-o-Y Growth (%) Projections by Viscosity, 2022 to 2032 Figure 195: MEA Market Value (US$ Million) Analysis by Grade, 2017 to 2032 Figure 196: MEA Market Volume (Liters) Analysis by Grade, 2017 to 2032 Figure 197: MEA Market Value Share (%) and BPS Analysis by Grade, 2022 to 2032 Figure 198: MEA Market Y-o-Y Growth (%) Projections by Grade, 2022 to 2032 Figure 199: MEA Market Value (US$ Million) Analysis by Property, 2017 to 2032 Figure 200: MEA Market Volume (Liters) Analysis by Property, 2017 to 2032 Figure 201: MEA Market Value Share (%) and BPS Analysis by Property, 2022 to 2032 Figure 202: MEA Market Y-o-Y Growth (%) Projections by Property, 2022 to 2032 Figure 203: MEA Market Value (US$ Million) Analysis by Surface Type, 2017 to 2032 Figure 204: MEA Market Volume (Liters) Analysis by Surface Type, 2017 to 2032 Figure 205: MEA Market Value Share (%) and BPS Analysis by Surface Type, 2022 to 2032 Figure 206: MEA Market Y-o-Y Growth (%) Projections by Surface Type, 2022 to 2032 Figure 207: MEA Market Value (US$ Million) Analysis by Drying Ability, 2017 to 2032 Figure 208: MEA Market Volume (Liters) Analysis by Drying Ability, 2017 to 2032 Figure 209: MEA Market Value Share (%) and BPS Analysis by Drying Ability, 2022 to 2032 Figure 210: MEA Market Y-o-Y Growth (%) Projections by Drying Ability, 2022 to 2032 Figure 211: MEA Market Attractiveness by Viscosity, 2022 to 2032 Figure 212: MEA Market Attractiveness by Grade, 2022 to 2032 Figure 213: MEA Market Attractiveness by Property, 2022 to 2032 Figure 214: MEA Market Attractiveness by Surface Type, 2022 to 2032 Figure 215: MEA Market Attractiveness by Drying Ability, 2022 to 2032 Figure 216: MEA Market Attractiveness by Country, 2022 to 2032
Recommendations
Explore Chemicals & Materials Insights
View Reports