Acrylic Boxes Market Size and Share Forecast Outlook 2025 to 2035

The global acrylic boxes market is valued at USD 258 million in 2025 and is expected to reach USD 408.5 million by 2035, registering a CAGR of 4.7%.
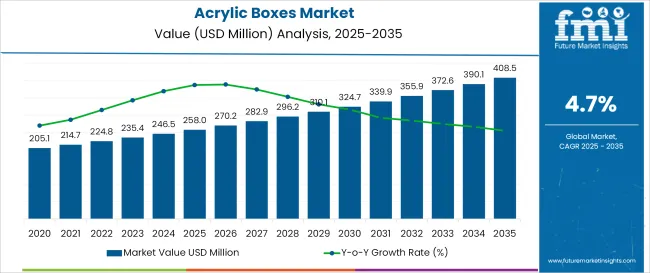
Quick Stats - Acrylic Boxes Market

  • Value of Market (2025): USD 258 million
  • Projected Value Market (2035): USD 408.5 million
  • Forecast CAGR Market (2025 to 2035): 4.7%
  • Leading Segment by Product Type (2025): Telescopic Acrylic Boxes (57% Market Share)
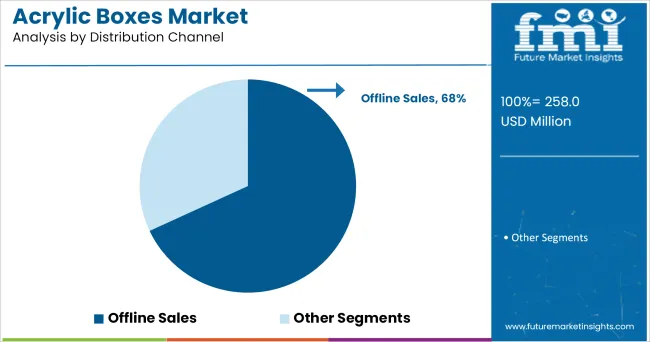
  • Leading Distribution Channel (2025): Offline Sales (68% Share)
  • Fastest Growing Country in Market (2025 to 2035): China is the fastest-growing market with 6.3% CAGR
  • Top Key Players in Market: Plexibox, TAP Plastics, The Plastic People, Acrylic Depot, Clear-Ad, HUAMEI Acrylic Co., Ltd., Shenzhen Yuda Crafts Co., Ltd., and Lucite International

Acrylic Boxes Market

Metric Value
Estimated Size (2025E) USD 258 million
Projected Value (2035F) USD 408.5 million
CAGR (2025 to 2035) 4.7%

Growth is fueled by increasing demand for durable, transparent, and aesthetically appealing storage and display solutions across cosmetics, retail, and gifting sectors. The market is also driven by the rise in customized packaging solutions and the expanding cosmetics and personal care industry.

The market accounts for approximately 3.8% of the global rigid plastic packaging industry, driven by increasing demand for clear, durable, and aesthetically pleasing packaging and storage solutions. In the cosmetics & personal care sector, acrylic boxes contribute around 6.5%, reflecting their widespread use in organizing and displaying beauty products such as skincare, makeup, and grooming kits.

Government regulations impacting the market focus on regulatory and sustainability trends. Government efforts to reduce single-use plastics and promote recyclable or reusable packaging are encouraging manufacturers to innovate with eco-friendly acrylic alternatives, such as recycled PMMA and biodegradable acrylic composites. Design advancements, including modular stacking features, laser engraving, and custom color finishes, are boosting product appeal across end-user industries.

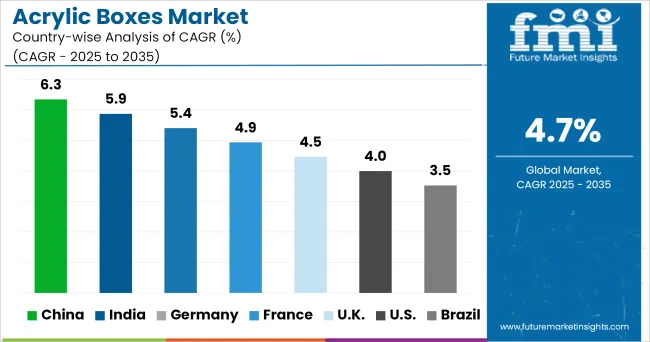
China is projected to be the fastest-growing market, expanding at a CAGR of 6.3% from 2025 to 2035. India and Germany will also witness significant growth with projected CAGRs of 5.9% and 5.4%, respectively.

Analyzing Acrylic Boxes Market by Top Investment Segments

The acrylic boxes market is segmented by product type, end-use industry, distribution channel, and region. By product type, the market is segmented into telescopic boxes, hinged lid boxes.

Based on end-use:, the market is categorized into cosmetics & personal care, homecare products, food and beverage, pharmaceuticals, electrical & electronics, and others. By distribution channel, the market is bifurcated into offline sales and online sales. Regionally, the market is classified into North America, Latin America, Western Europe, Balkans & Baltic, Russia & Belarus, Central Asia, East Asia, South Asia & Pacific, Middle East & Africa.
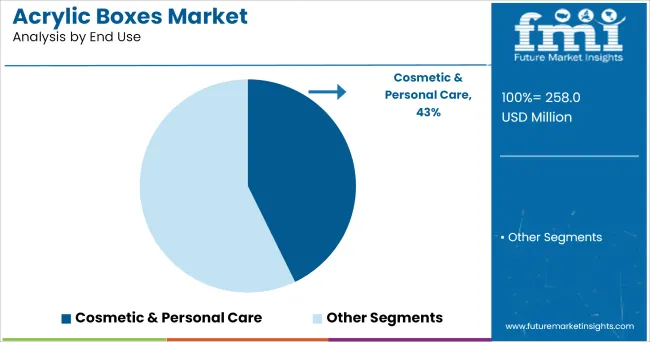
Cosmetics & Personal Care to Lead the End-Use Segment with 43% Market Share

Acrylic Boxes Market Analysis By End Use

Cosmetics & personal care will dominate the end-use segment, accounting for 43% of the global acrylic boxes market share. The sector’s growing demand for premium, transparent packaging solutions to enhance shelf appeal and brand presentation is driving adoption. Acrylic boxes are widely used to store and display skincare kits, makeup products, and grooming essentials in both retail and consumer environments.
  • Acrylic boxes provide clear, sturdy, and aesthetic storage for beauty products, enhancing visual merchandising.
  • Their customizability supports brand differentiation through unique shapes, logos, and finishes.
  • The rising trend of luxury and minimalist packaging is further boosting their usage.
  • Acrylic containers offer durable, long-lasting solutions suitable for repeated consumer use.

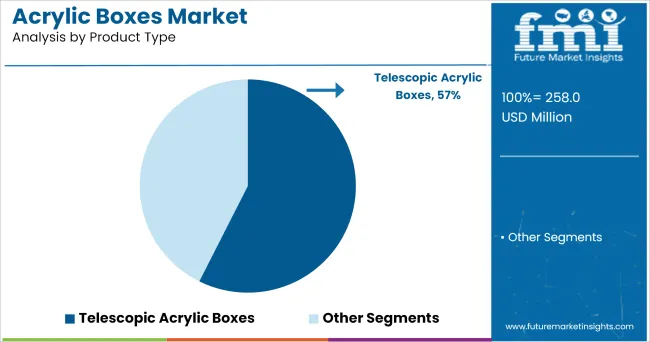
Telescopic Acrylic Boxes to Lead the Product Type Segment with 57% Market Share

Acrylic Boxes Market Analysis By Product Type

Telescopic acrylic boxes are projected to lead the product segment with a 57% share in 2025. Their easy-to-use slide mechanism, modern look, and strong protective enclosure make them highly favored for gifting, jewelry, and cosmetics packaging.
  • These boxes offer secure packaging while showcasing the product through clear visibility.
  • Their structural rigidity makes them ideal for delicate or high-value items such as perfumes and watches.
  • Telescopic designs allow for creative branding and decorative elements.
  • Their reusability contributes to sustainable packaging trends

Offline Sales to Dominate the Distribution Channel Segment with 68% Market Share

Acrylic Boxes Market Analysis By Distribution Channel

Offline sales channels are expected to dominate the distribution channel segment, accounting for 68% of global acrylic box sales in 2025. Physical retail outlets, including department stores, cosmetics showrooms, and home décor shops, continue to be the primary buying hubs for both B2B and B2C consumers.

  • Offline retailers offer the tactile advantage, allowing customers to assess quality and finish.
  • Brick-and-mortar presence supports bulk purchasing by retailers and event planners.
  • Packaging distributors and wholesalers drive significant offline market traction.
  • The trend of in-store customization and personalization is further supporting offline channel dominance.

Top Acrylic Boxes Market Dynamics

The global acrylic boxes market is witnessing steady growth, fueled by increasing demand for premium, transparent, and durable packaging and storage solutions. As consumers and businesses prioritize aesthetics, reusability, and brand presentation, acrylic boxes are becoming widely adopted in cosmetics, gifting, jewelry, retail merchandising, and home organization.

Their visual appeal, rigidity, and customizability make them an ideal choice for high-end product packaging and personal use. In addition, the market is seeing a push toward eco-conscious packaging designs, encouraging the adoption of recyclable and reusable acrylic alternatives.

Recent Trends in the Market

  • Growing demand for customization is leading to increased use of laser-cut logos, personalized engravings, and color finishes.
  • Eco-friendly acrylic materials such as recycled PMMA and bio-based alternatives are gaining popularity among sustainability-focused brands.
  • Luxury and minimalism trends in packaging design are increasing the use of clear acrylic boxes for high-end cosmetics, jewelry, and gift packaging.
  • Integration with LED lighting and modular stacking features is expanding the use of acrylic boxes in event displays and commercial merchandising.

Key Challenges in the Market

  • Environmental concerns around traditional acrylic (PMMA), a non-biodegradable plastic, present challenges for sustainability compliance.
  • High production and customization costs can limit affordability for small businesses and price-sensitive markets.
  • Risk of scratches and breakage during transportation affects perceived durability and shelf appeal.
  • Limited awareness among consumers about eco-friendly or recycled acrylic options hinders broader adoption of sustainable variants.

Acrylic Boxes Market Analysis by Top Countries

Acrylic Boxes Market Cagr Analysis By Country

The USA dominates the acrylic boxes market, driven by high demand in retail displays, cosmetics, and organizational products across commercial and residential sectors. Customization trends and the growth of e-commerce packaging further support market expansion. Germany and the UK are key contributors in Europe, benefiting from robust manufacturing bases and retail innovation.

China and India are emerging as global manufacturing hubs due to their cost-effective production capabilities, growing exports, and domestic demand in organized retail and consumer goods. The Asia Pacific region, in general, is witnessing increased use of acrylic boxes in modern retail environments, hospitality sectors, and exhibitions due to rising disposable incomes and urbanization.

The report covers an in-depth analysis of 40+ countries; with the five top-performing OECD nations highlighted below.

In-Depth Analysis of Acrylic Boxes Market in China

The China acrylic boxes market is projected to grow at a CAGR of 6.3% from 2025 to 2035. Growth is fueled by rapid urbanization, a surge in cosmetics and retail industries, and rising consumer demand for organized, aesthetically appealing storage solutions. China's manufacturing capabilities and expanding middle class continue to drive the need for affordable, customizable acrylic packaging and display solutions.

  • Rapid growth in beauty, personal care, and home organization segments.
  • String domestic production capabilities for acrylic products.
  • Increased use of acrylic boxes in gifting, wedding décor, and retail displays

Growth Outlook of Acrylic Boxes Market in India

The India acrylic boxes market is growing at a CAGR of 5.9% between 2025 and 2035. Growth is supported by expanding urban populations, increasing disposable incomes, and booming demand in the wedding, gifting, and cosmetics industries. Tier-2 and tier-3 cities are also witnessing significant traction due to the rising popularity of modular and transparent storage solutions.

  • Growing use of acrylic boxes for eprsonal care, jewelery, and home organization,
  • Rapid expansion in festive gifting and event decor markets.
  • Surge in online retailing and D2C cosmetic brands boosting demand.

Demand Trajectory for Acrylic Boxes Market in Germany

Germany’s acrylic boxes market is projected to grow at a CAGR of 5.4% from 2025 to 2035. Growth is driven by a rising preference for luxury and sustainable packaging solutions, especially in the cosmetics, jewelry, and premium gifting sectors. German consumers prioritize design, durability, and recyclability-traits that align with acrylic box offerings.

  • Demand for eco-conscious, durable display and storage packaging.
  • Increased use in merchandising, product showcasing, and trade show displays.
  • Germany’s strong retail and e-commerce infrastructure supports growth.

Analysis of Acrylic Boxes Market in France

The France acrylic boxes market is forecast to grow at a CAGR of 4.9% between 2025 and 2035. The market benefits from the country’s thriving fashion, luxury retail, and gourmet gifting industries, where high-quality acrylic packaging adds perceived value. France also shows growing interest in home décor and transparent organizers.

  • High usage in premium beauty and fashion product packaging
  • Demand for personalized and aesthetic storage boxes
  • Expansion in boutique gifting and artisanal food packaging

Growth Prospects of Acrylic Boxes Market in the UK

The UK market is anticipated to grow at a CAGR of 4.5% through 2035. Acrylic boxes are seeing increased adoption for minimalist home storage, vanity organization, and luxury gifting. Consumers favor modular, reusable, and stylish alternatives to traditional packaging.
  • Rising popularity of acrylic drawer and makeup organizers.
  • Retailers leveraging transparent boxes for high-end product displays.
  • Growing e-commerce presence of lifestyle and personal care brands.

Acrylic Boxes Suppliers, Players, and Manufacturers

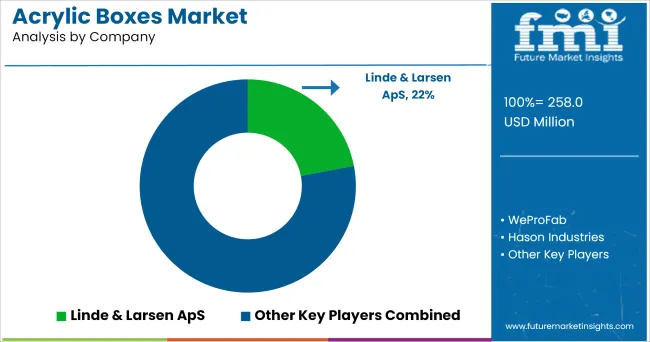
Acrylic Boxes Market Analysis By Company

The acrylic boxes market is moderately fragmented with both global manufacturers and specialized regional players. Leading companies focus on design innovation, durability, and customization to address diverse end-use needs. Prominent manufacturers include IKEA, Acrylic Design Associates, Plexi-Craft, Displays2Go, ULINE, ShopPOPDisplays, Alpha Display, and Adams Plastics. These companies emphasize precision molding, eco-friendly material use, and efficient distribution strategies.

Top acrylic box producers are expanding their portfolios to include UV-resistant, food-safe, and scratch-resistant variants, catering to growing demand from luxury retail, foodservice, and industrial packaging sectors. Collaboration with design agencies and direct-to-consumer brands is gaining traction as firms push for enhanced product visibility and branding.

Recent Acrylic Boxes Market News

In March 2025, ULINE announced a major expansion of its custom acrylic box division, investing USD 45 million in new automated fabrication facilities in the USA Midwest. This move is aimed at increasing production capacity for high-volume retail and warehouse clients while reducing lead times. The expansion reflects rising demand for premium display packaging and organizational solutions amid a post-pandemic shift toward minimalist and reusable storage solutions.

Acrylic Boxes Market Report Scope

Report Attributes Details
Current Total Market Size (2025) USD 258 million
Projected Market Size (2035) USD 408.5 million
CAGR (2025 to 2035) 4.7%
Base Year for Estimation 2024
Historical Period 2020 to 2024
Projections Period 2025 to 2035
Market Analysis Parameters Revenue in USD billions / Volume in kilo tons
By Product Type Telescopic Acrylic Boxes (57%), Hinged Lid Boxes, Magnetic Closure Boxes, Stackable Boxes, and Others
By End-Use Cosmetics & Personal Care (43%), Retail, Food & Beverage, Home & Office, Industrial, and Others
By Distribution Channel Offline Sales and Online Sales
Regions Covered North America, Latin America, Western Europe, Balkans & Baltic, Russia & Belarus, Central Asia, East Asia, South Asia & Pacific, Middle East & Africa
Countries Covered United States, Canada, United Kingdom, Germany, France, China, Japan, South Korea, Brazil, Australia and 40+ countries
Key Players IKEA, Displays2Go, ShopPOPDisplays, ULINE, Plexi-Craft, Acrylic Design Associates, Adams Plastics, Alpha Display
Additional Attributes Dollar sales by product type, share by functionality, regional demand growth, regulatory influence, clean-label trends, competitive benchmarking 

Key Segments

By Product Type:

  • Telescopic
  • Hinged

By End Use:

  • Cosmetic & Personal Care
  • Homecare Products
  • Food & Beverage
  • Pharmaceuticals
  • Electrical & Electronics
  • Other Consumer Goods

By Distribution Channel:

  • Online
  • Offline

By Region:

  • North America
  • Latin America
  • Western Europe
  • Eastern Europe
  • East Asia
  • South Asia & Pacific
  • Middle East and Africa

Table of Content

  1. Executive Summary
    • Global Market Outlook
    • Demand-side Trends
    • Supply-side Trends
    • Technology Roadmap Analysis
    • Analysis and Recommendations
  2. Market Overview
    • Market Coverage / Taxonomy
    • Market Definition / Scope / Limitations
  3. Market Background
    • Market Dynamics
      • Drivers
      • Restraints
      • Opportunity
      • Trends
    • Scenario Forecast
      • Demand in Optimistic Scenario
      • Demand in Likely Scenario
      • Demand in Conservative Scenario
    • Opportunity Map Analysis
    • Product Life Cycle Analysis
    • Supply Chain Analysis
      • Supply Side Participants and their Roles
        • Producers
        • Mid-Level Participants (Traders/ Agents/ Brokers)
        • Wholesalers and Distributors
      • Value Added and Value Created at Node in the Supply Chain
      • List of Raw Material Suppliers
      • List of Existing and Potential Buyer’s
    • Investment Feasibility Matrix
    • Value Chain Analysis
      • Profit Margin Analysis
      • Wholesalers and Distributors
      • Retailers
    • PESTLE and Porter’s Analysis
    • Regulatory Landscape
      • By Key Regions
      • By Key Countries
    • Regional Parent Market Outlook
    • Production and Consumption Statistics
    • Import and Export Statistics
  4. Global Market Analysis 2020 to 2024 and Forecast, 2025 to 2035
    • Historical Market Size Value (USD Million) & Volume (Units) Analysis, 2020 to 2024
    • Current and Future Market Size Value (USD Million) & Volume (Units) Projections, 2025 to 2035
      • Y-o-Y Growth Trend Analysis
      • Absolute $ Opportunity Analysis
  5. Global Market Pricing Analysis 2020 to 2024 and Forecast 2025 to 2035
  6. Global Market Analysis 2020 to 2024 and Forecast 2025 to 2035, By Product Type
    • Introduction / Key Findings
    • Historical Market Size Value (USD Million) & Volume (Units) Analysis By Product Type, 2020 to 2024
    • Current and Future Market Size Value (USD Million) & Volume (Units) Analysis and Forecast By Product Type, 2025 to 2035
      • Telescopic
      • Hinged
    • Y-o-Y Growth Trend Analysis By Product Type, 2020 to 2024
    • Absolute $ Opportunity Analysis By Product Type, 2025 to 2035
  7. Global Market Analysis 2020 to 2024 and Forecast 2025 to 2035, By End Use
    • Introduction / Key Findings
    • Historical Market Size Value (USD Million) & Volume (Units) Analysis By End Use, 2020 to 2024
    • Current and Future Market Size Value (USD Million) & Volume (Units) Analysis and Forecast By End Use, 2025 to 2035
      • Cosmetic & Personal Care
      • Homecare Products
      • Food & Beverage
      • Pharmaceuticals
      • Electrical & Electronics
      • Others
    • Y-o-Y Growth Trend Analysis By End Use, 2020 to 2024
    • Absolute $ Opportunity Analysis By End Use, 2025 to 2035
  8. Global Market Analysis 2020 to 2024 and Forecast 2025 to 2035, By Distribution Channel
    • Introduction / Key Findings
    • Historical Market Size Value (USD Million) & Volume (Units) Analysis By Distribution Channel, 2020 to 2024
    • Current and Future Market Size Value (USD Million) & Volume (Units) Analysis and Forecast By Distribution Channel, 2025 to 2035
      • Online
      • Offline
    • Y-o-Y Growth Trend Analysis By Distribution Channel, 2020 to 2024
    • Absolute $ Opportunity Analysis By Distribution Channel, 2025 to 2035
  9. Global Market Analysis 2020 to 2024 and Forecast 2025 to 2035, By Region
    • Introduction
    • Historical Market Size Value (USD Million) & Volume (Units) Analysis By Region, 2020 to 2024
    • Current Market Size Value (USD Million) & Volume (Units) Analysis and Forecast By Region, 2025 to 2035
      • North America
      • Latin America
      • Western Europe
      • Eastern Europe
      • East Asia
      • South Asia & Pacific
      • Middle East and Africa
    • Market Attractiveness Analysis By Region
  10. North America Market Analysis 2020 to 2024 and Forecast 2025 to 2035, By Country
    • Historical Market Size Value (USD Million) & Volume (Units) Trend Analysis By Market Taxonomy, 2020 to 2024
    • Market Size Value (USD Million) & Volume (Units) Forecast By Market Taxonomy, 2025 to 2035
      • By Country
        • USA
        • Canada
        • Mexico
      • By Product Type
      • By End Use
      • By Distribution Channel
    • Market Attractiveness Analysis
      • By Country
      • By Product Type
      • By End Use
      • By Distribution Channel
    • Key Takeaways
  11. Latin America Market Analysis 2020 to 2024 and Forecast 2025 to 2035, By Country
    • Historical Market Size Value (USD Million) & Volume (Units) Trend Analysis By Market Taxonomy, 2020 to 2024
    • Market Size Value (USD Million) & Volume (Units) Forecast By Market Taxonomy, 2025 to 2035
      • By Country
        • Brazil
        • Argentina
        • Rest of LATAM
      • By Product Type
      • By End Use
      • By Distribution Channel
    • Market Attractiveness Analysis
      • By Country
      • By Product Type
      • By End Use
      • By Distribution Channel
    • Key Takeaways
  12. Western Europe Market Analysis 2020 to 2024 and Forecast 2025 to 2035, By Country
    • Historical Market Size Value (USD Million) & Volume (Units) Trend Analysis By Market Taxonomy, 2020 to 2024
    • Market Size Value (USD Million) & Volume (Units) Forecast By Market Taxonomy, 2025 to 2035
      • By Country
        • Germany
        • Italy
        • France
        • UK
        • Spain
        • BENELUX
        • Nordic
        • Rest of W.Europe
      • By Product Type
      • By End Use
      • By Distribution Channel
    • Market Attractiveness Analysis
      • By Country
      • By Product Type
      • By End Use
      • By Distribution Channel
    • Key Takeaways
  13. Eastern Europe Market Analysis 2020 to 2024 and Forecast 2025 to 2035, By Country
    • Historical Market Size Value (USD Million) & Volume (Units) Trend Analysis By Market Taxonomy, 2020 to 2024
    • Market Size Value (USD Million) & Volume (Units) Forecast By Market Taxonomy, 2025 to 2035
      • By Country
        • Russia
        • Hungary
        • Poland
        • Balkan & Baltics
        • Rest of E. Europe
      • By Product Type
      • By End Use
      • By Distribution Channel
    • Market Attractiveness Analysis
      • By Country
      • By Product Type
      • By End Use
      • By Distribution Channel
    • Key Takeaways
  14. East Asia Market Analysis 2020 to 2024 and Forecast 2025 to 2035, By Country
    • Historical Market Size Value (USD Million) & Volume (Units) Trend Analysis By Market Taxonomy, 2020 to 2024
    • Market Size Value (USD Million) & Volume (Units) Forecast By Market Taxonomy, 2025 to 2035
      • By Country
        • China
        • Japan
        • South Korea
      • By Product Type
      • By End Use
      • By Distribution Channel
    • Market Attractiveness Analysis
      • By Country
      • By Product Type
      • By End Use
      • By Distribution Channel
    • Key Takeaways
  15. South Asia & Pacific Market Analysis 2020 to 2024 and Forecast 2025 to 2035, By Country
    • Historical Market Size Value (USD Million) & Volume (Units) Trend Analysis By Market Taxonomy, 2020 to 2024
    • Market Size Value (USD Million) & Volume (Units) Forecast By Market Taxonomy, 2025 to 2035
      • By Country
        • India
        • Australia & New Zealand
        • ASEAN
        • Rest of SAP
      • By Product Type
      • By End Use
      • By Distribution Channel
    • Market Attractiveness Analysis
      • By Country
      • By Product Type
      • By End Use
      • By Distribution Channel
    • Key Takeaways
  16. Middle East and Africa Market Analysis 2020 to 2024 and Forecast 2025 to 2035, By Country
    • Historical Market Size Value (USD Million) & Volume (Units) Trend Analysis By Market Taxonomy, 2020 to 2024
    • Market Size Value (USD Million) & Volume (Units) Forecast By Market Taxonomy, 2025 to 2035
      • By Country
        • GCC Countries
        • Northern Africa
        • South Africa
        • Turkiye
        • Rest of MEA
      • By Product Type
      • By End Use
      • By Distribution Channel
    • Market Attractiveness Analysis
      • By Country
      • By Product Type
      • By End Use
      • By Distribution Channel
    • Key Takeaways
  17. Key Countries Market Analysis
    • USA
      • Pricing Analysis
      • Market Share Analysis, 2024
        • By Product Type
        • By End Use
        • By Distribution Channel
    • Canada
      • Pricing Analysis
      • Market Share Analysis, 2024
        • By Product Type
        • By End Use
        • By Distribution Channel
    • Brazil
      • Pricing Analysis
      • Market Share Analysis, 2024
        • By Product Type
        • By End Use
        • By Distribution Channel
    • Mexico
      • Pricing Analysis
      • Market Share Analysis, 2024
        • By Product Type
        • By End Use
        • By Distribution Channel
    • Argentina
      • Pricing Analysis
      • Market Share Analysis, 2024
        • By Product Type
        • By End Use
        • By Distribution Channel
  18. Market Structure Analysis
    • Competition Dashboard
    • Competition Benchmarking
    • Market Share Analysis of Top Players
      • By Regional
      • By Product Type
      • By End Use
      • By Distribution Channel
  19. Competition Analysis
    • Competition Deep Dive
      • Linde & Larsen ApS
        • Overview
        • Product Portfolio
        • Profitability by Market Segments (Product/Age /Sales Channel/Region)
        • Sales Footprint
        • Strategy Overview
          • Marketing Strategy
          • Product Strategy
          • Channel Strategy
      • WeProFab
        • Overview
        • Product Portfolio
        • Profitability by Market Segments (Product/Age /Sales Channel/Region)
        • Sales Footprint
        • Strategy Overview
          • Marketing Strategy
          • Product Strategy
          • Channel Strategy
      • Hason Industries
        • Overview
        • Product Portfolio
        • Profitability by Market Segments (Product/Age /Sales Channel/Region)
        • Sales Footprint
        • Strategy Overview
          • Marketing Strategy
          • Product Strategy
          • Channel Strategy
      • TurkishExporter
        • Overview
        • Product Portfolio
        • Profitability by Market Segments (Product/Age /Sales Channel/Region)
        • Sales Footprint
        • Strategy Overview
          • Marketing Strategy
          • Product Strategy
          • Channel Strategy
      • Faberplast
        • Overview
        • Product Portfolio
        • Profitability by Market Segments (Product/Age /Sales Channel/Region)
        • Sales Footprint
        • Strategy Overview
          • Marketing Strategy
          • Product Strategy
          • Channel Strategy
      • Gevacril
        • Overview
        • Product Portfolio
        • Profitability by Market Segments (Product/Age /Sales Channel/Region)
        • Sales Footprint
        • Strategy Overview
          • Marketing Strategy
          • Product Strategy
          • Channel Strategy
      • Akrylix
        • Overview
        • Product Portfolio
        • Profitability by Market Segments (Product/Age /Sales Channel/Region)
        • Sales Footprint
        • Strategy Overview
          • Marketing Strategy
          • Product Strategy
          • Channel Strategy
      • S.D Corporation
        • Overview
        • Product Portfolio
        • Profitability by Market Segments (Product/Age /Sales Channel/Region)
        • Sales Footprint
        • Strategy Overview
          • Marketing Strategy
          • Product Strategy
          • Channel Strategy
      • Advent Plastic
        • Overview
        • Product Portfolio
        • Profitability by Market Segments (Product/Age /Sales Channel/Region)
        • Sales Footprint
        • Strategy Overview
          • Marketing Strategy
          • Product Strategy
          • Channel Strategy
      • WALGAS GROUP
        • Overview
        • Product Portfolio
        • Profitability by Market Segments (Product/Age /Sales Channel/Region)
        • Sales Footprint
        • Strategy Overview
          • Marketing Strategy
          • Product Strategy
          • Channel Strategy
      • Clear Acrylic Display
        • Overview
        • Product Portfolio
        • Profitability by Market Segments (Product/Age /Sales Channel/Region)
        • Sales Footprint
        • Strategy Overview
          • Marketing Strategy
          • Product Strategy
          • Channel Strategy
  20. Assumptions & Acronyms Used
  21. Research Methodology

List of Tables

  • Table 1: Global Market Value (USD Million) Forecast by Region, 2020 to 2035
  • Table 2: Global Market Volume (Units) Forecast by Region, 2020 to 2035
  • Table 3: Global Market Value (USD Million) Forecast by Product Type, 2020 to 2035
  • Table 4: Global Market Volume (Units) Forecast by Product Type, 2020 to 2035
  • Table 5: Global Market Value (USD Million) Forecast by End Use, 2020 to 2035
  • Table 6: Global Market Volume (Units) Forecast by End Use, 2020 to 2035
  • Table 7: Global Market Value (USD Million) Forecast by Distribution Channel, 2020 to 2035
  • Table 8: Global Market Volume (Units) Forecast by Distribution Channel, 2020 to 2035
  • Table 9: North America Market Value (USD Million) Forecast by Country, 2020 to 2035
  • Table 10: North America Market Volume (Units) Forecast by Country, 2020 to 2035
  • Table 11: North America Market Value (USD Million) Forecast by Product Type, 2020 to 2035
  • Table 12: North America Market Volume (Units) Forecast by Product Type, 2020 to 2035
  • Table 13: North America Market Value (USD Million) Forecast by End Use, 2020 to 2035
  • Table 14: North America Market Volume (Units) Forecast by End Use, 2020 to 2035
  • Table 15: North America Market Value (USD Million) Forecast by Distribution Channel, 2020 to 2035
  • Table 16: North America Market Volume (Units) Forecast by Distribution Channel, 2020 to 2035
  • Table 17: Latin America Market Value (USD Million) Forecast by Country, 2020 to 2035
  • Table 18: Latin America Market Volume (Units) Forecast by Country, 2020 to 2035
  • Table 19: Latin America Market Value (USD Million) Forecast by Product Type, 2020 to 2035
  • Table 20: Latin America Market Volume (Units) Forecast by Product Type, 2020 to 2035
  • Table 21: Latin America Market Value (USD Million) Forecast by End Use, 2020 to 2035
  • Table 22: Latin America Market Volume (Units) Forecast by End Use, 2020 to 2035
  • Table 23: Latin America Market Value (USD Million) Forecast by Distribution Channel, 2020 to 2035
  • Table 24: Latin America Market Volume (Units) Forecast by Distribution Channel, 2020 to 2035
  • Table 25: Western Europe Market Value (USD Million) Forecast by Country, 2020 to 2035
  • Table 26: Western Europe Market Volume (Units) Forecast by Country, 2020 to 2035
  • Table 27: Western Europe Market Value (USD Million) Forecast by Product Type, 2020 to 2035
  • Table 28: Western Europe Market Volume (Units) Forecast by Product Type, 2020 to 2035
  • Table 29: Western Europe Market Value (USD Million) Forecast by End Use, 2020 to 2035
  • Table 30: Western Europe Market Volume (Units) Forecast by End Use, 2020 to 2035
  • Table 31: Western Europe Market Value (USD Million) Forecast by Distribution Channel, 2020 to 2035
  • Table 32: Western Europe Market Volume (Units) Forecast by Distribution Channel, 2020 to 2035
  • Table 33: Eastern Europe Market Value (USD Million) Forecast by Country, 2020 to 2035
  • Table 34: Eastern Europe Market Volume (Units) Forecast by Country, 2020 to 2035
  • Table 35: Eastern Europe Market Value (USD Million) Forecast by Product Type, 2020 to 2035
  • Table 36: Eastern Europe Market Volume (Units) Forecast by Product Type, 2020 to 2035
  • Table 37: Eastern Europe Market Value (USD Million) Forecast by End Use, 2020 to 2035
  • Table 38: Eastern Europe Market Volume (Units) Forecast by End Use, 2020 to 2035
  • Table 39: Eastern Europe Market Value (USD Million) Forecast by Distribution Channel, 2020 to 2035
  • Table 40: Eastern Europe Market Volume (Units) Forecast by Distribution Channel, 2020 to 2035
  • Table 41: East Asia Market Value (USD Million) Forecast by Country, 2020 to 2035
  • Table 42: East Asia Market Volume (Units) Forecast by Country, 2020 to 2035
  • Table 43: East Asia Market Value (USD Million) Forecast by Product Type, 2020 to 2035
  • Table 44: East Asia Market Volume (Units) Forecast by Product Type, 2020 to 2035
  • Table 45: East Asia Market Value (USD Million) Forecast by End Use, 2020 to 2035
  • Table 46: East Asia Market Volume (Units) Forecast by End Use, 2020 to 2035
  • Table 47: East Asia Market Value (USD Million) Forecast by Distribution Channel, 2020 to 2035
  • Table 48: East Asia Market Volume (Units) Forecast by Distribution Channel, 2020 to 2035
  • Table 49: South Asia & Pacific Market Value (USD Million) Forecast by Country, 2020 to 2035
  • Table 50: South Asia & Pacific Market Volume (Units) Forecast by Country, 2020 to 2035
  • Table 51: South Asia & Pacific Market Value (USD Million) Forecast by Product Type, 2020 to 2035
  • Table 52: South Asia & Pacific Market Volume (Units) Forecast by Product Type, 2020 to 2035
  • Table 53: South Asia & Pacific Market Value (USD Million) Forecast by End Use, 2020 to 2035
  • Table 54: South Asia & Pacific Market Volume (Units) Forecast by End Use, 2020 to 2035
  • Table 55: South Asia & Pacific Market Value (USD Million) Forecast by Distribution Channel, 2020 to 2035
  • Table 56: South Asia & Pacific Market Volume (Units) Forecast by Distribution Channel, 2020 to 2035
  • Table 57: Middle East and Africa Market Value (USD Million) Forecast by Country, 2020 to 2035
  • Table 58: Middle East and Africa Market Volume (Units) Forecast by Country, 2020 to 2035
  • Table 59: Middle East and Africa Market Value (USD Million) Forecast by Product Type, 2020 to 2035
  • Table 60: Middle East and Africa Market Volume (Units) Forecast by Product Type, 2020 to 2035
  • Table 61: Middle East and Africa Market Value (USD Million) Forecast by End Use, 2020 to 2035
  • Table 62: Middle East and Africa Market Volume (Units) Forecast by End Use, 2020 to 2035
  • Table 63: Middle East and Africa Market Value (USD Million) Forecast by Distribution Channel, 2020 to 2035
  • Table 64: Middle East and Africa Market Volume (Units) Forecast by Distribution Channel, 2020 to 2035

List of Figures

  • Figure 1: Global Market Volume (Units) Forecast 2020 to 2035
  • Figure 2: Global Market Pricing Analysis
  • Figure 3: Global Market Value (USD Million) Forecast 2020 to 2035
  • Figure 4: Global Market Value Share and BPS Analysis by Product Type, 2025 and 2035
  • Figure 5: Global Market Y-o-Y Growth Comparison by Product Type, 2025 to 2035
  • Figure 6: Global Market Attractiveness Analysis by Product Type
  • Figure 7: Global Market Value Share and BPS Analysis by End Use, 2025 and 2035
  • Figure 8: Global Market Y-o-Y Growth Comparison by End Use, 2025 to 2035
  • Figure 9: Global Market Attractiveness Analysis by End Use
  • Figure 10: Global Market Value Share and BPS Analysis by Distribution Channel, 2025 and 2035
  • Figure 11: Global Market Y-o-Y Growth Comparison by Distribution Channel, 2025 to 2035
  • Figure 12: Global Market Attractiveness Analysis by Distribution Channel
  • Figure 13: Global Market Value (USD Million) Share and BPS Analysis by Region, 2025 and 2035
  • Figure 14: Global Market Y-o-Y Growth Comparison by Region, 2025 to 2035
  • Figure 15: Global Market Attractiveness Analysis by Region
  • Figure 16: North America Market Incremental $ Opportunity, 2025 to 2035
  • Figure 17: Latin America Market Incremental $ Opportunity, 2025 to 2035
  • Figure 18: Western Europe Market Incremental $ Opportunity, 2025 to 2035
  • Figure 19: Eastern Europe Market Incremental $ Opportunity, 2025 to 2035
  • Figure 20: East Asia Market Incremental $ Opportunity, 2025 to 2035
  • Figure 21: South Asia & Pacific Market Incremental $ Opportunity, 2025 to 2035
  • Figure 22: Middle East and Africa Market Incremental $ Opportunity, 2025 to 2035
  • Figure 23: North America Market Value Share and BPS Analysis by Country, 2025 and 2035
  • Figure 24: North America Market Value Share and BPS Analysis by Product Type, 2025 and 2035
  • Figure 25: North America Market Y-o-Y Growth Comparison by Product Type, 2025 to 2035
  • Figure 26: North America Market Attractiveness Analysis by Product Type
  • Figure 27: North America Market Value Share and BPS Analysis by End Use, 2025 and 2035
  • Figure 28: North America Market Y-o-Y Growth Comparison by End Use, 2025 to 2035
  • Figure 29: North America Market Attractiveness Analysis by End Use
  • Figure 30: North America Market Value Share and BPS Analysis by Distribution Channel, 2025 and 2035
  • Figure 31: North America Market Y-o-Y Growth Comparison by Distribution Channel, 2025 to 2035
  • Figure 32: North America Market Attractiveness Analysis by Distribution Channel
  • Figure 33: Latin America Market Value Share and BPS Analysis by Country, 2025 and 2035
  • Figure 34: Latin America Market Value Share and BPS Analysis by Product Type, 2025 and 2035
  • Figure 35: Latin America Market Y-o-Y Growth Comparison by Product Type, 2025 to 2035
  • Figure 36: Latin America Market Attractiveness Analysis by Product Type
  • Figure 37: Latin America Market Value Share and BPS Analysis by End Use, 2025 and 2035
  • Figure 38: Latin America Market Y-o-Y Growth Comparison by End Use, 2025 to 2035
  • Figure 39: Latin America Market Attractiveness Analysis by End Use
  • Figure 40: Latin America Market Value Share and BPS Analysis by Distribution Channel, 2025 and 2035
  • Figure 41: Latin America Market Y-o-Y Growth Comparison by Distribution Channel, 2025 to 2035
  • Figure 42: Latin America Market Attractiveness Analysis by Distribution Channel
  • Figure 43: Western Europe Market Value Share and BPS Analysis by Country, 2025 and 2035
  • Figure 44: Western Europe Market Value Share and BPS Analysis by Product Type, 2025 and 2035
  • Figure 45: Western Europe Market Y-o-Y Growth Comparison by Product Type, 2025 to 2035
  • Figure 46: Western Europe Market Attractiveness Analysis by Product Type
  • Figure 47: Western Europe Market Value Share and BPS Analysis by End Use, 2025 and 2035
  • Figure 48: Western Europe Market Y-o-Y Growth Comparison by End Use, 2025 to 2035
  • Figure 49: Western Europe Market Attractiveness Analysis by End Use
  • Figure 50: Western Europe Market Value Share and BPS Analysis by Distribution Channel, 2025 and 2035
  • Figure 51: Western Europe Market Y-o-Y Growth Comparison by Distribution Channel, 2025 to 2035
  • Figure 52: Western Europe Market Attractiveness Analysis by Distribution Channel
  • Figure 53: Eastern Europe Market Value Share and BPS Analysis by Country, 2025 and 2035
  • Figure 54: Eastern Europe Market Value Share and BPS Analysis by Product Type, 2025 and 2035
  • Figure 55: Eastern Europe Market Y-o-Y Growth Comparison by Product Type, 2025 to 2035
  • Figure 56: Eastern Europe Market Attractiveness Analysis by Product Type
  • Figure 57: Eastern Europe Market Value Share and BPS Analysis by End Use, 2025 and 2035
  • Figure 58: Eastern Europe Market Y-o-Y Growth Comparison by End Use, 2025 to 2035
  • Figure 59: Eastern Europe Market Attractiveness Analysis by End Use
  • Figure 60: Eastern Europe Market Value Share and BPS Analysis by Distribution Channel, 2025 and 2035
  • Figure 61: Eastern Europe Market Y-o-Y Growth Comparison by Distribution Channel, 2025 to 2035
  • Figure 62: Eastern Europe Market Attractiveness Analysis by Distribution Channel
  • Figure 63: East Asia Market Value Share and BPS Analysis by Country, 2025 and 2035
  • Figure 64: East Asia Market Value Share and BPS Analysis by Product Type, 2025 and 2035
  • Figure 65: East Asia Market Y-o-Y Growth Comparison by Product Type, 2025 to 2035
  • Figure 66: East Asia Market Attractiveness Analysis by Product Type
  • Figure 67: East Asia Market Value Share and BPS Analysis by End Use, 2025 and 2035
  • Figure 68: East Asia Market Y-o-Y Growth Comparison by End Use, 2025 to 2035
  • Figure 69: East Asia Market Attractiveness Analysis by End Use
  • Figure 70: East Asia Market Value Share and BPS Analysis by Distribution Channel, 2025 and 2035
  • Figure 71: East Asia Market Y-o-Y Growth Comparison by Distribution Channel, 2025 to 2035
  • Figure 72: East Asia Market Attractiveness Analysis by Distribution Channel
  • Figure 73: South Asia & Pacific Market Value Share and BPS Analysis by Country, 2025 and 2035
  • Figure 74: South Asia & Pacific Market Value Share and BPS Analysis by Product Type, 2025 and 2035
  • Figure 75: South Asia & Pacific Market Y-o-Y Growth Comparison by Product Type, 2025 to 2035
  • Figure 76: South Asia & Pacific Market Attractiveness Analysis by Product Type
  • Figure 77: South Asia & Pacific Market Value Share and BPS Analysis by End Use, 2025 and 2035
  • Figure 78: South Asia & Pacific Market Y-o-Y Growth Comparison by End Use, 2025 to 2035
  • Figure 79: South Asia & Pacific Market Attractiveness Analysis by End Use
  • Figure 80: South Asia & Pacific Market Value Share and BPS Analysis by Distribution Channel, 2025 and 2035
  • Figure 81: South Asia & Pacific Market Y-o-Y Growth Comparison by Distribution Channel, 2025 to 2035
  • Figure 82: South Asia & Pacific Market Attractiveness Analysis by Distribution Channel
  • Figure 83: Middle East and Africa Market Value Share and BPS Analysis by Country, 2025 and 2035
  • Figure 84: Middle East and Africa Market Value Share and BPS Analysis by Product Type, 2025 and 2035
  • Figure 85: Middle East and Africa Market Y-o-Y Growth Comparison by Product Type, 2025 to 2035
  • Figure 86: Middle East and Africa Market Attractiveness Analysis by Product Type
  • Figure 87: Middle East and Africa Market Value Share and BPS Analysis by End Use, 2025 and 2035
  • Figure 88: Middle East and Africa Market Y-o-Y Growth Comparison by End Use, 2025 to 2035
  • Figure 89: Middle East and Africa Market Attractiveness Analysis by End Use
  • Figure 90: Middle East and Africa Market Value Share and BPS Analysis by Distribution Channel, 2025 and 2035
  • Figure 91: Middle East and Africa Market Y-o-Y Growth Comparison by Distribution Channel, 2025 to 2035
  • Figure 92: Middle East and Africa Market Attractiveness Analysis by Distribution Channel
  • Figure 93: Global Market - Tier Structure Analysis
  • Figure 94: Global Market - Company Share Analysis

Frequently Asked Questions

What is the projected size of the acrylic boxes market in 2025?

The market size is valued at USD 258 million in 2025.

What is the outlook on acrylic box demand by 2035?

The market is forecasted to reach USD 408.5 million by 2035, reflecting a CAGR of 4.7% from 2025 to 2035.

Which segment leads the acrylic boxes market by product type in 2025?

Telescopic acrylic boxes will lead the product type segment, accounting for 57% of the global market share in 2025.

What is the top end-use segment for the acrylic boxes market by 2025?

Cosmetics & personal care will dominate the end-use segment with a 43% share in 2025.

Which distribution channel holds the largest share in the acrylic boxes market?

Offline sales will remain the leading distribution channel, contributing to 68% of global sales in 2025.

Which country is projected to have the fastest-growing acrylic boxes market?

China is projected to grow at the fastest rate, with a CAGR of 6.3% from 2025 to 2035.

Explore Similar Insights

Future Market Insights

Acrylic Boxes Market