Fibreglass Trays Market
Market Insights on Fibreglass Trays covering sales outlook, demand forecast & up-to-date key trends
Fibreglass Trays Market by Sales Channel, End-Use & Region - Forecast 2022 – 2032
Fibreglass Trays Market Overview (2022-2032)
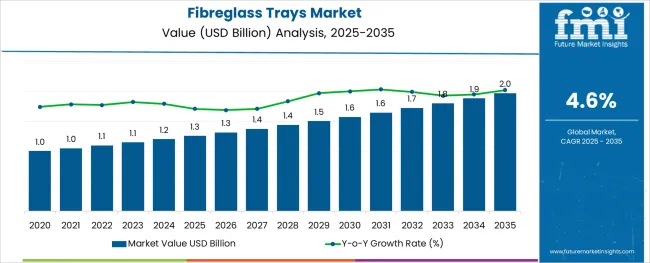
[250 Pages Report] The global fiberglass trays demand is anticipated to increase at around 4.2% to 4.6% CAGR during the forecast period. Growth in the market is driven by rising adoption of fiberglass trays across various end use verticals such as foodservice, pharmaceuticals, and bakery & confectionery.
Report Attribute |
Details |
Fiberglass Trays Market Projected Growth Rate (2022-2032) |
4.2% - 4.6% CAGR |
Fiberglass trays are highly durable and lightweight trays made of high-strength glass-reinforced composites. They find applications across various industries due to their attractive features.
In recent years fiberglass trays have become highly sought-after food serving solutions used across various sectors. They are an ideal option for high volume establishments like school dining halls, cafeterias, restaurants etc. where they are used for serving food products like salads, dishes, pasta desserts and several other food products.
Fiberglass trays offer various features such as lightweight, odor and stain resistance, cost effectiveness and durability which makes them ideal for usage across various industries. They have become ideal alternatives to metal trays and containers used in food and beverage industry.
Rising usage of fiberglass trays for material handling purposes in pharmaceutical, household, and food sectors will continue to provide a strong thrust to the growth of fiberglass trays market during the forecast period.
Fiberglass trays are available in various designs, shapes, and sizes in the market. End users can select any product as per their requirements. Besides this, fiberglass trays can also be personalized with an image or logo for branding purposes.
Let us know your requirement to get
100% FREE customization
Which Factors are Driving the Growth in Fiberglass Trays Market?
Exponential growth of end-use industries due to population explosion and increasing consumer spending, growing awareness among people regarding the benefits of fiberglass trays, and innovations in fiberglass tray design and sizes are some of the major factors driving the growth in fiberglass trays market.
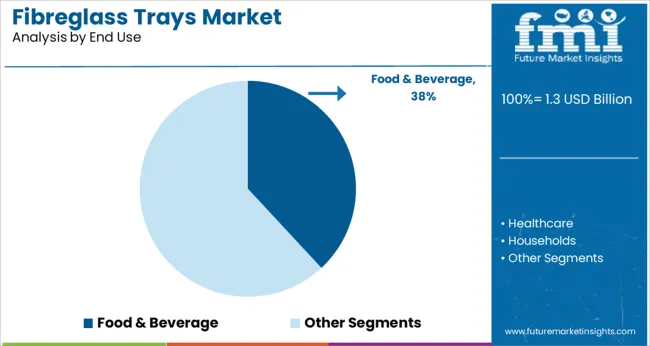
Fiberglas trays have become ideal solutions for material handling applications across various end use verticals such as foodservice, pharmaceuticals, and bakery & confectionery. They are preferred over other traditional trays on account of their functionality, lightweight, durability, and heat resistant nature.
The robust growth of foodservice industry due to rapidly growing world population and changing lifestyle is creating enormous demand for more convenient products like fiberglass trays and the trend is likely to continue in the future. These fiberglass trays are being used in cafeterias, restaurants, motels etc. for carrying or transporting food from the serving area to the dining area.
What really makes fiberglass trays suitable for serving food products, especially hot ones, is their ability to withstand higher temperatures. Today, majority of food serving companies are inclined towards using fiberglass trays as they offer better service, are more hygienic, and can be cleaned easily. Increasing adoption of fiberglass trays coupled with rapid expansion of foodservice industry will continue to push the sales of fiberglass trays during the assessment period.
Moreover, rising usage of fiberglass trays across households for serving food products and several other applications will further expand the size of fiberglass trays market during the forthcoming years.
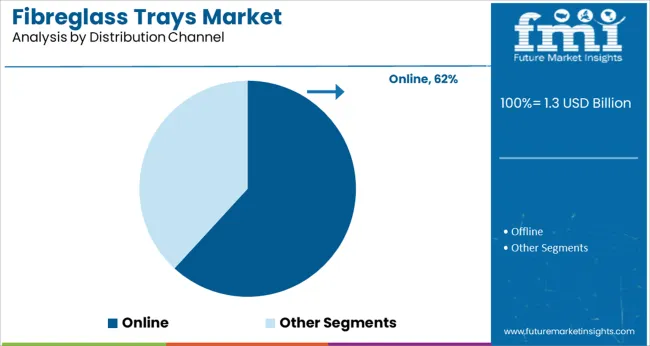
In addition to this, easy availability of various fiberglass tray products at discount across online shopping platforms, supermarkets, convenience stores, specialty stores, etc. is positively impacting the market growth.
What are the Challenges Faced by the Fiberglass Trays Industry?
Despite rising popularity of fiberglass tries across food and pharmaceutical industries, there are various factors that are likely to challenge market growth in the forthcoming years. Some of these factors are the presence of low-cost alternatives and poor product penetration across some developing and underdeveloped regions.
Find your sweet spots for generating winning opportunities in this market.
Talk to AnalystWhy are Sales of Fiberglass Trays Rising Across Asia Pacific?
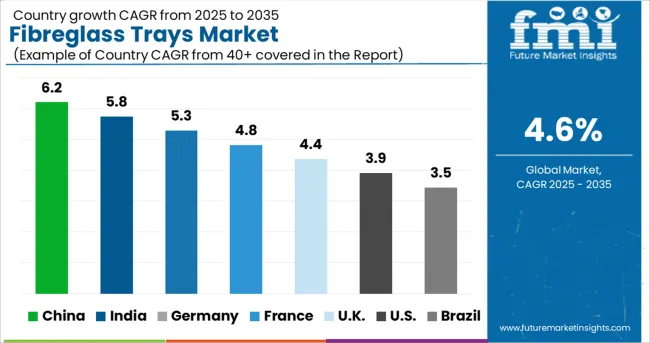
With rapid expansion of end-use industries, rapidly growing population, changing lifestyle, and increasing spending by people on food products, the Asia Pacific fiberglass trays market is projected to grow at a faster pace during the forecast period.
Demand for fiberglass trays is particularly high across fast growing countries like China and India due to their multiple applications in several industries such food & beverages, bakery, and pharmaceuticals. These fiberglass trays are being increasingly used for carrying things and serving food items.
How Will Growth Unfold in the Western Europe Fiberglass Trays Market?
According to Future Market Insights, Western Europe accounts for a significant share of the global fiberglass trays market and is forecast to grow at a notable CAGR over the forecast period, owing to the rapid expansion of bakery and confectionery industry, flourishing HoReCa sector, and presence of some leading market players.
Countries such as Germany, Poland, Belgium, U.K and Czech Republic are all generating high demand for fiberglass trays, as these regions are witnessing an uptick in foodservice and tourism.
Besides this, increasing adoption of fiberglass trays in pharmaceutical and confectionery industries for material handling purposes will further boost the market growth across Europe during the assessment period.
A unified Market Research Subscription Platform, built for today's disparate research needs.
Market Competition
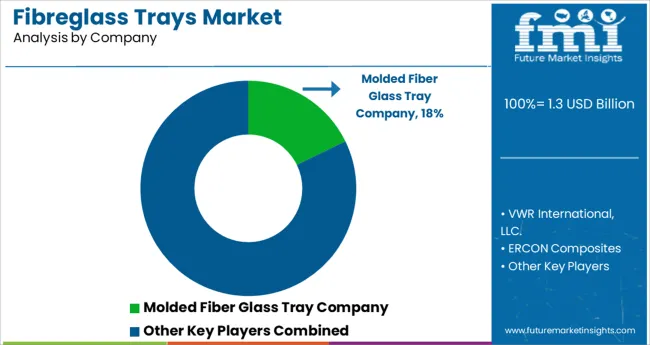
Some of the key participants present in the global fiberglass trays market include Huhtamaki Group, Roltex NV, Carlisle FoodService Products, Molded Fiber Glass Trays Company, Keswick Trays, and Shawson Plastics among others.
These market players are continuously introducing new fiberglass trays with multiple designs, features, and capacities to woo more and more customers. Furthermore, they have adopted growth strategies such as partnerships, establishment of new manufacturing facilities, reduction in product prices, and move towards online sales channels to gain a competitive edge in the market.
Report Scope
Report Attribute |
Details |
Growth Rate |
CAGR of 4.2% - 4.6% from 2022 to 2032 |
Base Year for Estimation |
2021 |
Historical Data |
2015-2020 |
Forecast Period |
2022-2032 |
Quantitative Units |
Revenue in USD Million and CAGR from 2022-2032 |
Report Coverage |
Revenue Forecast, Volume Forecast, Company Ranking, Competitive Landscape, Growth Factors, Trends and Pricing Analysis |
Segments Covered |
|
Regions Covered |
|
Key Countries Profiled |
|
Key Companies Profiled |
|
Customization |
Available Upon Request |
Key Segments Profiled in the Fiberglass Trays Industry Survey
By Sales Channel:
- Manufacturers (Direct Sales)
- Distributors
- Retailers
- Hypermarkets
- Supermarkets
- Convenience Stores
- Specialty Stores
- Discount Stores & Warehouse/Wholesale Clubs
- E-retail
By End Use:
- Foodservice
- Bakery & Confectionery
- Pharmaceuticals
- Medical
- Household
- Others
By Region:
- North America
- Latin America
- Western Europe
- Eastern Europe
- APEJ
- Japan
- Middle East & Africa
Frequently Asked Questions
At what rate will the global fiberglass trays market grow?
FMI projects the global fiberglass trays market to grow at around 4.2% to 4.6% CAGR over the forecast period.
Which is the most lucrative market for fiberglass trays?
As per FMI, Asia Pacific will continue to remain the most lucrative market for fiberglass trays during the assessment period from 2022 to 2032.
Which are some prominent fiberglass trays manufacturers?
Huhtamaki Group, Roltex NV, Carlisle FoodService Products, and Molded Fiber Glass Trays Company are some prominent fiberglass trays manufacturers
Table of Content
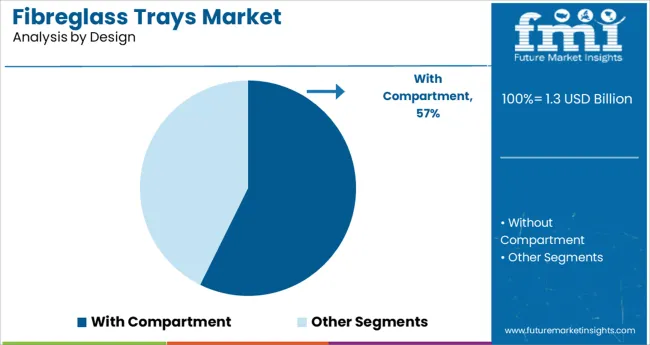
1. Executive Summary 1.1. Global Market Outlook 1.2. Demand-side Trends 1.3. Supply-side Trends 1.4. Technology Roadmap Analysis 1.5. Analysis and Recommendations 2. Market Overview 2.1. Market Coverage / Taxonomy 2.2. Market Definition / Scope / Limitations 3. Market Background 3.1. Market Dynamics 3.1.1. Drivers 3.1.2. Restraints 3.1.3. Opportunity 3.1.4. Trends 3.2. Impact of Covid-19 3.2.1. Demand in Optimistic Scenario 3.2.2. Demand in Likely Scenario 3.2.3. Demand in Conservative Scenario 3.3. Macro Factors and Forecast Factors 3.4. Value Chain Analysis 3.4.1. Profit Margin Analysis 3.4.2. Raw Material Suppliers 3.4.3. Manufacturers, Wholesalers and Distributors 3.4.4. End Users/ Customers 3.5. Regional Parent Market Outlook 3.6. Production and Consumption Statistics 3.7. Global Average Pricing Analysis Benchmark 4. Global Market Analysis 2015-2021 and Forecast, 2022-2032 4.1. Historical Market Size Value (US$ Mn) & Volume (Units) Analysis, 2015-2021 4.2. Current and Future Market Size Value (US$ Mn) & Volume (Units) Projections, 2022-2032 4.2.1. Y-o-Y Growth Trend Analysis 4.2.2. Absolute $ Opportunity Analysis 5. Global Market Analysis 2015–2021 and Forecast 2022–2032, By Design 5.1. Introduction / Key Findings 5.2. Historical Market Size Value (US$ Mn) & Volume (Units) Analysis by Design, 2015-2021 5.3. Current and Future Market Size Value (US$ Mn) & Volume (Units) Analysis and Forecast by Design, 2022-2032 5.3.1. With Compartment 5.3.2. Without Compartment 5.4. Y-o-Y Growth Trend Analysis by Design, 2015-2021 5.5. Absolute $ Opportunity Analysis by Design, 2022-2032 6. Global Market Analysis 2015–2021 and Forecast 2022–2032, By End Use 6.1. Introduction / Key Findings 6.2. Historical Market Size Value (US$ Mn) & Volume (Units) Analysis by End Use, 2015-2021 6.3. Current and Future Market Size Value (US$ Mn) & Volume (Units) Analysis and Forecast by End Use, 2022-2032 6.3.1. Food & Beverage 6.3.2. Healthcare 6.3.3. Households 6.3.4. Other Consumer Goods 6.4. Y-o-Y Growth Trend Analysis by End Use, 2015-2021 6.5. Absolute $ Opportunity Analysis by End Use, 2022-2032 7. Global Market Analysis 2015–2021 and Forecast 2022–2032, By Distribution Channel 7.1. Introduction / Key Findings 7.2. Historical Market Size Value (US$ Mn) & Volume (Units) Analysis by Distribution Channel, 2015-2021 7.3. Current and Future Market Size Value (US$ Mn) & Volume (Units) Analysis and Forecast by Distribution Channel, 2022-2032 7.3.1. Online 7.3.2. Offline 7.4. Y-o-Y Growth Trend Analysis by Distribution Channel, 2015-2021 7.5. Absolute $ Opportunity Analysis by Distribution Channel, 2022-2032 8. Global Market Analysis 2015–2021 and Forecast 2022–2032, By Region 8.1. Introduction / Key Findings 8.2. Historical Market Size Value (US$ Mn) & Volume (Units) Analysis by Region, 2015-2021 8.3. Current and Future Market Size Value (US$ Mn) & Volume (Units) Analysis and Forecast by Region, 2022-2032 8.3.1. North America 8.3.2. Latin America 8.3.3. Europe 8.3.4. East Asia 8.3.5. South Asia 8.3.6. Oceania 8.3.7. Middle East and Africa (MEA) 8.4. Market Attractiveness Analysis, by Region 9. North America Market Analysis 2015–2021 and Forecast 2022–2032, By Country 9.1. Historical Market Size Value (US$ Mn) & Volume (Units) Trend Analysis by Market Taxonomy, 2015-2021 9.2. Market Size Value (US$ Mn) & Volume (Units) Forecast by Market Taxonomy, 2022-2032 9.2.1. By Country 9.2.1.1. U.S. 9.2.1.2. Canada 9.2.2. By Design 9.2.3. By End Use 9.2.4. By Distribution Channel 9.3. Market Attractiveness Analysis 9.3.1. By Country 9.3.2. By Design 9.3.3. By End Use 9.3.4. By Distribution Channel 9.4. Key Takeaways 10. Latin America Market Analysis 2015–2021 and Forecast 2022–2032, By Country 10.1. Historical Market Size Value (US$ Mn) & Volume (Units) Trend Analysis by Market Taxonomy, 2015-2021 10.2. Market Size Value (US$ Mn) & Volume (Units) Forecast by Market Taxonomy, 2022-2032 10.2.1. By Country 10.2.1.1. Brazil 10.2.1.2. Mexico 10.2.1.3. Argentina 10.2.1.4. Chile 10.2.1.5. Peru 10.2.1.6. Rest of Latin America 10.2.2. By Design 10.2.3. By End Use 10.2.4. By Distribution Channel 10.3. Market Attractiveness Analysis 10.3.1. By Country 10.3.2. By Design 10.3.3. By End Use 10.3.4. By Distribution Channel 10.4. Key Takeaways 11. Europe Market Analysis 2015–2021 and Forecast 2022–2032, By Country 11.1. Historical Market Size Value (US$ Mn) & Volume (Units) Trend Analysis by Market Taxonomy, 2015-2021 11.2. Market Size Value (US$ Mn) & Volume (Units) Forecast by Market Taxonomy, 2022-2032 11.2.1. By Country 11.2.1.1. Germany 11.2.1.2. Italy 11.2.1.3. France 11.2.1.4. U.K. 11.2.1.5. Spain 11.2.1.6. BENELUX 11.2.1.7. Nordic 11.2.1.8. Russia 11.2.1.9. Poland 11.2.1.10. Rest of Europe 11.2.2. By Design 11.2.3. By End Use 11.2.4. By Distribution Channel 11.3. Market Attractiveness Analysis 11.3.1. By Country 11.3.2. By Design 11.3.3. By End Use 11.3.4. By Distribution Channel 11.4. Key Takeaways 12. East Asia Market Analysis 2015–2021 and Forecast 2022–2032, By Country 12.1. Historical Market Size Value (US$ Mn) & Volume (Units) Trend Analysis by Market Taxonomy, 2015-2021 12.2. Market Size Value (US$ Mn) & Volume (Units) Forecast by Market Taxonomy, 2022-2032 12.2.1. By Country 12.2.1.1. China 12.2.1.2. Japan 12.2.1.3. South Korea 12.2.2. By Design 12.2.3. By End Use 12.2.4. By Distribution Channel 12.3. Market Attractiveness Analysis 12.3.1. By Country 12.3.2. By Design 12.3.3. By End Use 12.3.4. By Distribution Channel 12.4. Key Takeaways 13. South Asia Market Analysis 2015–2021 and Forecast 2022–2032, By Country 13.1. Historical Market Size Value (US$ Mn) & Volume (Units) Trend Analysis by Market Taxonomy, 2015-2021 13.2. Market Size Value (US$ Mn) & Volume (Units) Forecast by Market Taxonomy, 2022-2032 13.2.1. By Country 13.2.1.1. India 13.2.1.2. Thailand 13.2.1.3. Malaysia 13.2.1.4. Indonesia 13.2.1.5. Rest of South Asia 13.2.2. By Design 13.2.3. By End Use 13.2.4. By Distribution Channel 13.3. Market Attractiveness Analysis 13.3.1. By Country 13.3.2. By Design 13.3.3. By End Use 13.3.4. By Distribution Channel 13.4. Key Takeaways 14. Oceania Market Analysis 2015–2021 and Forecast 2022–2032, By Country 14.1. Historical Market Size Value (US$ Mn) & Volume (Units) Trend Analysis by Market Taxonomy, 2015-2021 14.2. Market Size Value (US$ Mn) & Volume (Units) Forecast by Market Taxonomy, 2022-2032 14.2.1. By Country 14.2.1.1. Australia 14.2.1.2. New Zealand 14.2.2. By Design 14.2.3. By End Use 14.2.4. By Distribution Channel 14.3. Market Attractiveness Analysis 14.3.1. By Country 14.3.2. By Design 14.3.3. By End Use 14.3.4. By Distribution Channel 14.4. Key Takeaways 15. Middle East & Africa Market Analysis 2015–2021 and Forecast 2022–2032, By Country 15.1. Historical Market Size Value (US$ Mn) & Volume (Units) Trend Analysis by Market Taxonomy, 2015-2021 15.2. Market Size Value (US$ Mn) & Volume (Units) Forecast by Market Taxonomy, 2022-2032 15.2.1. By Country 15.2.1.1. GCC Countries 15.2.1.2. Turkey 15.2.1.3. Northern Africa 15.2.1.4. South Africa 15.2.1.5. Rest of MEA 15.2.2. By Design 15.2.3. By End Use 15.2.4. By Distribution Channel 15.3. Market Attractiveness Analysis 15.3.1. By Country 15.3.2. By Design 15.3.3. By End Use 15.3.4. By Distribution Channel 15.4. Key Takeaways 16. Country wise Market Analysis 16.1. United States (U.S.) 16.1.1. Market Share Analysis, 2022 16.1.2. By Design 16.1.3. By End Use 16.1.4. By Distribution Channel 16.2. Canada 16.2.1. Market Share Analysis, 2022 16.2.2. By Design 16.2.3. By End Use 16.2.4. By Distribution Channel 16.3. Brazil 16.3.1. Market Share Analysis, 2022 16.3.2. By Design 16.3.3. By End Use 16.3.4. By Distribution Channel 16.4. Mexico 16.4.1. Market Share Analysis, 2022 16.4.2. By Design 16.4.3. By End Use 16.4.4. By Distribution Channel 16.5. Germany 16.5.1. Market Share Analysis, 2022 16.5.2. By Design 16.5.3. By End Use 16.5.4. By Distribution Channel 16.6. Italy 16.6.1. Market Share Analysis, 2022 16.6.2. By Design 16.6.3. By End Use 16.6.4. By Distribution Channel 16.7. France 16.7.1. Market Share Analysis, 2022 16.7.2. By Design 16.7.3. By End Use 16.7.4. By Distribution Channel 16.8. Spain 16.8.1. Market Share Analysis, 2022 16.8.2. By Design 16.8.3. By End Use 16.8.4. By Distribution Channel 16.9. U.K. 16.9.1. Market Share Analysis, 2022 16.9.2. By Design 16.9.3. By End Use 16.9.4. By Distribution Channel 16.10. Russia 16.10.1. Market Share Analysis, 2022 16.10.2. By Design 16.10.3. By End Use 16.10.4. By Distribution Channel 16.11. China 16.11.1. Market Share Analysis, 2022 16.11.2. By Design 16.11.3. By End Use 16.11.4. By Distribution Channel 16.12. Japan 16.12.1. Market Share Analysis, 2022 16.12.2. By Design 16.12.3. By End Use 16.12.4. By Distribution Channel 16.13. India 16.13.1. Market Share Analysis, 2022 16.13.2. By Design 16.13.3. By End Use 16.13.4. By Distribution Channel 16.14. GCC Countries 16.14.1. Market Share Analysis, 2022 16.14.2. By Design 16.14.3. By End Use 16.14.4. By Distribution Channel 16.15. Australia 16.15.1. Market Share Analysis, 2022 16.15.2. By Design 16.15.3. By End Use 16.15.4. By Distribution Channel 17. Market Structure Analysis 17.1. Competition Dashboard 17.2. Competition Benchmarking 17.3. Market Share Analysis of Top Players 17.3.1. By Region 17.3.2. By Product Portfolio 18. Competition Analysis 18.1. Competition Deep Dive 18.1.1. Molded Fiber Glass Tray Company 18.1.1.1. Overview 18.1.1.2. Product Portfolio 18.1.1.3. Profitability by Market Segments (Product/Channel/Region) 18.1.1.4. Sales Footprint 18.1.1.5. Strategy Overview 18.1.1.5.1. Marketing Strategy 18.1.1.5.2. Product Strategy 18.1.1.5.3. Channel Strategy 18.1.2. VWR International, LLC. 18.1.2.1. Overview 18.1.2.2. Product Portfolio 18.1.2.3. Profitability by Market Segments (Product/Channel/Region) 18.1.2.4. Sales Footprint 18.1.2.5. Strategy Overview 18.1.2.5.1. Marketing Strategy 18.1.2.5.2. Product Strategy 18.1.2.5.3. Channel Strategy 18.1.3. ERCON Composites 18.1.3.1. Overview 18.1.3.2. Product Portfolio 18.1.3.3. Profitability by Market Segments (Product/Channel/Region) 18.1.3.4. Sales Footprint 18.1.3.5. Strategy Overview 18.1.3.5.1. Marketing Strategy 18.1.3.5.2. Product Strategy 18.1.3.5.3. Channel Strategy 18.1.4. AOCOMM Composite Co., Ltd. 18.1.4.1. Overview 18.1.4.2. Product Portfolio 18.1.4.3. Profitability by Market Segments (Product/Channel/Region) 18.1.4.4. Sales Footprint 18.1.4.5. Strategy Overview 18.1.4.5.1. Marketing Strategy 18.1.4.5.2. Product Strategy 18.1.4.5.3. Channel Strategy 18.1.5. INOXIBAR S.L. 18.1.5.1. Overview 18.1.5.2. Product Portfolio 18.1.5.3. Profitability by Market Segments (Product/Channel/Region) 18.1.5.4. Sales Footprint 18.1.5.5. Strategy Overview 18.1.5.5.1. Marketing Strategy 18.1.5.5.2. Product Strategy 18.1.5.5.3. Channel Strategy 18.1.6. Sunnex Products Limited 18.1.6.1. Overview 18.1.6.2. Product Portfolio 18.1.6.3. Profitability by Market Segments (Product/Channel/Region) 18.1.6.4. Sales Footprint 18.1.6.5. Strategy Overview 18.1.6.5.1. Marketing Strategy 18.1.6.5.2. Product Strategy 18.1.6.5.3. Channel Strategy 18.1.7. ARC INSULATIONS & INSULATORS (P) LTD. 18.1.7.1. Overview 18.1.7.2. Product Portfolio 18.1.7.3. Profitability by Market Segments (Product/Channel/Region) 18.1.7.4. Sales Footprint 18.1.7.5. Strategy Overview 18.1.7.5.1. Marketing Strategy 18.1.7.5.2. Product Strategy 18.1.7.5.3. Channel Strategy 18.1.8. General Composites 18.1.8.1. Overview 18.1.8.2. Product Portfolio 18.1.8.3. Profitability by Market Segments (Product/Channel/Region) 18.1.8.4. Sales Footprint 18.1.8.5. Strategy Overview 18.1.8.5.1. Marketing Strategy 18.1.8.5.2. Product Strategy 18.1.8.5.3. Channel Strategy 18.1.9. EvaKool 18.1.9.1. Overview 18.1.9.2. Product Portfolio 18.1.9.3. Profitability by Market Segments (Product/Channel/Region) 18.1.9.4. Sales Footprint 18.1.9.5. Strategy Overview 18.1.9.5.1. Marketing Strategy 18.1.9.5.2. Product Strategy 18.1.9.5.3. Channel Strategy 18.1.10. Enduro Composites 18.1.10.1. Overview 18.1.10.2. Product Portfolio 18.1.10.3. Profitability by Market Segments (Product/Channel/Region) 18.1.10.4. Sales Footprint 18.1.10.5. Strategy Overview 18.1.10.5.1. Marketing Strategy 18.1.10.5.2. Product Strategy 18.1.10.5.3. Channel Strategy 18.1.11. HIM SURAJ ELECTRO FIBER PVT. LTD 18.1.11.1. Overview 18.1.11.2. Product Portfolio 18.1.11.3. Profitability by Market Segments (Product/Channel/Region) 18.1.11.4. Sales Footprint 18.1.11.5. Strategy Overview 18.1.11.5.1. Marketing Strategy 18.1.11.5.2. Product Strategy 18.1.11.5.3. Channel Strategy 18.1.12. AERON COMPOSITE PVT. LTD. 18.1.12.1. Overview 18.1.12.2. Product Portfolio 18.1.12.3. Profitability by Market Segments (Product/Channel/Region) 18.1.12.4. Sales Footprint 18.1.12.5. Strategy Overview 18.1.12.5.1. Marketing Strategy 18.1.12.5.2. Product Strategy 18.1.12.5.3. Channel Strategy 19. Assumptions and Acronyms Used 20. Research Methodology
Let us know your requirement to get
100% FREE customization
List of Tables
Table 01: Global Market Value (US$ Mn) Forecast by Region, 2015-2032 Table 02: Global Market Volume (Units) Forecast by Region, 2015-2032 Table 03: Global Market Value (US$ Mn) Forecast by Design, 2015-2032 Table 04: Global Market Volume (Units) Forecast by Design, 2015-2032 Table 05: Global Market Value (US$ Mn) Forecast by End Use, 2015-2032 Table 06: Global Market Volume (Units) Forecast by End Use, 2015-2032 Table 07: Global Market Value (US$ Mn) Forecast by Distribution Channel, 2015-2032 Table 08: Global Market Volume (Units) Forecast by Distribution Channel, 2015-2032 Table 09: North America Market Value (US$ Mn) Forecast by Country, 2015-2032 Table 10: North America Market Volume (Units) Forecast by Country, 2015-2032 Table 11: North America Market Value (US$ Mn) Forecast by Design, 2015-2032 Table 12: North America Market Volume (Units) Forecast by Design, 2015-2032 Table 13: North America Market Value (US$ Mn) Forecast by End Use, 2015-2032 Table 14: North America Market Volume (Units) Forecast by End Use, 2015-2032 Table 15: North America Market Value (US$ Mn) Forecast by Distribution Channel, 2015-2032 Table 16: North America Market Volume (Units) Forecast by Distribution Channel, 2015-2032 Table 17: Latin America Market Value (US$ Mn) Forecast by Country, 2015-2032 Table 18: Latin America Market Volume (Units) Forecast by Country, 2015-2032 Table 19: Latin America Market Value (US$ Mn) Forecast by Design, 2015-2032 Table 20: Latin America Market Volume (Units) Forecast by Design, 2015-2032 Table 21: Latin America Market Value (US$ Mn) Forecast by End Use, 2015-2032 Table 22: Latin America Market Volume (Units) Forecast by End Use, 2015-2032 Table 23: Latin America Market Value (US$ Mn) Forecast by Distribution Channel, 2015-2032 Table 24: Latin America Market Volume (Units) Forecast by Distribution Channel, 2015-2032 Table 25: Europe Market Value (US$ Mn) Forecast by Country, 2015-2032 Table 26: Europe Market Volume (Units) Forecast by Country, 2015-2032 Table 27: Europe Market Value (US$ Mn) Forecast by Design, 2015-2032 Table 28: Europe Market Volume (Units) Forecast by Design, 2015-2032 Table 29: Europe Market Value (US$ Mn) Forecast by End Use, 2015-2032 Table 30: Europe Market Volume (Units) Forecast by End Use, 2015-2032 Table 31: Europe Market Value (US$ Mn) Forecast by Distribution Channel, 2015-2032 Table 32: Europe Market Volume (Units) Forecast by Distribution Channel, 2015-2032 Table 33: East Asia Market Value (US$ Mn) Forecast by Country, 2015-2032 Table 34: East Asia Market Volume (Units) Forecast by Country, 2015-2032 Table 35: East Asia Market Value (US$ Mn) Forecast by Design, 2015-2032 Table 36: East Asia Market Volume (Units) Forecast by Design, 2015-2032 Table 37: East Asia Market Value (US$ Mn) Forecast by End Use, 2015-2032 Table 38: East Asia Market Volume (Units) Forecast by End Use, 2015-2032 Table 39: East Asia Market Value (US$ Mn) Forecast by Distribution Channel, 2015-2032 Table 40: East Asia Market Volume (Units) Forecast by Distribution Channel, 2015-2032 Table 41: South Asia Market Value (US$ Mn) Forecast by Country, 2015-2032 Table 42: South Asia Market Volume (Units) Forecast by Country, 2015-2032 Table 43: South Asia Market Value (US$ Mn) Forecast by Design, 2015-2032 Table 44: South Asia Market Volume (Units) Forecast by Design, 2015-2032 Table 45: South Asia Market Value (US$ Mn) Forecast by End Use, 2015-2032 Table 46: South Asia Market Volume (Units) Forecast by End Use, 2015-2032 Table 47: South Asia Market Value (US$ Mn) Forecast by Distribution Channel, 2015-2032 Table 48: South Asia Market Volume (Units) Forecast by Distribution Channel, 2015-2032 Table 49: Oceania Market Value (US$ Mn) Forecast by Country, 2015-2032 Table 50: Oceania Market Volume (Units) Forecast by Country, 2015-2032 Table 51: Oceania Market Value (US$ Mn) Forecast by Design, 2015-2032 Table 52: Oceania Market Volume (Units) Forecast by Design, 2015-2032 Table 53: Oceania Market Value (US$ Mn) Forecast by End Use, 2015-2032 Table 54: Oceania Market Volume (Units) Forecast by End Use, 2015-2032 Table 55: Oceania Market Value (US$ Mn) Forecast by Distribution Channel, 2015-2032 Table 56: Oceania Market Volume (Units) Forecast by Distribution Channel, 2015-2032 Table 57: MEA Market Value (US$ Mn) Forecast by Country, 2015-2032 Table 58: MEA Market Volume (Units) Forecast by Country, 2015-2032 Table 59: MEA Market Value (US$ Mn) Forecast by Design, 2015-2032 Table 60: MEA Market Volume (Units) Forecast by Design, 2015-2032 Table 61: MEA Market Value (US$ Mn) Forecast by End Use, 2015-2032 Table 62: MEA Market Volume (Units) Forecast by End Use, 2015-2032 Table 63: MEA Market Value (US$ Mn) Forecast by Distribution Channel, 2015-2032 Table 64: MEA Market Volume (Units) Forecast by Distribution Channel, 2015-2032 Table 65: U.S. Market Value (US$ Mn) Forecast by Design, End Use, and Distribution Channel (2022(E) & 2032(F)) Table 66: Canada Market Value (US$ Mn) Forecast by Design, End Use, and Distribution Channel (2022(E) & 2032(F)) Table 67: Brazil Market Value (US$ Mn) Forecast by Design, End Use, and Distribution Channel (2022(E) & 2032(F)) Table 68: Mexico Market Value (US$ Mn) Forecast by Design, End Use, and Distribution Channel (2022(E) & 2032(F)) Table 69: Germany Market Value (US$ Mn) Forecast by Design, End Use, and Distribution Channel (2022(E) & 2032(F)) Table 70: Italy Market Value (US$ Mn) Forecast by Design, End Use, and Distribution Channel (2022(E) & 2032(F)) Table 71: France Market Value (US$ Mn) Forecast by Design, End Use, and Distribution Channel (2022(E) & 2032(F)) Table 72: Spain Market Value (US$ Mn) Forecast by Design, End Use, and Distribution Channel (2022(E) & 2032(F)) Table 73: U.K. Market Value (US$ Mn) Forecast by Design, End Use, and Distribution Channel (2022(E) & 2032(F)) Table 74: Russia Market Value (US$ Mn) Forecast by Design, End Use, and Distribution Channel (2022(E) & 2032(F)) Table 75: China Market Value (US$ Mn) Forecast by Design, End Use, and Distribution Channel (2022(E) & 2032(F)) Table 76: Japan Market Value (US$ Mn) Forecast by Design, End Use, and Distribution Channel (2022(E) & 2032(F)) Table 77: India Market Value (US$ Mn) Forecast by Design, End Use, and Distribution Channel (2022(E) & 2032(F)) Table 78: GCC Countries Market Value (US$ Mn) Forecast by Design, End Use, and Distribution Channel (2022(E) & 2032(F)) Table 79: Australia Market Value (US$ Mn) Forecast by Design, End Use, and Distribution Channel (2022(E) & 2032(F))
Find your sweet spots for generating winning opportunities in this market.
Talk to AnalystList of Charts
Figure 01: Global Market Value (US$ Mn) by Design, 2022-2032 Figure 02: Global Market Value (US$ Mn) by End Use, 2022-2032 Figure 03: Global Market Value (US$ Mn) by Distribution Channel, 2022-2032 Figure 04: Global Market Value (US$ Mn) by Region, 2022-2032 Figure 05: Global Market Value (US$ Mn) Analysis by Region, 2015-2021 Figure 06: Global Market Volume (Units) Analysis by Region, 2015-2032 Figure 07: Global Market Value Share (%) and BPS Analysis by Region, 2022 & 2032 Figure 08: Global Market Y-o-Y Growth (%) Projections by Region, 2022-2032 Figure 09: Global Market Value (US$ Mn) Analysis by Design, 2015-2021 Figure 10: Global Market Volume (Units) Analysis by Design, 2015-2032 Figure 11: Global Market Value Share (%) and BPS Analysis by Design, 2022 & 2032 Figure 12: Global Market Y-o-Y Growth (%) Projections by Design, 2022-2032 Figure 13: Global Market Value (US$ Mn) Analysis by End Use, 2015-2021 Figure 14: Global Market Volume (Units) Analysis by End Use, 2015-2032 Figure 15: Global Market Value Share (%) and BPS Analysis by End Use, 2022 & 2032 Figure 16: Global Market Y-o-Y Growth (%) Projections by End Use, 2022-2032 Figure 17: Global Market Value (US$ Mn) Analysis by Distribution Channel, 2015-2021 Figure 18: Global Market Volume (Units) Analysis by Distribution Channel, 2015-2032 Figure 19: Global Market Value Share (%) and BPS Analysis by Distribution Channel, 2022 & 2032 Figure 20: Global Market Y-o-Y Growth (%) Projections by Distribution Channel, 2022-2032 Figure 21: Global Market Attractiveness by Design, 2022-2032 Figure 22: Global Market Attractiveness by End Use, 2022-2032 Figure 23: Global Market Attractiveness by Distribution Channel, 2022-2032 Figure 24: Global Market Attractiveness by Distribution Channel, 2022-2032 Figure 25: Global Market Attractiveness by Region, 2022-2032 Figure 26: North America Market Value (US$ Mn) by Design, 2022-2032 Figure 27: North America Market Value (US$ Mn) by End Use, 2022-2032 Figure 28: North America Market Value (US$ Mn) by Distribution Channel, 2022-2032 Figure 29: North America Market Value (US$ Mn) by Country, 2022-2032 Figure 30: North America Market Value (US$ Mn) Analysis by Country, 2015-2021 Figure 31: North America Market Volume (Units) Analysis by Country, 2015-2032 Figure 32: North America Market Value Share (%) and BPS Analysis by Country, 2022 & 2032 Figure 33: North America Market Y-o-Y Growth (%) Projections by Country, 2022-2032 Figure 34: North America Market Value (US$ Mn) Analysis by Design, 2015-2021 Figure 35: North America Market Volume (Units) Analysis by Design, 2015-2032 Figure 36: North America Market Value Share (%) and BPS Analysis by Design, 2022 & 2032 Figure 37: North America Market Y-o-Y Growth (%) Projections by Design, 2022-2032 Figure 38: North America Market Value (US$ Mn) Analysis by End Use, 2015-2021 Figure 39: North America Market Volume (Units) Analysis by End Use, 2015-2032 Figure 40: North America Market Value Share (%) and BPS Analysis by End Use, 2022 & 2032 Figure 41: North America Market Y-o-Y Growth (%) Projections by End Use, 2022-2032 Figure 42: North America Market Value (US$ Mn) Analysis by Distribution Channel, 2015-2021 Figure 43: North America Market Volume (Units) Analysis by Distribution Channel, 2015-2032 Figure 44: North America Market Value Share (%) and BPS Analysis by Distribution Channel, 2022 & 2032 Figure 45: North America Market Y-o-Y Growth (%) Projections by Distribution Channel, 2022-2032 Figure 46: North America Market Attractiveness by Design, 2022-2032 Figure 47: North America Market Attractiveness by End Use, 2022-2032 Figure 48: North America Market Attractiveness by Distribution Channel, 2022-2032 Figure 49: North America Market Attractiveness by Country, 2022-2032 Figure 50: Latin America Market Value (US$ Mn) by Design, 2022 & 2032 Figure 51: Latin America Market Value (US$ Mn) by End Use, 2022-2032 Figure 52: Latin America Market Value (US$ Mn) by Distribution Channel, 2022-2032 Figure 53: Latin America Market Value (US$ Mn) by Country, 2022-2032 Figure 54: Latin America Market Value (US$ Mn) Analysis by Country, 2015-2021 Figure 55: Latin America Market Volume (Units) Analysis by Country, 2015-2032 Figure 56: Latin America Market Value Share (%) and BPS Analysis by Country, 2022 & 2032 Figure 57: Latin America Market Y-o-Y Growth (%) Projections by Country, 2022-2032 Figure 58: Latin America Market Value (US$ Mn) Analysis by Design, 2015-2021 Figure 59: Latin America Market Volume (Units) Analysis by Design, 2015-2032 Figure 60: Latin America Market Value Share (%) and BPS Analysis by Design, 2022 & 2032 Figure 61: Latin America Market Y-o-Y Growth (%) Projections by Design, 2022-2032 Figure 62: Latin America Market Value (US$ Mn) Analysis by End Use, 2015-2021 Figure 63: Latin America Market Volume (Units) Analysis by End Use, 2015-2032 Figure 64: Latin America Market Value Share (%) and BPS Analysis by End Use, 2022 & 2032 Figure 65: Latin America Market Y-o-Y Growth (%) Projections by End Use, 2022-2032 Figure 66: Latin America Market Value (US$ Mn) Analysis by Distribution Channel, 2015-2021 Figure 67: Latin America Market Volume (Units) Analysis by Distribution Channel, 2015-2032 Figure 68: Latin America Market Value Share (%) and BPS Analysis by Distribution Channel, 2022 & 2032 Figure 69: Latin America Market Y-o-Y Growth (%) Projections by Distribution Channel, 2022-2032 Figure 70: Latin America Market Attractiveness by Design, 2022-2032 Figure 71: Latin America Market Attractiveness by End Use, 2022-2032 Figure 72: Latin America Market Attractiveness by Distribution Channel, 2022-2032 Figure 73: Latin America Market Attractiveness by Country, 2022-2032 Figure 74: Europe Market Value (US$ Mn) by Design, 2022-2032 Figure 75: Europe Market Value (US$ Mn) by End Use, 2022-2032 Figure 76: Europe Market Value (US$ Mn) by Distribution Channel, 2022-2032 Figure 77: Europe Market Value (US$ Mn) by Country, 2022-2032 Figure 78: Europe Market Value (US$ Mn) Analysis by Country, 2015-2021 Figure 79: Europe Market Volume (Units) Analysis by Country, 2015-2032 Figure 80: Europe Market Value Share (%) and BPS Analysis by Country, 2022 & 2032 Figure 81: Europe Market Y-o-Y Growth (%) Projections by Country, 2022-2032 Figure 82: Europe Market Value (US$ Mn) Analysis by Design, 2015-2021 Figure 83: Europe Market Volume (Units) Analysis by Design, 2015-2032 Figure 84: Europe Market Value Share (%) and BPS Analysis by Design, 2022 & 2032 Figure 85: Europe Market Y-o-Y Growth (%) Projections by Design, 2022-2032 Figure 86: Europe Market Value (US$ Mn) Analysis by End Use, 2015-2021 Figure 87: Europe Market Volume (Units) Analysis by End Use, 2015-2032 Figure 88: Europe Market Value Share (%) and BPS Analysis by End Use, 2022 & 2032 Figure 89: Europe Market Y-o-Y Growth (%) Projections by End Use, 2022-2032 Figure 90: Europe Market Value (US$ Mn) Analysis by Distribution Channel, 2015-2021 Figure 91: Europe Market Volume (Units) Analysis by Distribution Channel, 2015-2032 Figure 92: Europe Market Value Share (%) and BPS Analysis by Distribution Channel, 2022 & 2032 Figure 93: Europe Market Y-o-Y Growth (%) Projections by Distribution Channel, 2022-2032 Figure 94: Europe Market Attractiveness by Design, 2022-2032 Figure 95: Europe Market Attractiveness by End Use, 2022-2032 Figure 96: Europe Market Attractiveness by Distribution Channel, 2022-2032 Figure 97: Europe Market Attractiveness by Country, 2022-2032 Figure 98: East Asia Market Value (US$ Mn) by Design, 2022-2032 Figure 99: East Asia Market Value (US$ Mn) by End Use, 2022-2032 Figure 100: East Asia Market Value (US$ Mn) by Distribution Channel, 2022-2032 Figure 101: East Asia Market Value (US$ Mn) by Country, 2022-2032 Figure 102: East Asia Market Value (US$ Mn) Analysis by Country, 2015-2021 Figure 103: East Asia Market Volume (Units) Analysis by Country, 2015-2032 Figure 104: East Asia Market Value Share (%) and BPS Analysis by Country, 2022 & 2032 Figure 105: East Asia Market Y-o-Y Growth (%) Projections by Country, 2022-2032 Figure 106: East Asia Market Value (US$ Mn) Analysis by Design, 2015-2021 Figure 107: East Asia Market Volume (Units) Analysis by Design, 2015-2032 Figure 108: East Asia Market Value Share (%) and BPS Analysis by Design, 2022 & 2032 Figure 109: East Asia Market Y-o-Y Growth (%) Projections by Design, 2022-2032 Figure 110: East Asia Market Value (US$ Mn) Analysis by End Use, 2015-2021 Figure 111: East Asia Market Volume (Units) Analysis by End Use, 2015-2032 Figure 112: East Asia Market Value Share (%) and BPS Analysis by End Use, 2022 & 2032 Figure 113: East Asia Market Y-o-Y Growth (%) Projections by End Use, 2022-2032 Figure 114: East Asia Market Value (US$ Mn) Analysis by Distribution Channel, 2015-2021 Figure 115: East Asia Market Volume (Units) Analysis by Distribution Channel, 2015-2032 Figure 116: East Asia Market Value Share (%) and BPS Analysis by Distribution Channel, 2022 & 2032 Figure 117: East Asia Market Y-o-Y Growth (%) Projections by Distribution Channel, 2022-2032 Figure 118: East Asia Market Attractiveness by Design, 2022-2032 Figure 119: East Asia Market Attractiveness by End Use, 2022-2032 Figure 120: East Asia Market Attractiveness by Distribution Channel, 2022-2032 Figure 121: East Asia Market Attractiveness by Country, 2022-2032 Figure 122: South Asia Market Value (US$ Mn) by Design, 2022-2032 Figure 123: South Asia Market Value (US$ Mn) by End Use, 2022-2032 Figure 124: South Asia Market Value (US$ Mn) by Distribution Channel, 2022-2032 Figure 125: South Asia Market Value (US$ Mn) by Country, 2022-2032 Figure 126: South Asia Market Value (US$ Mn) Analysis by Country, 2015-2021 Figure 127: South Asia Market Volume (Units) Analysis by Country, 2015-2032 Figure 128: South Asia Market Value Share (%) and BPS Analysis by Country, 2022 & 2032 Figure 129: South Asia Market Y-o-Y Growth (%) Projections by Country, 2022-2032 Figure 130: South Asia Market Value (US$ Mn) Analysis by Design, 2015-2021 Figure 131: South Asia Market Volume (Units) Analysis by Design, 2015-2032 Figure 132: South Asia Market Value Share (%) and BPS Analysis by Design, 2022 & 2032 Figure 133: South Asia Market Y-o-Y Growth (%) Projections by Design, 2022-2032 Figure 134: South Asia Market Value (US$ Mn) Analysis by End Use, 2015-2021 Figure 135: South Asia Market Volume (Units) Analysis by End Use, 2015-2032 Figure 136: South Asia Market Value Share (%) and BPS Analysis by End Use, 2022 & 2032 Figure 137: South Asia Market Y-o-Y Growth (%) Projections by End Use, 2022-2032 Figure 138: South Asia Market Value (US$ Mn) Analysis by Distribution Channel, 2015-2021 Figure 139: South Asia Market Volume (Units) Analysis by Distribution Channel, 2015-2032 Figure 140: South Asia Market Value Share (%) and BPS Analysis by Distribution Channel, 2022 & 2032 Figure 141: South Asia Market Y-o-Y Growth (%) Projections by Distribution Channel, 2022-2032 Figure 142: South Asia Market Attractiveness by Design, 2022-2032 Figure 143: South Asia Market Attractiveness by End Use, 2022-2032 Figure 144: South Asia Market Attractiveness by Distribution Channel, 2022-2032 Figure 145: South Asia Market Attractiveness by Country, 2022-2032 Figure 146: Oceania Market Value (US$ Mn) by Design, 2022-2032 Figure 147: Oceania Market Value (US$ Mn) by End Use, 2022-2032 Figure 148: Oceania Market Value (US$ Mn) by Distribution Channel, 2022-2032 Figure 149: Oceania Market Value (US$ Mn) by Country, 2022-2032 Figure 150: Oceania Market Value (US$ Mn) Analysis by Country, 2015-2021 Figure 151: Oceania Market Volume (Units) Analysis by Country, 2015-2032 Figure 152: Oceania Market Value Share (%) and BPS Analysis by Country, 2022 & 2032 Figure 153: Oceania Market Y-o-Y Growth (%) Projections by Country, 2022-2032 Figure 154: Oceania Market Value (US$ Mn) Analysis by Design, 2015-2021 Figure 155: Oceania Market Volume (Units) Analysis by Design, 2015-2032 Figure 156: Oceania Market Value Share (%) and BPS Analysis by Design, 2022 & 2032 Figure 157: Oceania Market Y-o-Y Growth (%) Projections by Design, 2022-2032 Figure 158: Oceania Market Value (US$ Mn) Analysis by End Use, 2015-2021 Figure 159: Oceania Market Volume (Units) Analysis by End Use, 2015-2032 Figure 160: Oceania Market Value Share (%) and BPS Analysis by End Use, 2022 & 2032 Figure 161: Oceania Market Y-o-Y Growth (%) Projections by End Use, 2022-2032 Figure 162: Oceania Market Value (US$ Mn) Analysis by Distribution Channel, 2015-2021 Figure 163: Oceania Market Volume (Units) Analysis by Distribution Channel, 2015-2032 Figure 164: Oceania Market Value Share (%) and BPS Analysis by Distribution Channel, 2022 & 2032 Figure 165: Oceania Market Y-o-Y Growth (%) Projections by Distribution Channel, 2022-2032 Figure 166: Oceania Market Attractiveness by Design, 2022-2032 Figure 167: Oceania Market Attractiveness by End Use, 2022-2032 Figure 168: Oceania Market Attractiveness by Distribution Channel, 2022-2032 Figure 169 Oceania Market Attractiveness by Country, 2022-2032 Figure 170: MEA Market Value (US$ Mn) by Design, 2022-2032 Figure 171: MEA Market Value (US$ Mn) by End Use, 2022-2032 Figure 172: MEA Market Value (US$ Mn) by Distribution Channel, 2022-2032 Figure 173: MEA Market Value (US$ Mn) by Country, 2022-2032 Figure 174: MEA Market Value (US$ Mn) Analysis by Country, 2015-2021 Figure 175: MEA Market Volume (Units) Analysis by Country, 2015-2032 Figure 176: MEA Market Value Share (%) and BPS Analysis by Country, 2022 & 2032 Figure 177: MEA Market Y-o-Y Growth (%) Projections by Country, 2022-2032 Figure 178: MEA Market Value (US$ Mn) Analysis by Design, 2015-2021 Figure 179: MEA Market Volume (Units) Analysis by Design, 2015-2032 Figure 180: MEA Market Value Share (%) and BPS Analysis by Design, 2022 & 2032 Figure 181: MEA Market Y-o-Y Growth (%) Projections by Design, 2022-2032 Figure 182: MEA Market Value (US$ Mn) Analysis by End Use, 2015-2021 Figure 183: MEA Market Volume (Units) Analysis by End Use, 2015-2032 Figure 184: MEA Market Value Share (%) and BPS Analysis by End Use, 2022 & 2032 Figure 185: MEA Market Y-o-Y Growth (%) Projections by End Use, 2022-2032 Figure 186: MEA Market Value (US$ Mn) Analysis by Distribution Channel, 2015-2021 Figure 187: MEA Market Volume (Units) Analysis by Distribution Channel, 2015-2032 Figure 188: MEA Market Value Share (%) and BPS Analysis by Distribution Channel, 2022 & 2032 Figure 189: MEA Market Y-o-Y Growth (%) Projections by Distribution Channel, 2022-2032 Figure 190: MEA Market Attractiveness by Design, 2022-2032 Figure 191: MEA Market Attractiveness by End Use, 2022-2032 Figure 192: MEA Market Attractiveness by Distribution Channel, 2022-2032 Figure 193 MEA Market Attractiveness by Country, 2022-2032
Need specific information?
Request CustomizationExplore Packaging Insights
View Reports