Dispensing Trays Market Size and Share Forecast Outlook 2025 to 2035

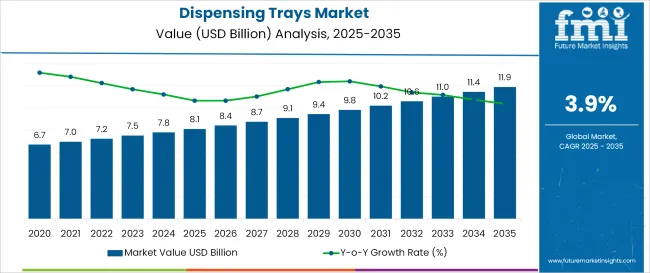
The dispensing trays market is projected to grow from USD 8.1 billion in 2025 to USD 11.9 billion by 2035, registering a CAGR of 3.9% during the forecast period. Sales in 2024 reached USD 7.7 billion. Growth has been driven by widespread usage across healthcare, diagnostics, dental, and pharmaceutical sectors, along with retail demand for precision dispensing in organized formats.
Quick Stats - Dispensing Trays Market

  • Value of Market (2025): USD 8.1 billion
  • Projected Value Market (2035): USD 11.9 billion
  • Forecast CAGR Market (2025 to 2035): 3.9%
  • Largest Material Type Market: Plastic (41.2%)
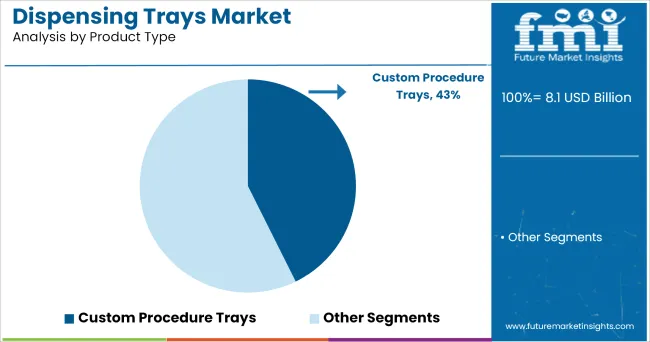
  • Largest Product Type in Market: Custom Procedure Trays (43%)
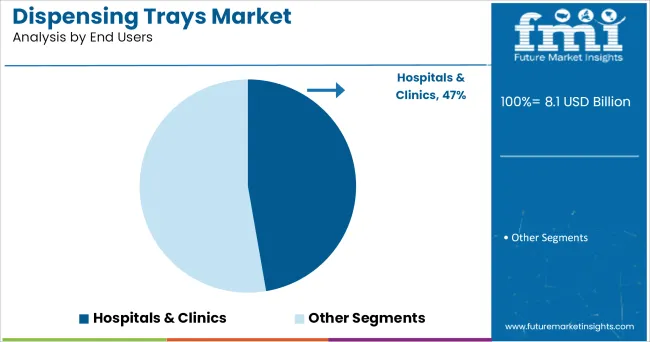
  • Leading End-user Segment: Hospitals & Clinics (47%)
  • Top Player by 2025 Revenue: Oliver Healthcare Packaging (32%)

Dispensing Trays Market

Metric Value
Market Size (2025E) USD 8.1 billion
Market Value (2035F) USD 11.9 billion
CAGR (2025 to 2035) 3.9%

The dispensing trays market is projected to expand at a modest pace through 2035, driven by institutional procurement from hospitals, diagnostic labs, and surgical centers. Tray systems designed for pre-packed, sterile procedures continue to see uptake as healthcare providers standardize infection control and reduce setup time.

While plastics remain the dominant material due to ease of molding and cost efficiency, pressure from waste regulations is nudging procurement teams toward recyclable and biodegradable options. End users increasingly prefer customized tray assemblies that align with procedure-specific needs and lean inventory models.

Analyzing Dispensing Trays Market by Top Investment Segment

The market is segmented based on material type, product type, end users, and region. By material type, the market includes metal, paperboard, glass, biodegradable materials, and plastic-comprising polypropylene (PP), polystyrene (PS), polyvinyl chloride (PVC), high-density polyethylene (HDPE), and others.

In terms of product type, the market is categorized into custom procedure trays, first aid procedure trays, medicine dispenser trays, diagnostic and procedure trays, RFID-enabled smart trays, and others. By end users, the market comprises hospitals & clinics, medical institutions, food & beverage, cosmetics & personal care, and others. Regionally, the market is analyzed across North America, Latin America, East Asia, South Asia & Pacific, Eastern Europe, Western Europe, Oceania, and the Middle East & Africa.

By Material Type: Plastic Leads with 41.2% Share in 2025

Plastic remains the dominant material in the dispensing trays market, accounting for 41.2% of global revenue in 2025. Its cost efficiency, moldability, and compatibility with sterile packaging standards give it a functional edge over other substrates. Healthcare procurement favors plastics like PP and PS for their strength-to-weight ratio and clarity.

Demand is driven by institutional buyers prioritizing infection control, but growing environmental regulations act as a constraint, especially in the EU and parts of North America. Procurement officers in public hospitals increasingly factor in recyclability when tendering bulk orders.

The hidden disruptor lies in biodegradable plastics, projected to account for a small but growing portion of procurement tenders by 2030. Early adoption in Japan and Germany has triggered pilot-scale sourcing contracts, with cost markups ranging from 8%-15% over conventional trays.
  • Regulatory focus on single-use plastic minimization
  • Shelf-life and heat resistance vary widely across polymers
  • Limited availability of biodegradable trays in developing markets

By Product Type: Custom Procedure Trays Hold 43% Share in 2025

Dispensing Trays Market Analysis By Product Type

Custom procedure trays lead the product category with a 43% share in 2025, owing to their role in optimizing surgical efficiency and compliance. These trays are pre-configured for specific medical interventions, reducing prep time and minimizing instrument errors across high-throughput facilities.

Their uptake is driven by procurement trends favoring bundled solutions for repeat procedures such as orthopedic, cardiac, and diagnostic interventions. However, the upfront cost and supply rigidity in bulk ordering cycles present challenges for smaller clinics and mobile care providers.

A latent disruptor is the rise of RFID-enabled smart trays, now entering early-stage pilots in USA ambulatory centers. Though adoption remains below 2%, traceability features have reduced post-op material loss by 12% in test facilities, prompting attention from hospital chains aiming to standardize inventory.
  • Strong preference among surgical centers for pre-packed formats
  • Limited flexibility for emergency or hybrid procedures
  • RFID adoption still constrained by software-hardware integration costs

By End User: Hospitals & Clinics Dominate with 47% Share in 2025

Dispensing Trays Market Analysis By End Users

Hospitals and clinics are set to account for 47% of the global dispensing trays market in 2025, anchored by bulk procurement systems and infection control mandates. Their reliance on pre-sterilized, single-use trays ensures procedural uniformity and aligns with quality audits across surgical, diagnostic, and emergency care.

Demand is reinforced by rising day-care surgeries and expanded diagnostic services in secondary cities. However, procurement cycles are often budget-tied and delay transitions to biodegradable or tech-integrated tray systems. Non-hospital settings-such as outpatient labs and home healthcare providers-are gaining relevance but remain secondary in absolute volume.

An underexplored shift is visible in food service and personal care clinics repurposing medical-style trays for hygiene-controlled dispensing. Though these non-medical applications form a small share, they have posted 5-7% annual growth in select Southeast Asian markets, creating potential for volume spillover.
  • Public tenders dominate institutional tray contracts
  • Budget constraints slow shift toward sustainable options
  • Cross-sector repurposing expanding in non-clinical settings

Acrylic Boxes Market Analysis by Top Countries

Dispensing Trays Market Cagr Analysis By Country

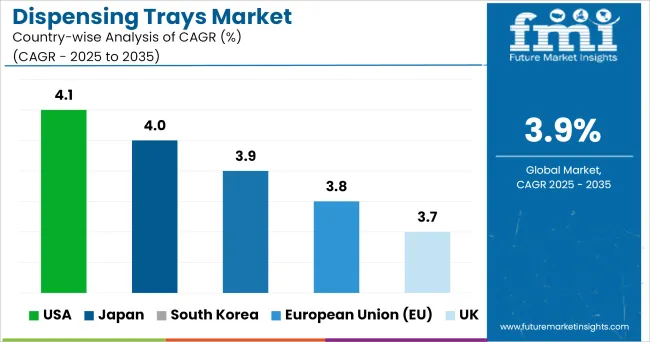
The dispensing trays market shows steady, healthcare-led growth across key economies, shaped by procurement structures, regulatory stringency, and procedural volumes. In the United States, strong institutional spending and integration of smart tray systems anchor long-term demand. The European Union remains committed to standardized tray protocols, though recyclability mandates are beginning to reshape supplier qualifications. Japan’s aging population is sustaining demand through high-frequency diagnostics and surgical interventions, while its early experimentation with biodegradable trays sets it apart.

South Korea continues to mirror Japanese trends but places stronger emphasis on modular tray formats suited for compact clinical environments. Meanwhile, the United Kingdom is pursuing leaner procurement frameworks in the NHS, with centralized sourcing that prioritizes safety compliance over customization. These five economies are expected to account for the bulk of absolute dollar growth through 2035, with shifting material preferences and end-user consolidation shaping the competitive field.

United States - Institutional Tray Procurement Outlook

The USA dispensing trays market is projected to grow at a CAGR of 4.1% from 2025 to 2035. Growth is anchored in the dominance of group purchasing organizations (GPOs) and integrated delivery networks (IDNs), which increasingly bundle procedure-specific trays into long-term contracts. High-volume surgical centers continue to prefer disposable tray systems for compliance and workflow efficiency.

Demand for RFID-enabled trays is gaining traction within hospital chains, reflecting a broader shift toward digital inventory traceability. Regulatory oversight around sterile packaging is pushing vendors to offer verifiable barrier standards, solidifying competitive thresholds.

Japan - Aging Demographics Drive Tray Customization

Japan’s dispensing trays market is expected to expand at a CAGR of 4.0% over the forecast period. With one of the highest procedural frequencies per capita globally, hospitals prioritize ready-to-use trays tailored to geriatric care. Procurement teams emphasize compact, multi-use formats that can withstand humid storage conditions and deliver thermal stability.

Long-standing policy incentives for single-use medical disposables continue to shape tray configurations. Early-stage adoption of biodegradable tray formats-especially in diagnostics-is quietly influencing supplier rotations across mid-sized regional clinics.

South Korea - Modular Configurations Gain Momentum

The dispensing trays market in South Korea is forecast to grow at a CAGR of 3.9% through 2035. The country’s healthcare system favors modular tray systems designed for space-limited urban clinics. Demand is shifting from rigid, pre-filled kits toward semi-customizable units that align with lean staffing models.

Government-backed innovation funds have enabled local suppliers to trial RFID tray variants in tertiary care hospitals, albeit at limited scale. A preference for durable plastics over eco-materials reflects cost sensitivity, but regulatory nudges around medical waste handling are starting to influence product selection.

European Union - Tray Sourcing Shaped by Material Mandates

Across the EU, the dispensing trays market is projected to grow at a CAGR of 3.8% between 2025 and 2035. The region’s unified procurement guidelines increasingly link public tenders to recyclability and material traceability thresholds.

Hospitals in Western Europe exhibit strong bias toward paperboard-backed trays in outpatient care, while Eastern Europe continues to rely on cost-effective plastic variants. Institutional buyers favor vendors offering compliance documentation aligned with MDR and CE markings. Innovation is concentrated in Northern Europe, where cross-functional tray kits for multi-step diagnostics are being piloted.

United Kingdom - NHS Procurement Restructures Product Mix

The UK dispensing trays market is set to grow at a CAGR of 3.7% over the next decade. NHS-driven frameworks have centralized tray sourcing, resulting in greater standardization but reduced variety across end users. There is growing institutional demand for procedure-specific kits tailored for mobile diagnostic units and community care programs.

Local suppliers struggle to meet rising expectations around compostable and recyclable substrates, prompting an influx of EU-based alternatives. Infection control remains the core procurement driver, but cost-per-procedure optimization has become a leading secondary filter.
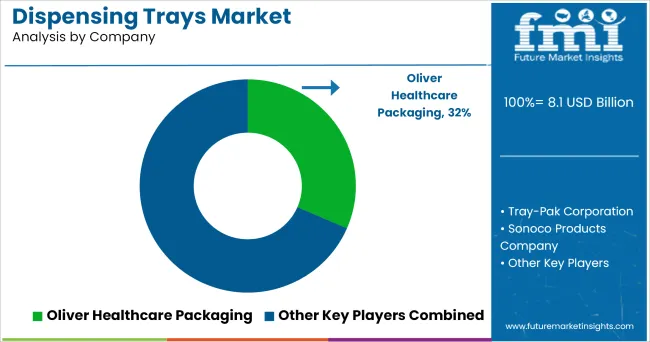
Dispensing Trays Market Players and their Strategies

Dispensing Trays Market Analysis By Company

The leading players in the dispensing trays market are focusing on sterile barrier innovations, bulk institutional supply contracts, and portfolio expansion into RFID-integrated formats. Companies such as Oliver Healthcare Packaging and Thermo Fisher Scientific are scaling global production while aligning tray offerings with regional sterilization standards.

These Tier 1 firms operate under multi-year procurement agreements with hospital networks, giving them pricing leverage and first-mover access to regulatory pilot programs. Their focus remains on high-margin, procedure-specific kits that reduce hospital workload and meet traceability demands.

Tier 2 players-including Tray-Pak Corporation, Placon Corporation, and Rohrer Corporation-compete on design flexibility and mid-volume customization, often serving outpatient clinics and diagnostic chains. While they lack global manufacturing footprints, these companies are agile in adapting to non-standard tray needs and have stronger regional supply resilience. Many are now building partnerships with local recyclers to align with evolving material compliance thresholds in the EU and Japan.

Startup participation in this space remains limited due to high tooling costs and sterilization barriers. However, a few emerging players in South Korea and Germany are introducing niche, biodegradable tray formats and digitized inventory-ready kits. These entrants focus on lean manufacturing and cloud-linked tracking tags, though scalability remains a constraint. First-movers in smart tray subcategories may find licensing opportunities with larger players through 2035.

Report Scope

Metric Details
Current Total Market Size (2025) USD 8.1 billion
Projected Market Size (2035) USD 11.9 billion
CAGR (2025 to 2035) 3.9%
Base Year 2025
Forecast Period 2025 to 2035
Historical Coverage 2020 to 2024
Units USD Billion (Value), Units (Volume)
Segmentation By Material Type; By Product Type; By End Users; By Region
Material Type Segments Metal; Paperboard; Glass; Biodegradable Materials; Plastic; PP; PS; PVC; HDPE; Others
Product Type Segments Custom Procedure Trays; First Aid Procedure Trays; Medicine Dispenser Trays; Diagnostic and Procedure Trays; RFID-enabled Smart Trays; Others
End User Segments Hospitals & Clinics; Medical Institutions; Food & Beverage; Cosmetics & Personal Care; Others
Regional Coverage North America, Latin America, Europe, East Asia, South Asia, Oceania, Middle East & Africa
Country Coverage USA, Canada, UK, Germany, France, Italy, Japan, South Korea, China, India, GCC, ANZ, among others
Key Players Oliver Healthcare Packaging, Thermo Fisher Scientific, Sonoco Products Company, Tray-Pak Corporation, Placon Corporation, Rohrer Corporation, West Pharmaceutical Services, Medline Industries, Nelipak Healthcare Packaging, Becton, Dickinson and Company
Additional Attributes Pricing Analysis, Supply Chain, Regulatory Overview, Import/Export Trends, Opportunity Mapping

Key Segmentation

By Material Type:

  • Metal
  • Paperboard
  • Glass
  • Biodegradable Materials
  • Plastic
  • Polypropylene (PP)
  • Polystyrene (PS)
  • Polyvinyl Chloride (PVC)
  • High-Density Polyethylene (HDPE)
  • Others

By Product Type:

  • Custom Procedure Trays
  • First Aid Procedure Trays
  • Medicine Dispenser Trays
  • Diagnostic and Procedure Trays
  • RFID-Enabled Smart Trays
  • Others

By End Users:

  • Hospitals &Clinics
  • Medical Institution
  • Food & Beverage
  • Cosmetics & Personal Care
  • Others

By Region:

  • North America
  • Latin America
  • Western Europe
  • Eastern Europe
  • East Asia
  • South Asia & Pacific
  • Middle East and Africa

Table of Content

  1. Executive Summary
    • Global Market Outlook
    • Demand-side Trends
    • Supply-side Trends
    • Technology Roadmap Analysis
    • Analysis and Recommendations
  2. Market Overview
    • Market Coverage / Taxonomy
    • Market Definition / Scope / Limitations
  3. Market Background
    • Market Dynamics
      • Drivers
      • Restraints
      • Opportunity
      • Trends
    • Scenario Forecast
      • Demand in Optimistic Scenario
      • Demand in Likely Scenario
      • Demand in Conservative Scenario
    • Opportunity Map Analysis
    • Product Life Cycle Analysis
    • Supply Chain Analysis
      • Supply Side Participants and their Roles
        • Producers
        • Mid-Level Participants (Traders/ Agents/ Brokers)
        • Wholesalers and Distributors
      • Value Added and Value Created at Node in the Supply Chain
      • List of Raw Material Suppliers
      • List of Existing and Potential Buyer’s
    • Investment Feasibility Matrix
    • Value Chain Analysis
      • Profit Margin Analysis
      • Wholesalers and Distributors
      • Retailers
    • PESTLE and Porter’s Analysis
    • Regulatory Landscape
      • By Key Regions
      • By Key Countries
    • Regional Parent Market Outlook
    • Production and Consumption Statistics
    • Import and Export Statistics
  4. Global Market Analysis 2020 to 2024 and Forecast, 2025 to 2035
    • Historical Market Size Value (USD Billion) & Volume (Units) Analysis, 2020 to 2024
    • Current and Future Market Size Value (USD Billion) & Volume (Units) Projections, 2025 to 2035
      • Y-o-Y Growth Trend Analysis
      • Absolute $ Opportunity Analysis
  5. Global Market Pricing Analysis 2020 to 2024 and Forecast 2025 to 2035
  6. Global Market Analysis 2020 to 2024 and Forecast 2025 to 2035, By Material Type
    • Introduction / Key Findings
    • Historical Market Size Value (USD Billion) & Volume (Units) Analysis By Material Type, 2020 to 2024
    • Current and Future Market Size Value (USD Billion) & Volume (Units) Analysis and Forecast By Material Type, 2025 to 2035
      • Metal
      • Paperboard
      • Glass
      • Biodegradable Materials
      • Plastic
        • Polypropylene (PP)
        • Polystyrene (PS)
        • Polyvinyl Chloride (PVC)
        • High-Density Polyethylene (HDPE)
        • Others
    • Y-o-Y Growth Trend Analysis By Material Type, 2020 to 2024
    • Absolute $ Opportunity Analysis By Material Type, 2025 to 2035
  7. Global Market Analysis 2020 to 2024 and Forecast 2025 to 2035, By Product Type
    • Introduction / Key Findings
    • Historical Market Size Value (USD Billion) & Volume (Units) Analysis By Product Type, 2020 to 2024
    • Current and Future Market Size Value (USD Billion) & Volume (Units) Analysis and Forecast By Product Type, 2025 to 2035
      • Custom Procedure Trays
      • First Aid Procedure Trays
      • Medicine Dispenser Trays
      • Diagnostic and Procedure Trays
      • RFID-Enabled Smart Trays
      • Others
    • Y-o-Y Growth Trend Analysis By Product Type, 2020 to 2024
    • Absolute $ Opportunity Analysis By Product Type, 2025 to 2035
  8. Global Market Analysis 2020 to 2024 and Forecast 2025 to 2035, By End Users
    • Introduction / Key Findings
    • Historical Market Size Value (USD Billion) & Volume (Units) Analysis By End Users, 2020 to 2024
    • Current and Future Market Size Value (USD Billion) & Volume (Units) Analysis and Forecast By End Users, 2025 to 2035
      • Hospitals & Clinics
      • Medical Institution
      • Food & Beverage
      • Cosmetics & Personal Care
      • Others
    • Y-o-Y Growth Trend Analysis By End Users, 2020 to 2024
    • Absolute $ Opportunity Analysis By End Users, 2025 to 2035
  9. Global Market Analysis 2020 to 2024 and Forecast 2025 to 2035, By Region
    • Introduction
    • Historical Market Size Value (USD Billion) & Volume (Units) Analysis By Region, 2020 to 2024
    • Current Market Size Value (USD Billion) & Volume (Units) Analysis and Forecast By Region, 2025 to 2035
      • North America
      • Latin America
      • Western Europe
      • Eastern Europe
      • East Asia
      • South Asia & Pacific
      • Middle East and Africa
    • Market Attractiveness Analysis By Region
  10. North America Market Analysis 2020 to 2024 and Forecast 2025 to 2035, By Country
    • Historical Market Size Value (USD Billion) & Volume (Units) Trend Analysis By Market Taxonomy, 2020 to 2024
    • Market Size Value (USD Billion) & Volume (Units) Forecast By Market Taxonomy, 2025 to 2035
      • By Country
        • USA
        • Canada
        • Mexico
      • By Material Type
      • By Product Type
      • By End Users
    • Market Attractiveness Analysis
      • By Country
      • By Material Type
      • By Product Type
      • By End Users
    • Key Takeaways
  11. Latin America Market Analysis 2020 to 2024 and Forecast 2025 to 2035, By Country
    • Historical Market Size Value (USD Billion) & Volume (Units) Trend Analysis By Market Taxonomy, 2020 to 2024
    • Market Size Value (USD Billion) & Volume (Units) Forecast By Market Taxonomy, 2025 to 2035
      • By Country
        • Brazil
        • Argentina
        • Rest of LATAM
      • By Material Type
      • By Product Type
      • By End Users
    • Market Attractiveness Analysis
      • By Country
      • By Material Type
      • By Product Type
      • By End Users
    • Key Takeaways
  12. Western Europe Market Analysis 2020 to 2024 and Forecast 2025 to 2035, By Country
    • Historical Market Size Value (USD Billion) & Volume (Units) Trend Analysis By Market Taxonomy, 2020 to 2024
    • Market Size Value (USD Billion) & Volume (Units) Forecast By Market Taxonomy, 2025 to 2035
      • By Country
        • Germany
        • Italy
        • France
        • UK
        • Spain
        • BENELUX
        • Nordic
        • Rest of W.Europe
      • By Material Type
      • By Product Type
      • By End Users
    • Market Attractiveness Analysis
      • By Country
      • By Material Type
      • By Product Type
      • By End Users
    • Key Takeaways
  13. Eastern Europe Market Analysis 2020 to 2024 and Forecast 2025 to 2035, By Country
    • Historical Market Size Value (USD Billion) & Volume (Units) Trend Analysis By Market Taxonomy, 2020 to 2024
    • Market Size Value (USD Billion) & Volume (Units) Forecast By Market Taxonomy, 2025 to 2035
      • By Country
        • Russia
        • Hungary
        • Poland
        • Balkan & Baltics
        • Rest of E. Europe
      • By Material Type
      • By Product Type
      • By End Users
    • Market Attractiveness Analysis
      • By Country
      • By Material Type
      • By Product Type
      • By End Users
    • Key Takeaways
  14. East Asia Market Analysis 2020 to 2024 and Forecast 2025 to 2035, By Country
    • Historical Market Size Value (USD Billion) & Volume (Units) Trend Analysis By Market Taxonomy, 2020 to 2024
    • Market Size Value (USD Billion) & Volume (Units) Forecast By Market Taxonomy, 2025 to 2035
      • By Country
        • China
        • Japan
        • South Korea
      • By Material Type
      • By Product Type
      • By End Users
    • Market Attractiveness Analysis
      • By Country
      • By Material Type
      • By Product Type
      • By End Users
    • Key Takeaways
  15. South Asia & Pacific Market Analysis 2020 to 2024 and Forecast 2025 to 2035, By Country
    • Historical Market Size Value (USD Billion) & Volume (Units) Trend Analysis By Market Taxonomy, 2020 to 2024
    • Market Size Value (USD Billion) & Volume (Units) Forecast By Market Taxonomy, 2025 to 2035
      • By Country
        • India
        • Australia & New Zealand
        • ASEAN
        • Rest of SAP
      • By Material Type
      • By Product Type
      • By End Users
    • Market Attractiveness Analysis
      • By Country
      • By Material Type
      • By Product Type
      • By End Users
    • Key Takeaways
  16. Middle East and Africa Market Analysis 2020 to 2024 and Forecast 2025 to 2035, By Country
    • Historical Market Size Value (USD Billion) & Volume (Units) Trend Analysis By Market Taxonomy, 2020 to 2024
    • Market Size Value (USD Billion) & Volume (Units) Forecast By Market Taxonomy, 2025 to 2035
      • By Country
        • GCC Countries
        • Northern Africa
        • South Africa
        • Turkiye
        • Rest of MEA
      • By Material Type
      • By Product Type
      • By End Users
    • Market Attractiveness Analysis
      • By Country
      • By Material Type
      • By Product Type
      • By End Users
    • Key Takeaways
  17. Key Countries Market Analysis
    • USA
      • Pricing Analysis
      • Market Share Analysis, 2024
        • By Material Type
        • By Product Type
        • By End Users
    • Canada
      • Pricing Analysis
      • Market Share Analysis, 2024
        • By Material Type
        • By Product Type
        • By End Users
    • Brazil
      • Pricing Analysis
      • Market Share Analysis, 2024
        • By Material Type
        • By Product Type
        • By End Users
    • Mexico
      • Pricing Analysis
      • Market Share Analysis, 2024
        • By Material Type
        • By Product Type
        • By End Users
    • Argentina
      • Pricing Analysis
      • Market Share Analysis, 2024
        • By Material Type
        • By Product Type
        • By End Users
  18. Market Structure Analysis
    • Competition Dashboard
    • Competition Benchmarking
    • Market Share Analysis of Top Players
      • By Regional
      • By Material Type
      • By Product Type
      • By End Users
  19. Competition Analysis
    • Competition Deep Dive
      • Nelipak Healthcare Packaging
        • Overview
        • Product Portfolio
        • Profitability by Market Segments (Product/Age /Sales Channel/Region)
        • Sales Footprint
        • Strategy Overview
          • Marketing Strategy
          • Product Strategy
          • Channel Strategy
      • Becton, Dickinson and Company
        • Overview
        • Product Portfolio
        • Profitability by Market Segments (Product/Age /Sales Channel/Region)
        • Sales Footprint
        • Strategy Overview
          • Marketing Strategy
          • Product Strategy
          • Channel Strategy
      • Medline Industries, LP
        • Overview
        • Product Portfolio
        • Profitability by Market Segments (Product/Age /Sales Channel/Region)
        • Sales Footprint
        • Strategy Overview
          • Marketing Strategy
          • Product Strategy
          • Channel Strategy
      • West Pharmaceutical Services
        • Overview
        • Product Portfolio
        • Profitability by Market Segments (Product/Age /Sales Channel/Region)
        • Sales Footprint
        • Strategy Overview
          • Marketing Strategy
          • Product Strategy
          • Channel Strategy
      • Placon Corporation
        • Overview
        • Product Portfolio
        • Profitability by Market Segments (Product/Age /Sales Channel/Region)
        • Sales Footprint
        • Strategy Overview
          • Marketing Strategy
          • Product Strategy
          • Channel Strategy
      • Oliver Healthcare Packaging
        • Overview
        • Product Portfolio
        • Profitability by Market Segments (Product/Age /Sales Channel/Region)
        • Sales Footprint
        • Strategy Overview
          • Marketing Strategy
          • Product Strategy
          • Channel Strategy
      • Tray-Pak Corporation
        • Overview
        • Product Portfolio
        • Profitability by Market Segments (Product/Age /Sales Channel/Region)
        • Sales Footprint
        • Strategy Overview
          • Marketing Strategy
          • Product Strategy
          • Channel Strategy
      • Sonoco Products Company
        • Overview
        • Product Portfolio
        • Profitability by Market Segments (Product/Age /Sales Channel/Region)
        • Sales Footprint
        • Strategy Overview
          • Marketing Strategy
          • Product Strategy
          • Channel Strategy
      • Thermo Fisher Scientific Inc.
        • Overview
        • Product Portfolio
        • Profitability by Market Segments (Product/Age /Sales Channel/Region)
        • Sales Footprint
        • Strategy Overview
          • Marketing Strategy
          • Product Strategy
          • Channel Strategy
      • Rohrer Corporation
        • Overview
        • Product Portfolio
        • Profitability by Market Segments (Product/Age /Sales Channel/Region)
        • Sales Footprint
        • Strategy Overview
          • Marketing Strategy
          • Product Strategy
          • Channel Strategy
  20. Assumptions & Acronyms Used
  21. Research Methodology

List of Tables

  • Table 1: Global Market Value (USD Billion) Forecast by Region, 2020 to 2035
  • Table 2: Global Market Volume (Units) Forecast by Region, 2020 to 2035
  • Table 3: Global Market Value (USD Billion) Forecast by Material Type, 2020 to 2035
  • Table 4: Global Market Volume (Units) Forecast by Material Type, 2020 to 2035
  • Table 5: Global Market Value (USD Billion) Forecast by Product Type, 2020 to 2035
  • Table 6: Global Market Volume (Units) Forecast by Product Type, 2020 to 2035
  • Table 7: Global Market Value (USD Billion) Forecast by End Users, 2020 to 2035
  • Table 8: Global Market Volume (Units) Forecast by End Users, 2020 to 2035
  • Table 9: North America Market Value (USD Billion) Forecast by Country, 2020 to 2035
  • Table 10: North America Market Volume (Units) Forecast by Country, 2020 to 2035
  • Table 11: North America Market Value (USD Billion) Forecast by Material Type, 2020 to 2035
  • Table 12: North America Market Volume (Units) Forecast by Material Type, 2020 to 2035
  • Table 13: North America Market Value (USD Billion) Forecast by Product Type, 2020 to 2035
  • Table 14: North America Market Volume (Units) Forecast by Product Type, 2020 to 2035
  • Table 15: North America Market Value (USD Billion) Forecast by End Users, 2020 to 2035
  • Table 16: North America Market Volume (Units) Forecast by End Users, 2020 to 2035
  • Table 17: Latin America Market Value (USD Billion) Forecast by Country, 2020 to 2035
  • Table 18: Latin America Market Volume (Units) Forecast by Country, 2020 to 2035
  • Table 19: Latin America Market Value (USD Billion) Forecast by Material Type, 2020 to 2035
  • Table 20: Latin America Market Volume (Units) Forecast by Material Type, 2020 to 2035
  • Table 21: Latin America Market Value (USD Billion) Forecast by Product Type, 2020 to 2035
  • Table 22: Latin America Market Volume (Units) Forecast by Product Type, 2020 to 2035
  • Table 23: Latin America Market Value (USD Billion) Forecast by End Users, 2020 to 2035
  • Table 24: Latin America Market Volume (Units) Forecast by End Users, 2020 to 2035
  • Table 25: Western Europe Market Value (USD Billion) Forecast by Country, 2020 to 2035
  • Table 26: Western Europe Market Volume (Units) Forecast by Country, 2020 to 2035
  • Table 27: Western Europe Market Value (USD Billion) Forecast by Material Type, 2020 to 2035
  • Table 28: Western Europe Market Volume (Units) Forecast by Material Type, 2020 to 2035
  • Table 29: Western Europe Market Value (USD Billion) Forecast by Product Type, 2020 to 2035
  • Table 30: Western Europe Market Volume (Units) Forecast by Product Type, 2020 to 2035
  • Table 31: Western Europe Market Value (USD Billion) Forecast by End Users, 2020 to 2035
  • Table 32: Western Europe Market Volume (Units) Forecast by End Users, 2020 to 2035
  • Table 33: Eastern Europe Market Value (USD Billion) Forecast by Country, 2020 to 2035
  • Table 34: Eastern Europe Market Volume (Units) Forecast by Country, 2020 to 2035
  • Table 35: Eastern Europe Market Value (USD Billion) Forecast by Material Type, 2020 to 2035
  • Table 36: Eastern Europe Market Volume (Units) Forecast by Material Type, 2020 to 2035
  • Table 37: Eastern Europe Market Value (USD Billion) Forecast by Product Type, 2020 to 2035
  • Table 38: Eastern Europe Market Volume (Units) Forecast by Product Type, 2020 to 2035
  • Table 39: Eastern Europe Market Value (USD Billion) Forecast by End Users, 2020 to 2035
  • Table 40: Eastern Europe Market Volume (Units) Forecast by End Users, 2020 to 2035
  • Table 41: East Asia Market Value (USD Billion) Forecast by Country, 2020 to 2035
  • Table 42: East Asia Market Volume (Units) Forecast by Country, 2020 to 2035
  • Table 43: East Asia Market Value (USD Billion) Forecast by Material Type, 2020 to 2035
  • Table 44: East Asia Market Volume (Units) Forecast by Material Type, 2020 to 2035
  • Table 45: East Asia Market Value (USD Billion) Forecast by Product Type, 2020 to 2035
  • Table 46: East Asia Market Volume (Units) Forecast by Product Type, 2020 to 2035
  • Table 47: East Asia Market Value (USD Billion) Forecast by End Users, 2020 to 2035
  • Table 48: East Asia Market Volume (Units) Forecast by End Users, 2020 to 2035
  • Table 49: South Asia & Pacific Market Value (USD Billion) Forecast by Country, 2020 to 2035
  • Table 50: South Asia & Pacific Market Volume (Units) Forecast by Country, 2020 to 2035
  • Table 51: South Asia & Pacific Market Value (USD Billion) Forecast by Material Type, 2020 to 2035
  • Table 52: South Asia & Pacific Market Volume (Units) Forecast by Material Type, 2020 to 2035
  • Table 53: South Asia & Pacific Market Value (USD Billion) Forecast by Product Type, 2020 to 2035
  • Table 54: South Asia & Pacific Market Volume (Units) Forecast by Product Type, 2020 to 2035
  • Table 55: South Asia & Pacific Market Value (USD Billion) Forecast by End Users, 2020 to 2035
  • Table 56: South Asia & Pacific Market Volume (Units) Forecast by End Users, 2020 to 2035
  • Table 57: Middle East and Africa Market Value (USD Billion) Forecast by Country, 2020 to 2035
  • Table 58: Middle East and Africa Market Volume (Units) Forecast by Country, 2020 to 2035
  • Table 59: Middle East and Africa Market Value (USD Billion) Forecast by Material Type, 2020 to 2035
  • Table 60: Middle East and Africa Market Volume (Units) Forecast by Material Type, 2020 to 2035
  • Table 61: Middle East and Africa Market Value (USD Billion) Forecast by Product Type, 2020 to 2035
  • Table 62: Middle East and Africa Market Volume (Units) Forecast by Product Type, 2020 to 2035
  • Table 63: Middle East and Africa Market Value (USD Billion) Forecast by End Users, 2020 to 2035
  • Table 64: Middle East and Africa Market Volume (Units) Forecast by End Users, 2020 to 2035

List of Figures

  • Figure 1: Global Market Volume (Units) Forecast 2020 to 2035
  • Figure 2: Global Market Pricing Analysis
  • Figure 3: Global Market Value (USD Billion) Forecast 2020 to 2035
  • Figure 4: Global Market Value Share and BPS Analysis by Material Type, 2025 and 2035
  • Figure 5: Global Market Y-o-Y Growth Comparison by Material Type, 2025 to 2035
  • Figure 6: Global Market Attractiveness Analysis by Material Type
  • Figure 7: Global Market Value Share and BPS Analysis by Product Type, 2025 and 2035
  • Figure 8: Global Market Y-o-Y Growth Comparison by Product Type, 2025 to 2035
  • Figure 9: Global Market Attractiveness Analysis by Product Type
  • Figure 10: Global Market Value Share and BPS Analysis by End Users, 2025 and 2035
  • Figure 11: Global Market Y-o-Y Growth Comparison by End Users, 2025 to 2035
  • Figure 12: Global Market Attractiveness Analysis by End Users
  • Figure 13: Global Market Value (USD Billion) Share and BPS Analysis by Region, 2025 and 2035
  • Figure 14: Global Market Y-o-Y Growth Comparison by Region, 2025 to 2035
  • Figure 15: Global Market Attractiveness Analysis by Region
  • Figure 16: North America Market Incremental $ Opportunity, 2025 to 2035
  • Figure 17: Latin America Market Incremental $ Opportunity, 2025 to 2035
  • Figure 18: Western Europe Market Incremental $ Opportunity, 2025 to 2035
  • Figure 19: Eastern Europe Market Incremental $ Opportunity, 2025 to 2035
  • Figure 20: East Asia Market Incremental $ Opportunity, 2025 to 2035
  • Figure 21: South Asia & Pacific Market Incremental $ Opportunity, 2025 to 2035
  • Figure 22: Middle East and Africa Market Incremental $ Opportunity, 2025 to 2035
  • Figure 23: North America Market Value Share and BPS Analysis by Country, 2025 and 2035
  • Figure 24: North America Market Value Share and BPS Analysis by Material Type, 2025 and 2035
  • Figure 25: North America Market Y-o-Y Growth Comparison by Material Type, 2025 to 2035
  • Figure 26: North America Market Attractiveness Analysis by Material Type
  • Figure 27: North America Market Value Share and BPS Analysis by Product Type, 2025 and 2035
  • Figure 28: North America Market Y-o-Y Growth Comparison by Product Type, 2025 to 2035
  • Figure 29: North America Market Attractiveness Analysis by Product Type
  • Figure 30: North America Market Value Share and BPS Analysis by End Users, 2025 and 2035
  • Figure 31: North America Market Y-o-Y Growth Comparison by End Users, 2025 to 2035
  • Figure 32: North America Market Attractiveness Analysis by End Users
  • Figure 33: Latin America Market Value Share and BPS Analysis by Country, 2025 and 2035
  • Figure 34: Latin America Market Value Share and BPS Analysis by Material Type, 2025 and 2035
  • Figure 35: Latin America Market Y-o-Y Growth Comparison by Material Type, 2025 to 2035
  • Figure 36: Latin America Market Attractiveness Analysis by Material Type
  • Figure 37: Latin America Market Value Share and BPS Analysis by Product Type, 2025 and 2035
  • Figure 38: Latin America Market Y-o-Y Growth Comparison by Product Type, 2025 to 2035
  • Figure 39: Latin America Market Attractiveness Analysis by Product Type
  • Figure 40: Latin America Market Value Share and BPS Analysis by End Users, 2025 and 2035
  • Figure 41: Latin America Market Y-o-Y Growth Comparison by End Users, 2025 to 2035
  • Figure 42: Latin America Market Attractiveness Analysis by End Users
  • Figure 43: Western Europe Market Value Share and BPS Analysis by Country, 2025 and 2035
  • Figure 44: Western Europe Market Value Share and BPS Analysis by Material Type, 2025 and 2035
  • Figure 45: Western Europe Market Y-o-Y Growth Comparison by Material Type, 2025 to 2035
  • Figure 46: Western Europe Market Attractiveness Analysis by Material Type
  • Figure 47: Western Europe Market Value Share and BPS Analysis by Product Type, 2025 and 2035
  • Figure 48: Western Europe Market Y-o-Y Growth Comparison by Product Type, 2025 to 2035
  • Figure 49: Western Europe Market Attractiveness Analysis by Product Type
  • Figure 50: Western Europe Market Value Share and BPS Analysis by End Users, 2025 and 2035
  • Figure 51: Western Europe Market Y-o-Y Growth Comparison by End Users, 2025 to 2035
  • Figure 52: Western Europe Market Attractiveness Analysis by End Users
  • Figure 53: Eastern Europe Market Value Share and BPS Analysis by Country, 2025 and 2035
  • Figure 54: Eastern Europe Market Value Share and BPS Analysis by Material Type, 2025 and 2035
  • Figure 55: Eastern Europe Market Y-o-Y Growth Comparison by Material Type, 2025 to 2035
  • Figure 56: Eastern Europe Market Attractiveness Analysis by Material Type
  • Figure 57: Eastern Europe Market Value Share and BPS Analysis by Product Type, 2025 and 2035
  • Figure 58: Eastern Europe Market Y-o-Y Growth Comparison by Product Type, 2025 to 2035
  • Figure 59: Eastern Europe Market Attractiveness Analysis by Product Type
  • Figure 60: Eastern Europe Market Value Share and BPS Analysis by End Users, 2025 and 2035
  • Figure 61: Eastern Europe Market Y-o-Y Growth Comparison by End Users, 2025 to 2035
  • Figure 62: Eastern Europe Market Attractiveness Analysis by End Users
  • Figure 63: East Asia Market Value Share and BPS Analysis by Country, 2025 and 2035
  • Figure 64: East Asia Market Value Share and BPS Analysis by Material Type, 2025 and 2035
  • Figure 65: East Asia Market Y-o-Y Growth Comparison by Material Type, 2025 to 2035
  • Figure 66: East Asia Market Attractiveness Analysis by Material Type
  • Figure 67: East Asia Market Value Share and BPS Analysis by Product Type, 2025 and 2035
  • Figure 68: East Asia Market Y-o-Y Growth Comparison by Product Type, 2025 to 2035
  • Figure 69: East Asia Market Attractiveness Analysis by Product Type
  • Figure 70: East Asia Market Value Share and BPS Analysis by End Users, 2025 and 2035
  • Figure 71: East Asia Market Y-o-Y Growth Comparison by End Users, 2025 to 2035
  • Figure 72: East Asia Market Attractiveness Analysis by End Users
  • Figure 73: South Asia & Pacific Market Value Share and BPS Analysis by Country, 2025 and 2035
  • Figure 74: South Asia & Pacific Market Value Share and BPS Analysis by Material Type, 2025 and 2035
  • Figure 75: South Asia & Pacific Market Y-o-Y Growth Comparison by Material Type, 2025 to 2035
  • Figure 76: South Asia & Pacific Market Attractiveness Analysis by Material Type
  • Figure 77: South Asia & Pacific Market Value Share and BPS Analysis by Product Type, 2025 and 2035
  • Figure 78: South Asia & Pacific Market Y-o-Y Growth Comparison by Product Type, 2025 to 2035
  • Figure 79: South Asia & Pacific Market Attractiveness Analysis by Product Type
  • Figure 80: South Asia & Pacific Market Value Share and BPS Analysis by End Users, 2025 and 2035
  • Figure 81: South Asia & Pacific Market Y-o-Y Growth Comparison by End Users, 2025 to 2035
  • Figure 82: South Asia & Pacific Market Attractiveness Analysis by End Users
  • Figure 83: Middle East and Africa Market Value Share and BPS Analysis by Country, 2025 and 2035
  • Figure 84: Middle East and Africa Market Value Share and BPS Analysis by Material Type, 2025 and 2035
  • Figure 85: Middle East and Africa Market Y-o-Y Growth Comparison by Material Type, 2025 to 2035
  • Figure 86: Middle East and Africa Market Attractiveness Analysis by Material Type
  • Figure 87: Middle East and Africa Market Value Share and BPS Analysis by Product Type, 2025 and 2035
  • Figure 88: Middle East and Africa Market Y-o-Y Growth Comparison by Product Type, 2025 to 2035
  • Figure 89: Middle East and Africa Market Attractiveness Analysis by Product Type
  • Figure 90: Middle East and Africa Market Value Share and BPS Analysis by End Users, 2025 and 2035
  • Figure 91: Middle East and Africa Market Y-o-Y Growth Comparison by End Users, 2025 to 2035
  • Figure 92: Middle East and Africa Market Attractiveness Analysis by End Users
  • Figure 93: Global Market - Tier Structure Analysis
  • Figure 94: Global Market - Company Share Analysis

Frequently Asked Questions

What is the size of the dispensing trays market in 2025?

The dispensing trays market is valued at USD 8.1 billion in 2025.

How big is the dispensing trays market expected to be by 2035?

The market is projected to reach USD 11.9 billion by 2035.

What is the expected CAGR for the dispensing trays market?

The market is forecast to expand at a CAGR of 3.9% from 2025 to 2035.

Which is the most preferred material in the dispensing trays market?

Plastic is the leading material, accounting for 41.2% of the market in 2025.

Who are the major end users of dispensing trays market products?

Hospitals and clinics dominate, with 47% share in 2025.

Explore Similar Insights

Future Market Insights

Dispensing Trays Market

Chat With

MaRIA

Hi There, I am MaRIA, Your Market Research Intelligence Assistant. How may I help you?