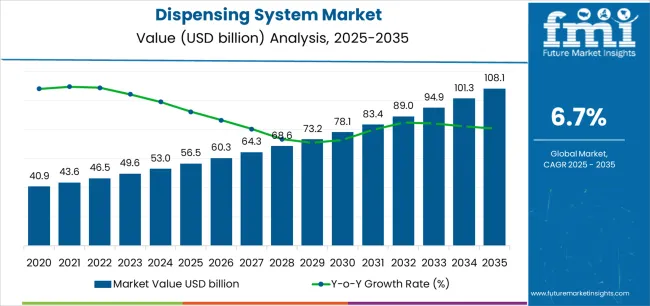
The dispensing system market stands at the threshold of a decade-long expansion trajectory that promises to reshape automated fluid delivery technology and precision application solutions. The market's journey from USD 56.5 billion in 2025 to USD 108.1 billion by 2035 represents substantial growth, demonstrating the accelerating adoption of advanced dispensing technology and material application optimization across electronics manufacturing facilities, automotive assembly operations, and pharmaceutical production sectors.
The first half of the decade (2025-2030) will witness the market climbing from USD 56.5 billion to approximately USD 78.1 billion, adding USD 21.6 billion in value, which constitutes 42% of the total forecast growth period. This phase will be characterized by the rapid adoption of automated dispensing systems, driven by increasing electronics production volumes and the growing need for precision material application solutions worldwide. Enhanced dispensing capabilities and robotic integration systems will become standard expectations rather than premium options.
The latter half (2030-2035) will witness continued growth from USD 78.1 billion to USD 108.1 billion, representing an addition of USD 29.8 billion or 58% of the decade's expansion. This period will be defined by mass market penetration of smart dispensing technologies, integration with comprehensive manufacturing execution platforms, and seamless compatibility with existing production infrastructure. The market trajectory signals fundamental shifts in how manufacturing facilities approach material application and quality control, with participants positioned to benefit from growing demand across multiple technology types and application segments.
| Period | Primary Revenue Buckets | Share | Notes |
|---|---|---|---|
| Today | New equipment sales (manual, automated, robotic) | 46% | Capex-led, production-driven purchases |
| Consumables & replacement parts | 26% | Nozzles, valves, syringes, maintenance kits | |
| Service & calibration contracts | 16% | Preventive maintenance, accuracy validation | |
| System upgrades & retrofits | 12% | Automation enhancement, capacity expansion | |
| Future (3-5 yrs) | Smart automated systems | 40-44% | Industry 4.0 integration, robotic dispensing |
| Digital monitoring & analytics | 18-22% | Real-time quality tracking, predictive maintenance | |
| Consumables & specialized fluids | 14-18% | High-precision tips, application-specific materials | |
| Service-as-a-subscription | 12-16% | Performance guarantees, uptime-based pricing | |
| Integration & validation services | 8-12% | Process qualification, traceability systems | |
| Data & optimization services | 6-9% | Benchmarking for manufacturing operators |
| Metric | Value |
|---|---|
| Market Value (2025) | USD 56.5 billion |
| Market Forecast (2035) | USD 107.9 billion |
| Growth Rate | 6.7% CAGR |
| Leading Technology | Manual Dispensing |
| Primary Application | Electronics Segment |
The market demonstrates strong fundamentals with Manual Dispensing capturing a dominant 38% share through reliable application capabilities and manufacturing process optimization. Electronics applications drive primary demand with 31% market share, supported by increasing semiconductor production and advanced packaging requirements. Geographic expansion remains concentrated in developed markets with established manufacturing infrastructure, while emerging economies show accelerating adoption rates driven by electronics assembly initiatives and rising precision standards.
Primary Classification: The market segments by technology into Manual Dispensing (including Benchtop/valve-controlled tools, Syringe & barrel systems, and Manual/air-assisted guns), Automated Dispensing, and Robotic Dispensing systems, representing the evolution from basic application equipment to sophisticated precision solutions for comprehensive manufacturing process optimization.
Secondary Classification: Application segmentation divides the market into Automotive (including Body-in-white & structural adhesives, Battery & e-powertrain materials, Electronics & sensor encapsulation, and Interiors/glass & trim), Electronics, Healthcare/Pharmaceutical, Aerospace, and other sectors, reflecting distinct requirements for material viscosity, dispensing accuracy, and production volume standards.
Tertiary Classification: End-use industry segmentation spans Electronics (including Semiconductor advanced packaging, PCB assembly & conformal coating, Consumer devices & peripherals, and Optoelectronics & displays), Automotive, Healthcare/Pharmaceutical, Aerospace, Packaging, and other manufacturing sectors.
Regional Classification: Geographic distribution covers North America, Latin America, Western Europe, Eastern Europe, East Asia, South Asia Pacific, and Middle East & Africa, with developed markets leading adoption while emerging economies show accelerating growth patterns driven by manufacturing expansion programs.
The segmentation structure reveals technology progression from standard manual equipment toward sophisticated robotic systems with enhanced precision and automation capabilities, while application diversity spans from automotive assembly to semiconductor packaging operations requiring precise material dispensing solutions.
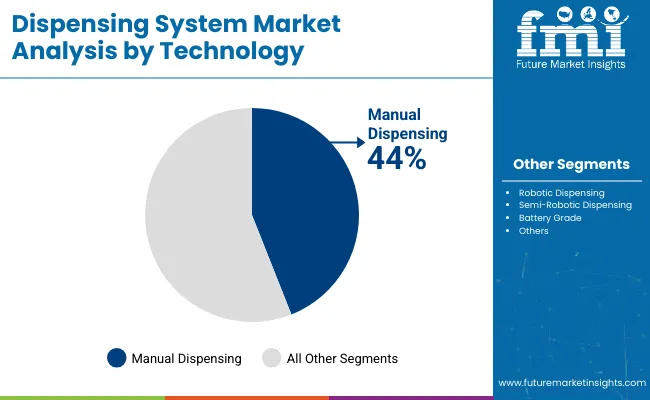
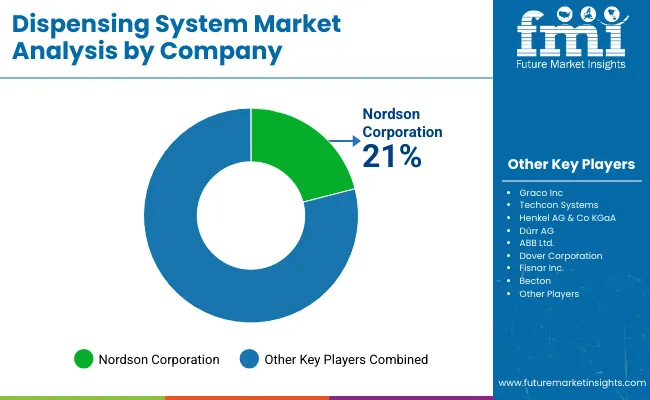
Market Position: Manual Dispensing systems command the leading position in the dispensing system market with 24% market share through proven application features, including superior cost-effectiveness, operational flexibility, and manufacturing process adaptability that enable production facilities to achieve optimal material application across diverse electronics and automotive environments.
Value Drivers: The segment benefits from manufacturing facility preference for reliable dispensing systems that provide consistent application performance, low capital investment, and operational simplicity without requiring significant automation infrastructure. Proven design features enable effective material control systems, operator familiarity, and integration with existing production equipment, where operational performance and application quality represent critical facility requirements.
Competitive Advantages: Manual Dispensing systems differentiate through proven operational reliability, flexible application characteristics, and ease of deployment in varied manufacturing systems that enhance facility effectiveness while maintaining optimal quality standards suitable for diverse electronics and automotive applications.
Key market characteristics:
Benchtop/valve-controlled tools maintain the leading position within manual dispensing with 17% overall market share due to balanced precision and cost-effectiveness properties. These systems appeal to facilities requiring reliable material application with competitive investment for small to mid-scale manufacturing applications. Market growth is driven by electronics expansion, emphasizing dependable dispensing solutions and operational control through optimized valve designs.
Syringe & barrel systems capture 12% market share through flexible dispensing requirements in laboratory environments, small-batch production, and repair applications. These facilities demand portable dispensing systems capable of handling diverse materials while providing effective application accuracy and operational portability capabilities.
Manual/air-assisted guns account for 9% market share, including larger bead applications, sealant dispensing, and construction assembly operations requiring handheld dispensing capabilities for operational flexibility and material volume.
Automated dispensing systems demonstrate significant market growth through advanced precision requirements, high-volume production environments, and quality consistency demands driving technology adoption for manufacturing optimization.
Robotic dispensing systems capture growing market share through complex path applications, three-dimensional dispensing requirements, and Industry 4.0 integration demanding programmable precision capabilities for operational excellence.
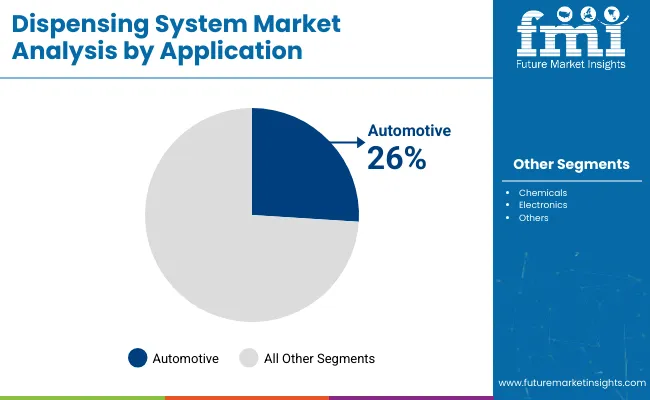
Market Context: Automotive application demonstrates strong market position in the dispensing system market with 28% market share due to widespread adoption of advanced material bonding and comprehensive assembly processes supporting adhesive application across vehicle manufacturing, battery assembly, and electronic component integration that maximize structural integrity while maintaining production efficiency.
Appeal Factors: Automotive application operators prioritize material consistency, dispensing precision, and integration with existing assembly infrastructure that enables coordinated manufacturing operations across multiple production stations. The segment benefits from substantial OEM investment and electrification programs that emphasize the deployment of automated dispensing systems for quality optimization and production efficiency applications.
Growth Drivers: Electric vehicle production expansion programs incorporate advanced dispensing as standard requirement for battery pack assembly, while lightweighting initiatives increase demand for structural adhesive capabilities that comply with safety standards and minimize assembly complexity.
Market Challenges: Material viscosity variation and curing time requirements may complicate process standardization across different vehicle platforms or assembly scenarios.
Application dynamics include:
Body-in-white & structural adhesives applications capture 9% market share through vehicle structure bonding, panel attachment requirements, and crash management systems providing structural integrity and weight reduction capabilities for automotive assembly.
Battery & e-powertrain materials applications maintain 8% market position through cell-to-pack bonding, thermal interface material application, and potting compound dispensing requiring precision material placement for battery performance and safety.
Electronics & sensor encapsulation applications account for 7% market share through ADAS component protection, power electronics sealing, and control module potting requiring environmental protection and electrical insulation capabilities.
Interiors/glass & trim applications capture 4% market share through windshield bonding, interior panel attachment, and trim sealing requiring aesthetic finishing and structural attachment capabilities.
Market Context: Electronics industry dominates the market with 31% market share, reflecting the primary demand source for precision dispensing technology in semiconductor packaging and electronics assembly operations where micro-scale material placement represents critical quality requirements.
Business Model Advantages: Electronics manufacturers provide direct market demand for advanced dispensing equipment, driving technology innovation and precision enhancement while maintaining production yield and component reliability requirements. Semiconductor packaging processes require sub-millimeter dispensing accuracy for optimal device performance and thermal management.
Operational Benefits: Electronics applications include die attach, underfill dispensing, and conformal coating operations that drive consistent demand for dispensing equipment while providing access to latest micro-dispensing technologies. Manufacturing facilities require ultra-precise material control to maintain component quality and production efficiency.
Semiconductor advanced packaging applications capture 12% market share through die attach materials, underfill dispensing requirements, and flip-chip assembly operations demanding ultra-high precision material placement for device reliability and thermal performance.
PCB assembly & conformal coating applications maintain 9% market position through solder paste dispensing, adhesive dot placement, and protective coating requirements providing circuit protection and component attachment capabilities.
Consumer devices & peripherals applications account for 6% market share through smartphone assembly, wearable device bonding, and accessory manufacturing requiring precision adhesive application for product durability and aesthetics.
Optoelectronics & displays applications capture 4% market share through LED packaging, display panel assembly, and optical component bonding requiring precision material placement for optical performance and device reliability.
Automotive industry maintains strong market presence through vehicle assembly, component manufacturing, and electrification applications requiring reliable dispensing for production efficiency and product quality.
Healthcare/Pharmaceutical industry captures market share through medical device assembly, pharmaceutical packaging, and diagnostic equipment manufacturing requiring precision dispensing for regulatory compliance and product sterility.
Aerospace industry accounts for market share through aircraft assembly, component bonding, and composite manufacturing requiring certified dispensing processes for structural integrity and safety compliance.
Packaging industry captures market share through container manufacturing, closure assembly, and labeling operations requiring efficient dispensing for production throughput and material optimization.
| Category | Factor | Impact | Why It Matters |
|---|---|---|---|
| Driver | Electronics miniaturization & advanced packaging | ★★★★★ | Shrinking component sizes demand sub-millimeter precision; dispensing systems with vision guidance become mandatory; vendors offering integrated inspection gain advantage. |
| Driver | EV battery production scaling & thermal management | ★★★★★ | Battery pack assembly requires consistent TIM and adhesive application; dispensing accuracy affects safety and performance; automation reduces variability and improves traceability. |
| Driver | Manufacturing labor shortages & automation imperatives | ★★★★☆ | Chronic skilled operator gaps drive robotic dispensing adoption; systems with intuitive programming reduce training needs; labor cost per unit becomes key ROI metric. |
| Restraint | High capital investment for automated systems | ★★★★☆ | Robotic dispensing cells cost USD 100,000-500,000; small manufacturers defer automation; increases reliance on manual equipment and contract manufacturing. |
| Restraint | Material compatibility & process validation complexity | ★★★☆☆ | Different adhesives, potting compounds, and thermal materials require custom dispensing parameters; validation time extends production ramp; limits system versatility. |
| Trend | Industry 4.0 integration & real-time quality monitoring | ★★★★★ | Smart dispensing systems enable weight verification, vision inspection, and traceability; digital twins optimize parameters; connectivity becomes baseline expectation. |
| Trend | Sustainable materials & waste reduction mandates | ★★★★☆ | Low-VOC adhesives and bio-based materials require adapted dispensing; precision application minimizes waste; eco-design regulations drive equipment upgrades. |
The dispensing system market demonstrates varied regional dynamics with Growth Leaders including South Korea (9.1% growth rate) and Japan (8.4% growth rate) driving expansion through robotics integration initiatives and semiconductor manufacturing development. Steady Performers encompass India (8% growth rate), United Kingdom (7.7% growth rate), and developed regions, benefiting from established manufacturing infrastructure and automation adoption. Emerging Markets feature China (7.5% growth rate) and United States (6.9% growth rate), where electronics hub development and Industry 4.0 initiatives support consistent growth patterns.
Regional synthesis reveals Asian markets leading adoption through electronics manufacturing expansion and automation development, while European countries maintain robust expansion supported by automotive electrification and sustainability requirements. North American markets show steady growth driven by EV production and aerospace electronics applications.
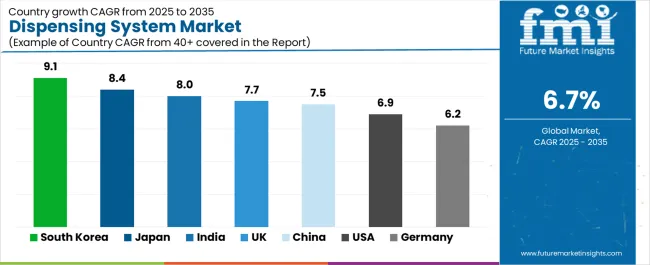
| Region/Country | 2025-2035 Growth | How to win | What to watch out |
|---|---|---|---|
| South Korea | 9.1% | Lead with robotic integration | Technology refresh cycles; fierce local competition |
| Japan | 8.4% | Provide micro-dispensing precision | Conservative adoption; aging workforce |
| India | 8% | Focus on cost-effective automation | Infrastructure gaps; skill shortages |
| United Kingdom | 7.7% | Target pharma & specialty chemicals | Brexit impacts; regulatory complexity |
| China | 7.5% | Offer competitive local solutions | IP protection; localization pressure |
| United States | 6.9% | Push Industry 4.0 traceability | Cost pressures; long validation cycles |
| Germany | 6.2% | Emphasize sustainability upgrades | Over-engineering; market saturation |
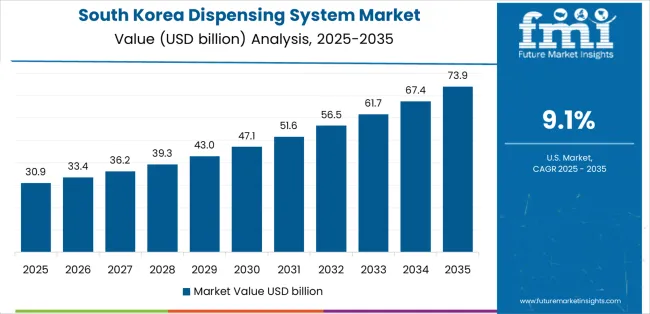
South Korea establishes fastest market growth through aggressive manufacturing automation programs and comprehensive robotics integration development, integrating advanced dispensing systems as standard components in semiconductor packaging and battery production installations. The country's 9.1% growth rate reflects government initiatives promoting export-oriented automation and manufacturing competitiveness that mandate the use of precision dispensing systems in electronics and automotive facilities. Growth concentrates in major industrial regions, including Gyeonggi, North Chungcheong, and South Gyeongsang, where semiconductor fabs showcase integrated robotic dispensing systems that appeal to electronics operators seeking advanced precision capabilities and production optimization applications.
Korean manufacturers are developing advanced dispensing solutions that combine domestic robotics advantages with precision operational features, including automated vision systems and enhanced accuracy capabilities. Distribution channels through manufacturing equipment suppliers and systems integrators expand market access, while government support for automation adoption supports deployment across diverse electronics and battery segments.
Strategic Market Indicators:
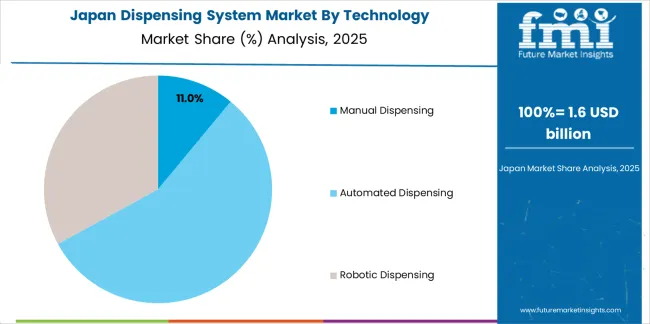
In Tokyo, Osaka, and Nagoya, semiconductor facilities and medical device manufacturers are implementing advanced dispensing systems as standard equipment for micro-scale precision and quality assurance applications, driven by increasing semiconductor packaging complexity and medical device regulatory requirements that emphasize the importance of sub-millimeter accuracy capabilities. The market holds an 8.4% growth rate, supported by technology leadership initiatives and manufacturing quality standards that promote advanced dispensing systems for electronics and medical device facilities. Japanese operators are adopting dispensing systems that provide exceptional operational precision and reliability features, particularly appealing in high-tech manufacturing where accuracy and quality represent critical competitive requirements.
Market expansion benefits from established semiconductor manufacturing capabilities and medical device engineering expertise that enable development of ultra-precision dispensing systems for electronics and healthcare applications. Technology adoption follows patterns established in precision manufacturing, where quality and reliability drive procurement decisions and operational deployment.
Market Intelligence Brief:
India's market expansion benefits from diverse manufacturing demand, including automotive plant construction in Gujarat and Tamil Nadu, electronics assembly growth, and pharmaceutical facility modernization that increasingly incorporate dispensing solutions for production automation applications. The country maintains an 8% growth rate, driven by rising manufacturing activity and increasing recognition of automation benefits, including consistent quality and enhanced production efficiency.
Market dynamics focus on cost-effective dispensing solutions that balance advanced operational performance with affordability considerations important to Indian manufacturing operators. Growing industrial development creates continued demand for modern dispensing systems in new facility infrastructure and manufacturing modernization projects.
Strategic Market Considerations:
United Kingdom's advanced pharmaceutical technology market demonstrates sophisticated dispensing system deployment with documented operational effectiveness in drug manufacturing applications and specialty chemical production through integration with existing process systems and facility infrastructure. The country leverages expertise in pharmaceutical manufacturing and specialty formulation to maintain a 7.7% growth rate. Industrial centers, including Cambridge, Manchester, and Scotland, showcase premium installations where dispensing systems integrate with comprehensive pharmaceutical platforms and quality management systems to optimize filling operations and regulatory compliance effectiveness.
British manufacturers prioritize system validation and regulatory compliance in dispensing equipment selection, creating demand for premium systems with advanced features, including process monitoring integration and automated documentation systems. The market benefits from established pharmaceutical infrastructure and a willingness to invest in advanced dispensing technologies that provide long-term compliance benefits and quality assurance.
Market Intelligence Brief:
China's market expansion benefits from comprehensive electronics manufacturing, including smartphone production in Shenzhen and Dongguan, semiconductor packaging growth, and battery assembly development that increasingly incorporate dispensing solutions for production efficiency applications. The country maintains a 7.5% growth rate, driven by domestic electronics hub development and increasing manufacturing sophistication supporting advanced material application requirements.
Market dynamics focus on competitive dispensing solutions that balance performance capabilities with cost considerations important to Chinese electronics manufacturers. Massive production volumes create continued demand for efficient dispensing systems in electronics assembly and battery production facilities.
Strategic Market Considerations:
United States establishes market leadership through comprehensive automotive electrification programs and advanced aerospace electronics development, integrating dispensing systems across manufacturing and assembly applications. The country's 6.9% growth rate reflects established industrial relationships and mature automation adoption that supports widespread use of precision dispensing systems in EV production and aerospace facilities. Growth concentrates in major manufacturing centers, including Michigan, California, and the Southeast, where EV battery plants showcase advanced dispensing deployment that appeals to automotive operators seeking proven material application capabilities and traceability applications.
American equipment providers leverage established distribution networks and comprehensive integration capabilities, including process validation programs and Industry 4.0 support that create customer relationships and operational advantages. The market benefits from mature manufacturing standards and quality traceability requirements that support dispensing equipment adoption while enabling technology advancement and process optimization.
Market Intelligence Brief:
Germany's advanced automotive technology market demonstrates sophisticated dispensing system deployment with documented operational effectiveness in premium vehicle production and machinery manufacturing through integration with existing assembly systems and quality infrastructure. The country leverages engineering expertise in automotive manufacturing and process validation to maintain a 6.2% growth rate. Industrial centers, including Baden-Württemberg, Bavaria, and North Rhine-Westphalia, showcase premium installations where dispensing systems integrate with comprehensive automotive platforms and manufacturing execution systems to optimize assembly operations and sustainability effectiveness.
German manufacturers prioritize system precision and environmental compliance in dispensing equipment development, creating demand for premium systems with advanced features, including material waste reduction and energy-efficient operation. The market benefits from established automotive technology infrastructure and commitment to sustainability initiatives that drive dispensing equipment upgrades.
Market Intelligence Brief:
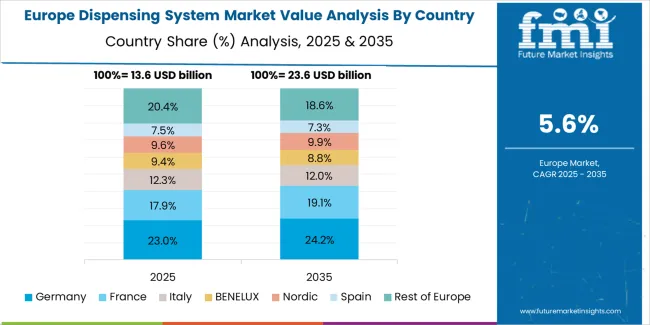
Europe accounts for 27.5% of global value, approximately USD 15.5 billion in 2025. Country and cluster distribution within Europe shows Germany at 22% (USD 3.4 billion) driven by premium automotive and machinery with stringent process validation. United Kingdom holds 18% (USD 2.8 billion) through pharma, specialty chemicals, and strong laboratory and pilot automation. France accounts for 12% (USD 1.9 billion) via cosmetics/beauty dispensing and food processing applications. Italy maintains 10% (USD 1.6 billion) through packaging machinery and food equipment OEM base. Nordics capture 9% (USD 1.4 billion) driven by med-tech and electronics niches with sustainability focus. Spain holds 9% (USD 1.4 billion) through food & beverage and automotive components. Benelux accounts for 8% (USD 1.2 billion) via logistics packaging and chemical clusters. Rest of Europe represents 12% (USD 1.9 billion) through Central and Eastern European automotive/electronics suppliers scaling automation. Europe's mix skews to electronics at 31%, automotive at 27%, pharma/healthcare at 20%, and packaged FMCG at 14% in 2025, with modernization and eco-design regulations underpinning upgrades.
| Stakeholder | What they actually control | Typical strengths | Typical blind spots |
|---|---|---|---|
| Global platforms | Distribution reach, comprehensive product portfolios, global service | Broad availability, proven reliability, multi-industry experience | Local application expertise; emerging market service density |
| Technology innovators | R&D capabilities; robotic systems; vision integration | Latest features first; attractive precision ROI | Service network gaps; material compatibility breadth |
| Regional specialists | Local compliance, rapid support, nearby engineering | Close-to-site service; pragmatic pricing; local regulations | Technology refresh cycles; scale limitations |
| Service-focused ecosystems | Integration support, validation programs, consumables supply | Lowest real downtime; comprehensive support | Service costs if overpromised; technology obsolescence |
| Niche specialists | Specialized applications, custom solutions, micro-dispensing | Win ultra-precision applications; flexible configurations | Scalability limitations; narrow market focus |
| Item | Value |
|---|---|
| Quantitative Units | USD 56.5 billion |
| Technology | Manual Dispensing (Benchtop/valve-controlled tools, Syringe & barrel systems, Manual/air-assisted guns), Automated Dispensing, Robotic Dispensing |
| Application | Automotive (Body-in-white & structural adhesives, Battery & e-powertrain materials, Electronics & sensor encapsulation, Interiors/glass & trim), Electronics, Healthcare/Pharmaceutical, Aerospace, Packaging |
| End-Use Industry | Electronics (Semiconductor advanced packaging, PCB assembly & conformal coating, Consumer devices & peripherals, Optoelectronics & displays), Automotive, Healthcare/Pharmaceutical, Aerospace, Packaging |
| Regions Covered | North America, Latin America, Western Europe, Eastern Europe, East Asia, South Asia Pacific, Middle East & Africa |
| Countries Covered | United States, China, Germany, India, United Kingdom, Japan, South Korea, France, Spain, Italy, and 25+ additional countries |
| Key Companies Profiled | Nordson Corporation, Graco Inc., AptarGroup Inc., Dover Corporation (OK International/Techcon Systems), Fisnar Inc., Henkel AG & Co. KGaA (Loctite equipment), Illinois Tool Works (ITW), Musashi Engineering Inc., Mycronic AB, ABB Ltd |
| Additional Attributes | Dollar sales by technology and application categories, regional adoption trends across East Asia, North America, and Western Europe, competitive landscape with dispensing equipment manufacturers and systems integrators, manufacturing operator preferences for precision control and system reliability, integration with production platforms and quality monitoring systems, innovations in micro-dispensing technology and robotic enhancement, and development of smart dispensing solutions with enhanced performance and operational optimization capabilities. |
The global dispensing system market is estimated to be valued at USD 56.5 billion in 2025.
The market size for the dispensing system market is projected to reach USD 108.1 billion by 2035.
The dispensing system market is expected to grow at a 6.7% CAGR between 2025 and 2035.
The key product types in dispensing system market are manual dispensing, automated dispensing and robotic dispensing.
In terms of application, automotive segment to command 28.0% share in the dispensing system market in 2025.


Full Research Suite comprises of:
Market outlook & trends analysis
Interviews & case studies
Strategic recommendations
Vendor profiles & capabilities analysis
5-year forecasts
8 regions and 60+ country-level data splits
Market segment data splits
12 months of continuous data updates
DELIVERED AS:
PDF EXCEL ONLINE
Aerosol Dispensing Systems Market
Dispensing Robots Market Size and Share Forecast Outlook 2025 to 2035
Dispensing Guns Market Size and Share Forecast Outlook 2025 to 2035
Dispensing Trays Market Size, Share & Forecast 2025 to 2035
Dispensing Carboy Market Size and Share Forecast Outlook 2025 to 2035
Dispensing Caps Market Growth - Demand & Forecast 2025 to 2035
Key Players & Market Share in the Dispensing Spout Industry
Market Share Breakdown of Dispensing Carboy Providers
Dispensing Spout Market by Cap & Pump Type from 2024 to 2034
Dispensing Jug Market
Dispensing Tap Market
Dispensing Sprayers Market
Beer Dispensing Machine Market Trends - Growth, Demand & Analysis 2025 to 2035
Fluid Dispensing Equipment Market Size and Share Forecast Outlook 2025 to 2035
Twist Dispensing Closures Market Size and Share Forecast Outlook 2025 to 2035
Pouch Dispensing Fitment Market
Hinged Dispensing Caps Market Size and Share Forecast Outlook 2025 to 2035
Competitive Landscape of Hinged Dispensing Caps Providers
Spouted Dispensing Closures Market
Product Dispensing Machinery Market

Thank you!
You will receive an email from our Business Development Manager. Please be sure to check your SPAM/JUNK folder too.
Chat With
MaRIA