Reports

- Global Locations -

Headquarters

Future Market Insights, Inc.

Christiana Corporate, 200
Continental Drive, Suite 401,
Newark, Delaware - 19713,
United States

T: +1-845-579-5705

Americas

Future Market Insights, Inc.

616 Corporate Way, Suite 2-9018,
Valley Cottage, NY 10989, United States

T: +1-347-918-3531

MEA

Future Market Insights

1602-6 Jumeirah Bay X2 Tower, Plot No: JLT-PH2-X2A,
Jumeirah Lakes Towers, Dubai,
United Arab Emirates

Europe

Future Market Insights

3rd Floor, 207 Regent Street,
W1B 3HH London
United Kingdom

T: + 44 (0) 20 8123 9659
D: +44 (0) 20 3287 4268

Asia Pacific

Future Market Insights

IndiaLand Global Tech Park, Unit UG-1, Behind Grand HighStreet, Phase 1, Hinjawadi, MH, Pune – 411057, India

Dual Chamber Dispensing Bottles Market Outlook

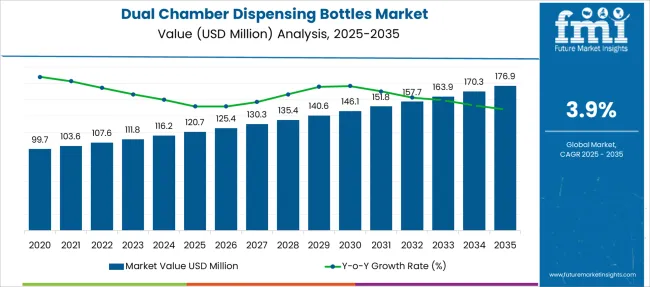
[333 Pages Report] The dual chamber dispensing bottles market is likely to record a CAGR of 3.9% through 2032. The dual chamber dispensing bottles market is currently valued at US$ 107.6 Mn in 2022 and is likely to reach over a valuation of US$ 157.7 Mn by 2032.

Dual chamber dispensing bottles are used more frequently by end users due to design advances by manufacturers and the development of products with material that has increased durability.

Products that are sturdy and lightweight are being produced to attract more small clients with limited production capacity. In turn, these advancements are growing the dual dispensing bottle market players by increasing the number of end-user verticals who use them.

With the proliferation of end-users or client bases of the dual chamber dispensing bottle market players, the number of applications of the product has also increased manifold, which has further created better opportunities in the present years. In line with this development, many start-ups have also come up to cater to the ever-increasing client base of the said market.

A contributing factor to the dual dispensing bottles market expansion is product producers' efforts to employ a variety of materials available at the site of its manufacturing unit. To increase the profit margin of these bottles, top dual chamber dispensing bottle product producers are progressively employing acrylonitrile butadiene styrene plastic or ABS plastic which has turned out to be the most preferred raw material for both existing and new players in the market out there.

Moreover, stringent and diverse regulations on the use and disposal of plastic waste are a growing concern for dual chamber dispensing bottles market key players to penetrate a new market. Several participants, therefore, have been investing highly in developing eco-friendly substitutes and alternatives.

Aside from this, other important plastic types utilized in the production of dual dispensing bottles include polyethylene terephthalate, low-density polyethylene, polystyrene, and high-density polyethylene or HDPE.

Another important component used to make these dispensing bottles are metal, and the primary metals used in the production of dual dispensing bottles are steel and aluminium. So in recent years, there has been a remarkable shift in the strategy adopted by prominent dual chamber dispensing bottle companies and their market orientation.

Finally, to counter the growing challenges and meet the diversifying consumer demand, many companies are trying to consolidate the global dual chamber dispensing bottles market through strategic mergers and partnerships with global and regional players.

In the coming days, it is expected that digital marketing strategies and acquiring new clients over digital space would be the mainstay of the dual chamber dispensing bottle businesses around the world.

Attributes Details
Dual Chamber Dispensing Bottles Market (CAGR) 3.9%
Dual Chamber Dispensing Bottles Market (2022) US$ 107.6 Mn
Dual Chamber Dispensing Bottles Market (2032) US$ 157.7 Mn

Don't pay for what you don't need

Customize your report by selecting specific countries or regions and save 30%!

Eco-Friendly Packaging To Create Buzz In The Consumers’ Segment

Due to its convenience, the demand for dual chamber dispensing bottles is expected to rise amongst various end users, such as cosmetics, pharmaceuticals, healthcare, food and beverage, and industrial markets.

However, the disposal of rigid plastic material substances such as HDPE and PET used to make these bottles can harm the environment, which is a significant challenge for the market. Conversely, manufacturers, primarily cosmetic and personal care products, are looking to develop aesthetic packaging designs to appeal to various consumer segments.

FMI’s research report on dual chamber dispensing bottles suggests that the growing preference of consumers and end users for eco-friendly packaging materials is invoking lucrative options for the dual chamber dispensing bottles market trends. This is because global packaging manufacturers are becoming increasingly aware of environmental and sustainability issues to enhance their brand image and reduce their carbon footprint.

The pharmaceutical industries have keenly interested in adopting dual chamber dispensing bottles. This is because the mechanism of these bottles in the pharma industry is equipped with “fixed-dose dispensing technology” to avoid any overdosing or under-dosing of medicines, fuelling the sales of dual chamber dispensing bottles.

Dual Chamber Dispensing Bottles Market Outlook

Some dual chamber dispensing bottle manufacturers also deliver extra configurations to carry hot and cold beverages in a single, dual chamber dispensing bottle. Other industry titans operating in the dual chamber dispensing bottles market have introduced dual chamber dispensing bottles in the past that were well received by consumers.

Given that the dual chamber dispensing bottles market is marked by steady introductions of innovations and a broadening consumer base, which, in turn, is expected to propel the sales of dual chamber dispensing bottles in the dual chamber dispensing bottles market.

The dual chamber dispensing bottle industry's need to reduce plastic consumption is its sole obstacle. In addition, the industry is seeing an increase in demand for sturdy bottles. Biodegradable bottles are being used by businesses.

Dual chamber dispensing bottles' versatility in use is likely to accelerate market expansion. Despite having dual chamber dispensing, the bottle doesn't take up a lot of room because it is made to be vertical. The dual chamber dispensing multi-use bottle is also anticipated to accelerate the sales of dual chamber dispensing bottles.

Athletes and the populace who are interested in fitness are embracing dual chamber dispensing bottles and dual compartment bottles. The dual chamber dispensing bottles have become a standard for a smart gadget-like item carried by sports enthusiasts and sportsmen since they allow users to carry two beverages in a single bottle.

Due to the growing demand for dual chamber dispensing bottles, producers in the industry have developed a wide selection of models that are appealing to a variety of consumers. The market's top producers of dual chamber dispensing bottles are undertaking innovations by designing bottles with horizontal separation and top dual flip lids that enable consumers to pour one beverage at a time.

Other trends in the dual chamber dispensing bottles market include a vacuum-insulated container with two drink compartments and an extra storage area for other everyday necessities. Furthermore, businesses offer an optional configuration that allows customers to carry both hot and cold beverages in a single two-compartment bottle.

Multiple players in the dual chamber dispensing bottle industry had previously released dual chamber dispensing bottles that were favorably appreciated by customers. Given that the market for dual chamber dispensing bottles is characterized by the consistent introduction of innovations and a growing customer base, this is projected to drive the sales of dual chamber dispensing bottles during the forecast period.

Ismail Sutaria
Ismail Sutaria

Principal Consultant

Talk to Analyst

Find your sweet spots for generating winning opportunities in this market.

What are the Major Drivers and Restraints for Dual Chamber Dispensing Bottles?

A global study on dual chamber dispensing bottles suggests that the visual appeal and convenience of application are likely to increase the demand for dual chamber dispensing bottles. These factors offer a high potential for packaging cosmetic products, such as hair care, skin care, deodorants, etc., and are expected to drive market growth during the forecast period.

To avoid contamination of products, the pharmaceutical and cosmetic industries are increasingly deploying these bottles to dispense the appropriate amount of product needed. Moreover, due to product innovations such as smart dispensing and airless packaging, dual chamber dispensing bottles are growing in demand, especially amongst haircare product manufacturers.

Dual chamber dispensing bottles market demand analysis explains that the packaging industry benefits significantly owing to the growing adoption of dual chamber dispensing bottles. This is because these dispensing bottles cater to the inflating demand for product differentiation, as the mechanisms in these bottles optimize the product life-cycle and increase the product's value.

Restraints:

When disposed of in landfills, plastic substances produce poisonous gases that further pollute the environment. This is likely to curb the sales of dual chamber dispensing bottles and the decline of the global market growth.

Furthermore, the physical properties of dual chamber dispensing bottles may vary depending on the type of resin used in manufacturing them. However, maintaining effective reverse logistics operations to ensure the proper and correct disposal of these bottles is expensive and results in high operating costs for manufacturers, and is therefore likely to hamper the market size growth.

On the contrary, manufacturers are increasingly implementing changes in packaging formats in order to meet consumer demands. Haircare product manufacturers, for example, are shifting from using traditional bottles to airless dispensers to ensure convenience for consumers.

Regional Landscape

North America Dual Chamber Dispensing Bottles Market Landscape: An Overview

With a revenue of 19%, North America is the largest dual chamber dispensing bottle market. This is owing to increased consumer beauty consciousness and increased availability of advanced products.

The dual chamber dispensing bottles market outlook explains that the North American population is increasingly shifting to safe skin and hair care products due to the increased concern about the side effects caused by unhealthy synthetic products.

Hence, with the launch of two new products: Micro ECO and Mezzo ECO, manufacturers of dual chamber dispensing bottles are expanding the use of post-consumer recycled resin (PCR) in their airless line, expanding the dual chamber dispensing bottles market size.

Get the data you need at a Fraction of the cost

Personalize your report by choosing insights you need
and save 40%!

Start-up Analysis

The market survey of Dual chamber dispensing bottles explains that consumers are demanding product packaging with every feature. They require product packaging that is convenient, easy to use, eco-friendly and reusable. Hence, start-up companies are developing creative innovations on several packaging products, such as 3D technology, including dual chamber dispensing bottles.
  • Ethimedix is a Swiss medical device company that has developed a smart bottle for dispensing oral opioids such as drinkable liquid morphine. The product is programmable, tamper-proof, portable, and uses biometric authentication of the caregiver and patient. It prevents accidental overdose by only dispensing authorized amounts and is aimed at hospital and outpatient settings. The target segments for this product are cancer, HIV, palliative care, and post-operative pain treatment.
  • Rudra Labs - It develops smart hardware plugins for OEMs to build connected devices for their consumers. Its product comes in three variants first is to measure baby feed patterns via a Load-cell based coaster, the second to manufacture smart water bottles, and the third is designed with multiple sensors that can detect dispensers open/close, refill, dispensing, and when to replenish. All three variants come with a full battery of customizable firmware, IoT cloud, and native applications options and are available in both standard Wi-Fi and NB-IOT variants.

Competitive Scenario

Due to the availability of a wide variety of dispensing systems, the dual chamber dispensing bottle market share is highly competitive. Key manufacturers are coming up with creative innovations that are likely to cater to different applications across various industrial verticals.

Key Market Developments:

  • In May 2021, Berlin Packaging acquired Raepak Limited (one of the leading suppliers of pumps, dispensers, sprayers, airless bottles, roll-on bottles, tubes, and other packaging containers). Berlin Packaging will be able to expand its portfolio in the cosmetics and personal care sectors as a result of the acquisition of Raepak.
  • In January 2021, Silgan dispensing systems and bondi sands collaborated to launch "Pure Self-Tanning Foaming Water." This product uses Silgan Dispensing's EZ'R foamer, a first-to-market foam application that is 100% recyclable in polypropylene (PP) streams and is entirely made of plastic components.
  • In March 2020, The US-based Aptar created the world’s first certified recycled plastic beauty packaging that is certified by the international sustainability and carbon certification (ISCC) and is used in the relaunch of REN clean skincare’s moisturizer, EVERCALM global protection day cream.

Key market participants:

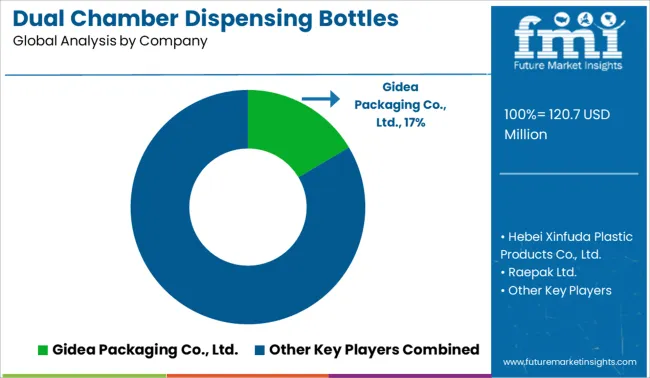
  • Ningbo Gidea Packaging Co. Ltd. - The company produces cosmetic and cleaning packages which supply to cosmetic, medicine, health care, household chemical and cleaning products manufacturers.
  • Hebei Xinfuda Plastic Products Co. Ltd. - The company focuses on plastic peterinary container like various liquid bottle & powder jars. They meet the GMP Standard and are equipped with high precision injection moulding machines, filling equipment, cap liner inserting machine, pad printing machine and thermal transfer printing machine (most machines are imported overseas). Xinfuda enhances mechanization and automatization degree which make Quality First real.
  • Raepak Ltd. - It is a global supplier of plastic packaging: distributing and manufacturing recyclable plastic bottles, jars, biopolymer flexible tubes, closures, caps and dispensing pumps, covering commercial & domestic product markets.
  • Amigo Laboratories - The company guarantees best quality of RTSoft products and solutions both by uniquely qualified engineering staff and deep expertise in different sectors, such as energy industry, nuclear industry, oil and gas, metallurgy, transportation, instrumentation, IT and telecommunication, building automation and utilities, aerospace.
  • O.Berk Co. LLC - It is a leading supplier of both custom and stock packaging: glass and plastic containers, a variety of closure options, as well as decorating services. Their entire team of packaging professionals specializes in a particular market segment: beauty/personal care, food/beverage, pharmaceuticals/healthcare, or household/industrial. They can provide, source, or create the container and closure that best satisfies the customer's product requirements.

Key Players

  • Quadpack Industries SA
  • Shanghai Hopeck Packaging Co. Ltd.
  • Shijiazhuang Xinfuda Medical Packaging Co. Ltd.
  • Berlin Packaging UK Ltd.
  • Bettix Ltd.
  • Hangzhou Luzern Packaging Trading Co. Ltd.
  • Matsa Group Ltd.
  • Cospack America Corp.

Report Scope

Report Attribute Details
Growth Rate CAGR of 3.9% from 2022 to 2032
Base year for estimation 2021
Historical data 2017 - 2021
Forecast period 2022 - 2032
Quantitative units Revenue in USD million and CAGR from 2022 to 2032
Report coverage Revenue forecast, volume forecast, company ranking, competitive landscape, growth factors, and trends, Pricing Analysis,
Segments covered Material, Capacity Type, End User, and Region.
Regional scope North America; Western Europe, Eastern Europe, Middle East, Africa, ASEAN, South Asia, Rest of Asia, Australia and New Zealand
Country scope USA; Canada; Mexico; Germany; UK; France; Italy; Spain; Russia; Belgium; Poland; Czech Republic; China; India; Japan; Australia; Brazil; Argentina; Colombia; Saudi Arabia; UAE; Iran; South Africa
Key companies profiled Ningbo Gidea Packaging Co. Ltd., Hebei Xinfuda Plastic Products Co. Ltd., Raepak Ltd., Amigo Laboratories, O.Berk Co. LLC, Quadpack Industries SA, Shanghai Hopeck Packaging Co. Ltd., Shijiazhuang Xinfuda Medical Packaging Co. Ltd., Berlin Packaging UK Ltd., Bettix Ltd., Hangzhou Luzern Packaging Trading Co. Ltd., Matsa Group Ltd., Cospack America Corp., etc.
Customization scope Free report customization (equivalent to up to 8 analysts working days) with purchase. Addition or alteration to country, regional & segment scope.
Pricing and purchase options Avail customized purchase options to meet your exact research needs.

Key Segments -

By Material:

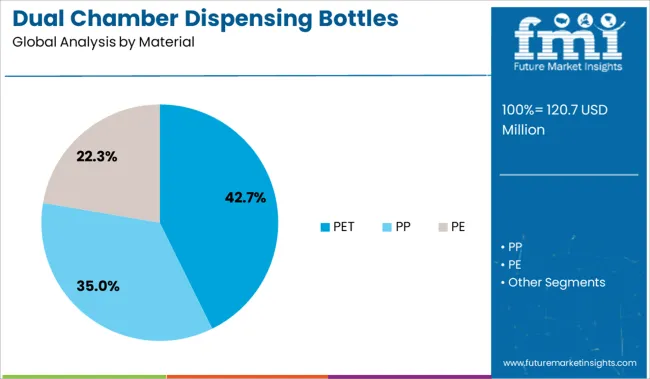
  • PET
  • PP
  • PE

By Capacity:

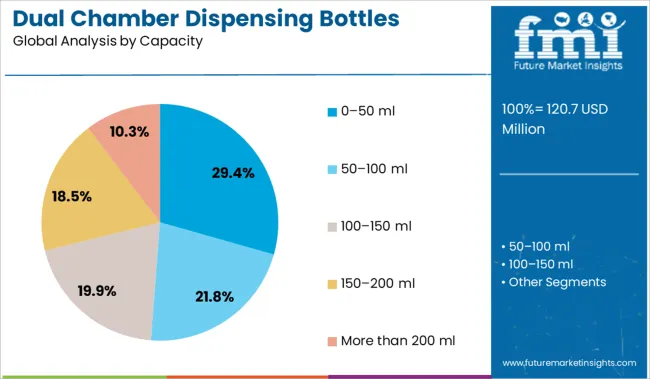
  • 0-50 ml
  • 50-100 ml
  • 100-150 ml
  • 150-200 ml
  • More than 200 ml

By End User:

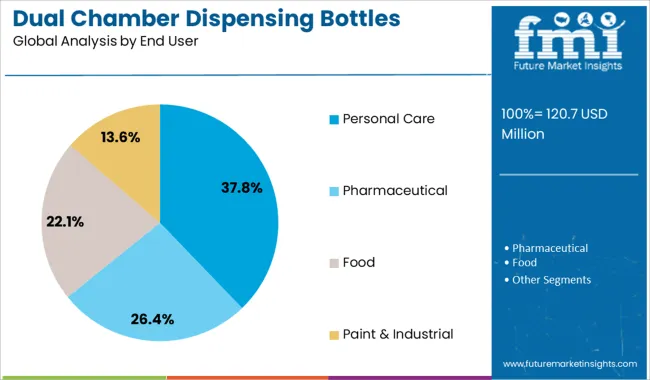
  • Pharmaceutical
  • Food
  • Paint & Industrial
  • Personal Care

By Region:

  • North America
  • Latin America
  • Asia Pacific
  • MEA
  • Europe

Frequently Asked Questions

What is the Growth Outlook for Dual Chamber Dispensing Bottles Market?

The market is likely to register a CAGR of 3.9% through 2032.

What is the Current Valuation of the Dual Chamber Dispensing Bottles Market?

The market is currently valued at US$ 107.6 Mn in 2022.

How is the Future of the Dual Chamber Dispensing Bottles Market?

The market is likely to grow to a valuation of US$ 157.7 Mn by 2032.

Which is the Leading Region in the Market?

North America is likely to be a leading market during the forecast period.

Table of Content

1. Executive Summary

    1.1. Global Market Outlook

    1.2. Demand-side Trends

    1.3. Supply-side Trends

    1.4. Technology Roadmap Analysis

    1.5. Analysis and Recommendations

2. Market Overview

    2.1. Market Coverage / Taxonomy

    2.2. Market Definition / Scope / Limitations

3. Market Background

    3.1. Market Dynamics

        3.1.1. Drivers

        3.1.2. Restraints

        3.1.3. Opportunity

        3.1.4. Trends

    3.2. Scenario Forecast

        3.2.1. Demand in Optimistic Scenario

        3.2.2. Demand in Likely Scenario

        3.2.3. Demand in Conservative Scenario

    3.3. Opportunity Map Analysis

    3.4. Investment Feasibility Matrix

    3.5. PESTLE and Porter’s Analysis

    3.6. Regulatory Landscape

        3.6.1. By Key Regions

        3.6.2. By Key Countries

    3.7. Regional Parent Market Outlook

4. Global Dual Chamber Dispensing Bottles Market Analysis 2017-2021 and Forecast, 2022-2032

    4.1. Historical Market Size Value (US$ Mn) Analysis, 2017-2021

    4.2. Current and Future Market Size Value (US$ Mn) Projections, 2022-2032

        4.2.1. Y-o-Y Growth Trend Analysis

        4.2.2. Absolute $ Opportunity Analysis

5. Global Dual Chamber Dispensing Bottles Market Analysis 2017-2021 and Forecast 2022-2032, By Material Used

    5.1. Introduction / Key Findings

    5.2. Historical Market Size Value (US$ Mn) Analysis By Material Used, 2017-2021

    5.3. Current and Future Market Size Value (US$ Mn) Analysis and Forecast By Material Used, 2022-2032

        5.3.1. Polypropylene

        5.3.2. Polyethylene

        5.3.3. Polyethylene Terephthalate

        5.3.4. Other Material Used

    5.4. Y-o-Y Growth Trend Analysis By Material Used, 2017-2021

    5.5. Absolute $ Opportunity Analysis By Material Used, 2022-2032

6. Global Dual Chamber Dispensing Bottles Market Analysis 2017-2021 and Forecast 2022-2032, By End Use

    6.1. Introduction / Key Findings

    6.2. Historical Market Size Value (US$ Mn) Analysis By End Use , 2017-2021

    6.3. Current and Future Market Size Value (US$ Mn) Analysis and Forecast By End Use , 2022-2032

        6.3.1. Pharmaceutical

        6.3.2. Food

        6.3.3. Paint and Industrial

        6.3.4. Personal Care

        6.3.5. Others

    6.4. Y-o-Y Growth Trend Analysis By End Use , 2017-2021

    6.5. Absolute $ Opportunity Analysis By End Use , 2022-2032

7. Global Dual Chamber Dispensing Bottles Market Analysis 2017-2021 and Forecast 2022-2032, By Region

    7.1. Introduction

    7.2. Historical Market Size Value (US$ Mn) Analysis By Region, 2017-2021

    7.3. Current Market Size Value (US$ Mn) Analysis and Forecast By Region, 2022-2032

        7.3.1. North America

        7.3.2. Latin America

        7.3.3. Europe

        7.3.4. South Asia

        7.3.5. East Asia

        7.3.6. Oceania

        7.3.7. MEA

    7.4. Market Attractiveness Analysis By Region

8. North America Dual Chamber Dispensing Bottles Market Analysis 2017-2021 and Forecast 2022-2032, By Country

    8.1. Historical Market Size Value (US$ Mn) Trend Analysis By Market Taxonomy, 2017-2021

    8.2. Market Size Value (US$ Mn) Forecast By Market Taxonomy, 2022-2032

        8.2.1. By Country

            8.2.1.1. U.S.

            8.2.1.2. Canada

        8.2.2. By Material Used

        8.2.3. By Capacity Type

        8.2.4. By End Use

    8.3. Market Attractiveness Analysis

        8.3.1. By Country

        8.3.2. By Material Used

        8.3.3. By Capacity Type

        8.3.4. By End Use

    8.4. Key Takeaways

9. Latin America Dual Chamber Dispensing Bottles Market Analysis 2017-2021 and Forecast 2022-2032, By Country

    9.1. Historical Market Size Value (US$ Mn) Trend Analysis By Market Taxonomy, 2017-2021

    9.2. Market Size Value (US$ Mn) Forecast By Market Taxonomy, 2022-2032

        9.2.1. By Country

            9.2.1.1. Brazil

            9.2.1.2. Mexico

            9.2.1.3. Rest of Latin America

        9.2.2. By Material Used

        9.2.3. By Capacity Type

        9.2.4. By End Use

    9.3. Market Attractiveness Analysis

        9.3.1. By Country

        9.3.2. By Material Used

        9.3.3. By Capacity Type

        9.3.4. By End Use

    9.4. Key Takeaways

10. Europe Dual Chamber Dispensing Bottles Market Analysis 2017-2021 and Forecast 2022-2032, By Country

    10.1. Historical Market Size Value (US$ Mn) Trend Analysis By Market Taxonomy, 2017-2021

    10.2. Market Size Value (US$ Mn) Forecast By Market Taxonomy, 2022-2032

        10.2.1. By Country

            10.2.1.1. Germany

            10.2.1.2. U.K.

            10.2.1.3. France

            10.2.1.4. Spain

            10.2.1.5. Italy

            10.2.1.6. Rest of Europe

        10.2.2. By Material Used

        10.2.3. By Capacity Type

        10.2.4. By End Use

    10.3. Market Attractiveness Analysis

        10.3.1. By Country

        10.3.2. By Material Used

        10.3.3. By Capacity Type

        10.3.4. By End Use

    10.4. Key Takeaways

11. South Asia Dual Chamber Dispensing Bottles Market Analysis 2017-2021 and Forecast 2022-2032, By Country

    11.1. Historical Market Size Value (US$ Mn) Trend Analysis By Market Taxonomy, 2017-2021

    11.2. Market Size Value (US$ Mn) Forecast By Market Taxonomy, 2022-2032

        11.2.1. By Country

            11.2.1.1. India

            11.2.1.2. Malaysia

            11.2.1.3. Singapore

            11.2.1.4. Thailand

            11.2.1.5. Rest of South Asia

        11.2.2. By Material Used

        11.2.3. By Capacity Type

        11.2.4. By End Use

    11.3. Market Attractiveness Analysis

        11.3.1. By Country

        11.3.2. By Material Used

        11.3.3. By Capacity Type

        11.3.4. By End Use

    11.4. Key Takeaways

12. East Asia Dual Chamber Dispensing Bottles Market Analysis 2017-2021 and Forecast 2022-2032, By Country

    12.1. Historical Market Size Value (US$ Mn) Trend Analysis By Market Taxonomy, 2017-2021

    12.2. Market Size Value (US$ Mn) Forecast By Market Taxonomy, 2022-2032

        12.2.1. By Country

            12.2.1.1. China

            12.2.1.2. Japan

            12.2.1.3. South Korea

        12.2.2. By Material Used

        12.2.3. By Capacity Type

        12.2.4. By End Use

    12.3. Market Attractiveness Analysis

        12.3.1. By Country

        12.3.2. By Material Used

        12.3.3. By Capacity Type

        12.3.4. By End Use

    12.4. Key Takeaways

13. Oceania Dual Chamber Dispensing Bottles Market Analysis 2017-2021 and Forecast 2022-2032, By Country

    13.1. Historical Market Size Value (US$ Mn) Trend Analysis By Market Taxonomy, 2017-2021

    13.2. Market Size Value (US$ Mn) Forecast By Market Taxonomy, 2022-2032

        13.2.1. By Country

            13.2.1.1. Australia

            13.2.1.2. New Zealand

        13.2.2. By Material Used

        13.2.3. By Capacity Type

        13.2.4. By End Use

    13.3. Market Attractiveness Analysis

        13.3.1. By Country

        13.3.2. By Material Used

        13.3.3. By Capacity Type

        13.3.4. By End Use

    13.4. Key Takeaways

14. MEA Dual Chamber Dispensing Bottles Market Analysis 2017-2021 and Forecast 2022-2032, By Country

    14.1. Historical Market Size Value (US$ Mn) Trend Analysis By Market Taxonomy, 2017-2021

    14.2. Market Size Value (US$ Mn) Forecast By Market Taxonomy, 2022-2032

        14.2.1. By Country

            14.2.1.1. GCC Countries

            14.2.1.2. South Africa

            14.2.1.3. Israel

            14.2.1.4. Rest of MEA

        14.2.2. By Material Used

        14.2.3. By Capacity Type

        14.2.4. By End Use

    14.3. Market Attractiveness Analysis

        14.3.1. By Country

        14.3.2. By Material Used

        14.3.3. By Capacity Type

        14.3.4. By End Use

    14.4. Key Takeaways

15. Key Countries Dual Chamber Dispensing Bottles Market Analysis

    15.1. U.S.

        15.1.1. Pricing Analysis

        15.1.2. Market Share Analysis, 2021

            15.1.2.1. By Material Used

            15.1.2.2. By Capacity Type

            15.1.2.3. By End Use

    15.2. Canada

        15.2.1. Pricing Analysis

        15.2.2. Market Share Analysis, 2021

            15.2.2.1. By Material Used

            15.2.2.2. By Capacity Type

            15.2.2.3. By End Use

    15.3. Brazil

        15.3.1. Pricing Analysis

        15.3.2. Market Share Analysis, 2021

            15.3.2.1. By Material Used

            15.3.2.2. By Capacity Type

            15.3.2.3. By End Use

    15.4. Mexico

        15.4.1. Pricing Analysis

        15.4.2. Market Share Analysis, 2021

            15.4.2.1. By Material Used

            15.4.2.2. By Capacity Type

            15.4.2.3. By End Use

    15.5. Germany

        15.5.1. Pricing Analysis

        15.5.2. Market Share Analysis, 2021

            15.5.2.1. By Material Used

            15.5.2.2. By Capacity Type

            15.5.2.3. By End Use

    15.6. U.K.

        15.6.1. Pricing Analysis

        15.6.2. Market Share Analysis, 2021

            15.6.2.1. By Material Used

            15.6.2.2. By Capacity Type

            15.6.2.3. By End Use

    15.7. France

        15.7.1. Pricing Analysis

        15.7.2. Market Share Analysis, 2021

            15.7.2.1. By Material Used

            15.7.2.2. By Capacity Type

            15.7.2.3. By End Use

    15.8. Spain

        15.8.1. Pricing Analysis

        15.8.2. Market Share Analysis, 2021

            15.8.2.1. By Material Used

            15.8.2.2. By Capacity Type

            15.8.2.3. By End Use

    15.9. Italy

        15.9.1. Pricing Analysis

        15.9.2. Market Share Analysis, 2021

            15.9.2.1. By Material Used

            15.9.2.2. By Capacity Type

            15.9.2.3. By End Use

    15.10. India

        15.10.1. Pricing Analysis

        15.10.2. Market Share Analysis, 2021

            15.10.2.1. By Material Used

            15.10.2.2. By Capacity Type

            15.10.2.3. By End Use

    15.11. Malaysia

        15.11.1. Pricing Analysis

        15.11.2. Market Share Analysis, 2021

            15.11.2.1. By Material Used

            15.11.2.2. By Capacity Type

            15.11.2.3. By End Use

    15.12. Singapore

        15.12.1. Pricing Analysis

        15.12.2. Market Share Analysis, 2021

            15.12.2.1. By Material Used

            15.12.2.2. By Capacity Type

            15.12.2.3. By End Use

    15.13. Thailand

        15.13.1. Pricing Analysis

        15.13.2. Market Share Analysis, 2021

            15.13.2.1. By Material Used

            15.13.2.2. By Capacity Type

            15.13.2.3. By End Use

    15.14. China

        15.14.1. Pricing Analysis

        15.14.2. Market Share Analysis, 2021

            15.14.2.1. By Material Used

            15.14.2.2. By Capacity Type

            15.14.2.3. By End Use

    15.15. Japan

        15.15.1. Pricing Analysis

        15.15.2. Market Share Analysis, 2021

            15.15.2.1. By Material Used

            15.15.2.2. By Capacity Type

            15.15.2.3. By End Use

    15.16. South Korea

        15.16.1. Pricing Analysis

        15.16.2. Market Share Analysis, 2021

            15.16.2.1. By Material Used

            15.16.2.2. By Capacity Type

            15.16.2.3. By End Use

    15.17. Australia

        15.17.1. Pricing Analysis

        15.17.2. Market Share Analysis, 2021

            15.17.2.1. By Material Used

            15.17.2.2. By Capacity Type

            15.17.2.3. By End Use

    15.18. New Zealand

        15.18.1. Pricing Analysis

        15.18.2. Market Share Analysis, 2021

            15.18.2.1. By Material Used

            15.18.2.2. By Capacity Type

            15.18.2.3. By End Use

    15.19. GCC Countries

        15.19.1. Pricing Analysis

        15.19.2. Market Share Analysis, 2021

            15.19.2.1. By Material Used

            15.19.2.2. By Capacity Type

            15.19.2.3. By End Use

    15.20. South Africa

        15.20.1. Pricing Analysis

        15.20.2. Market Share Analysis, 2021

            15.20.2.1. By Material Used

            15.20.2.2. By Capacity Type

            15.20.2.3. By End Use

    15.21. Israel

        15.21.1. Pricing Analysis

        15.21.2. Market Share Analysis, 2021

            15.21.2.1. By Material Used

            15.21.2.2. By Capacity Type

            15.21.2.3. By End Use

16. Market Structure Analysis

    16.1. Competition Dashboard

    16.2. Competition Benchmarking

    16.3. Market Share Analysis of Top Players

        16.3.1. By Regional

        16.3.2. By Material Used

        16.3.3. By Capacity Type

        16.3.4. By End Use

17. Competition Analysis

    17.1. Competition Deep Dive

        17.1.1. Gidea Packaging Co., Ltd.

            17.1.1.1. Overview

            17.1.1.2. Product Portfolio

            17.1.1.3. Profitability by Market Segments

            17.1.1.4. Sales Footprint

            17.1.1.5. Strategy Overview

                17.1.1.5.1. Marketing Strategy

        17.1.2. Hebei Xinfuda Plastic Products Co., Ltd.

            17.1.2.1. Overview

            17.1.2.2. Product Portfolio

            17.1.2.3. Profitability by Market Segments

            17.1.2.4. Sales Footprint

            17.1.2.5. Strategy Overview

                17.1.2.5.1. Marketing Strategy

        17.1.3. Raepak Ltd.

            17.1.3.1. Overview

            17.1.3.2. Product Portfolio

            17.1.3.3. Profitability by Market Segments

            17.1.3.4. Sales Footprint

            17.1.3.5. Strategy Overview

                17.1.3.5.1. Marketing Strategy

        17.1.4. O.Berk Company, LLC

            17.1.4.1. Overview

            17.1.4.2. Product Portfolio

            17.1.4.3. Profitability by Market Segments

            17.1.4.4. Sales Footprint

            17.1.4.5. Strategy Overview

                17.1.4.5.1. Marketing Strategy

        17.1.5. Amigo Laboratories

            17.1.5.1. Overview

            17.1.5.2. Product Portfolio

            17.1.5.3. Profitability by Market Segments

            17.1.5.4. Sales Footprint

            17.1.5.5. Strategy Overview

                17.1.5.5.1. Marketing Strategy

        17.1.6. Shijiazhuang Xinfuda Medical Packaging Co Ltd

            17.1.6.1. Overview

            17.1.6.2. Product Portfolio

            17.1.6.3. Profitability by Market Segments

            17.1.6.4. Sales Footprint

            17.1.6.5. Strategy Overview

                17.1.6.5.1. Marketing Strategy

        17.1.7. Shanghai Hopeck Packaging Co., Ltd.

            17.1.7.1. Overview

            17.1.7.2. Product Portfolio

            17.1.7.3. Profitability by Market Segments

            17.1.7.4. Sales Footprint

            17.1.7.5. Strategy Overview

                17.1.7.5.1. Marketing Strategy

        17.1.8. Quadpack Spain Slu

            17.1.8.1. Overview

            17.1.8.2. Product Portfolio

            17.1.8.3. Profitability by Market Segments

            17.1.8.4. Sales Footprint

            17.1.8.5. Strategy Overview

                17.1.8.5.1. Marketing Strategy

        17.1.9. Cospack America Corp.

            17.1.9.1. Overview

            17.1.9.2. Product Portfolio

            17.1.9.3. Profitability by Market Segments

            17.1.9.4. Sales Footprint

            17.1.9.5. Strategy Overview

                17.1.9.5.1. Marketing Strategy

        17.1.10. DEMEI Industrial Limited

            17.1.10.1. Overview

            17.1.10.2. Product Portfolio

            17.1.10.3. Profitability by Market Segments

            17.1.10.4. Sales Footprint

            17.1.10.5. Strategy Overview

                17.1.10.5.1. Marketing Strategy

18. Assumptions & Acronyms Used

19. Research Methodology

Don't pay for what you don't need

Customize your report by selecting specific countries or regions and save 30%!

List of Tables

Table 1: Global Dual Chamber Dispensing Bottles Market Value (US$ Mn) Forecast by Region, 2017-2032

Table 2: Global Dual Chamber Dispensing Bottles Market Value (US$ Mn) Forecast by Material Used, 2017-2032

Table 3: Global Dual Chamber Dispensing Bottles Market Value (US$ Mn) Forecast by Capacity Type, 2017-2032

Table 4: Global Dual Chamber Dispensing Bottles Market Value (US$ Mn) Forecast by End Use , 2017-2032

Table 5: North America Dual Chamber Dispensing Bottles Market Value (US$ Mn) Forecast by Country, 2017-2032

Table 6: North America Dual Chamber Dispensing Bottles Market Value (US$ Mn) Forecast by Material Used, 2017-2032

Table 7: North America Dual Chamber Dispensing Bottles Market Value (US$ Mn) Forecast by Capacity Type, 2017-2032

Table 8: North America Dual Chamber Dispensing Bottles Market Value (US$ Mn) Forecast by End Use , 2017-2032

Table 9: Latin America Dual Chamber Dispensing Bottles Market Value (US$ Mn) Forecast by Country, 2017-2032

Table 10: Latin America Dual Chamber Dispensing Bottles Market Value (US$ Mn) Forecast by Material Used, 2017-2032

Table 11: Latin America Dual Chamber Dispensing Bottles Market Value (US$ Mn) Forecast by Capacity Type, 2017-2032

Table 12: Latin America Dual Chamber Dispensing Bottles Market Value (US$ Mn) Forecast by End Use , 2017-2032

Table 13: Europe Dual Chamber Dispensing Bottles Market Value (US$ Mn) Forecast by Country, 2017-2032

Table 14: Europe Dual Chamber Dispensing Bottles Market Value (US$ Mn) Forecast by Material Used, 2017-2032

Table 15: Europe Dual Chamber Dispensing Bottles Market Value (US$ Mn) Forecast by Capacity Type, 2017-2032

Table 16: Europe Dual Chamber Dispensing Bottles Market Value (US$ Mn) Forecast by End Use , 2017-2032

Table 17: South Asia Dual Chamber Dispensing Bottles Market Value (US$ Mn) Forecast by Country, 2017-2032

Table 18: South Asia Dual Chamber Dispensing Bottles Market Value (US$ Mn) Forecast by Material Used, 2017-2032

Table 19: South Asia Dual Chamber Dispensing Bottles Market Value (US$ Mn) Forecast by Capacity Type, 2017-2032

Table 20: South Asia Dual Chamber Dispensing Bottles Market Value (US$ Mn) Forecast by End Use , 2017-2032

Table 21: East Asia Dual Chamber Dispensing Bottles Market Value (US$ Mn) Forecast by Country, 2017-2032

Table 22: East Asia Dual Chamber Dispensing Bottles Market Value (US$ Mn) Forecast by Material Used, 2017-2032

Table 23: East Asia Dual Chamber Dispensing Bottles Market Value (US$ Mn) Forecast by Capacity Type, 2017-2032

Table 24: East Asia Dual Chamber Dispensing Bottles Market Value (US$ Mn) Forecast by End Use , 2017-2032

Table 25: Oceania Dual Chamber Dispensing Bottles Market Value (US$ Mn) Forecast by Country, 2017-2032

Table 26: Oceania Dual Chamber Dispensing Bottles Market Value (US$ Mn) Forecast by Material Used, 2017-2032

Table 27: Oceania Dual Chamber Dispensing Bottles Market Value (US$ Mn) Forecast by Capacity Type, 2017-2032

Table 28: Oceania Dual Chamber Dispensing Bottles Market Value (US$ Mn) Forecast by End Use , 2017-2032

Table 29: MEA Dual Chamber Dispensing Bottles Market Value (US$ Mn) Forecast by Country, 2017-2032

Table 30: MEA Dual Chamber Dispensing Bottles Market Value (US$ Mn) Forecast by Material Used, 2017-2032

Table 31: MEA Dual Chamber Dispensing Bottles Market Value (US$ Mn) Forecast by Capacity Type, 2017-2032

Table 32: MEA Dual Chamber Dispensing Bottles Market Value (US$ Mn) Forecast by End Use , 2017-2032
Ismail Sutaria
Ismail Sutaria

Principal Consultant

Talk to Analyst

Find your sweet spots for generating winning opportunities in this market.

List of Charts

Figure 1: Global Dual Chamber Dispensing Bottles Market Value (US$ Mn) by Material Used, 2022-2032

Figure 2: Global Dual Chamber Dispensing Bottles Market Value (US$ Mn) by Capacity Type, 2022-2032

Figure 3: Global Dual Chamber Dispensing Bottles Market Value (US$ Mn) by End Use , 2022-2032

Figure 4: Global Dual Chamber Dispensing Bottles Market Value (US$ Mn) by Region, 2022-2032

Figure 5: Global Dual Chamber Dispensing Bottles Market Value (US$ Mn) Analysis by Region, 2017-2032

Figure 6: Global Dual Chamber Dispensing Bottles Market Value Share (%) and BPS Analysis by Region, 2022-2032

Figure 7: Global Dual Chamber Dispensing Bottles Market Y-o-Y Growth (%) Projections by Region, 2022-2032

Figure 8: Global Dual Chamber Dispensing Bottles Market Value (US$ Mn) Analysis by Material Used, 2017-2032

Figure 9: Global Dual Chamber Dispensing Bottles Market Value Share (%) and BPS Analysis by Material Used, 2022-2032

Figure 10: Global Dual Chamber Dispensing Bottles Market Y-o-Y Growth (%) Projections by Material Used, 2022-2032

Figure 11: Global Dual Chamber Dispensing Bottles Market Value (US$ Mn) Analysis by Capacity Type, 2017-2032

Figure 12: Global Dual Chamber Dispensing Bottles Market Value Share (%) and BPS Analysis by Capacity Type, 2022-2032

Figure 13: Global Dual Chamber Dispensing Bottles Market Y-o-Y Growth (%) Projections by Capacity Type, 2022-2032

Figure 14: Global Dual Chamber Dispensing Bottles Market Value (US$ Mn) Analysis by End Use , 2017-2032

Figure 15: Global Dual Chamber Dispensing Bottles Market Value Share (%) and BPS Analysis by End Use , 2022-2032

Figure 16: Global Dual Chamber Dispensing Bottles Market Y-o-Y Growth (%) Projections by End Use , 2022-2032

Figure 17: Global Dual Chamber Dispensing Bottles Market Attractiveness by Material Used, 2022-2032

Figure 18: Global Dual Chamber Dispensing Bottles Market Attractiveness by Capacity Type, 2022-2032

Figure 19: Global Dual Chamber Dispensing Bottles Market Attractiveness by End Use , 2022-2032

Figure 20: Global Dual Chamber Dispensing Bottles Market Attractiveness by Region, 2022-2032

Figure 21: North America Dual Chamber Dispensing Bottles Market Value (US$ Mn) by Material Used, 2022-2032

Figure 22: North America Dual Chamber Dispensing Bottles Market Value (US$ Mn) by Capacity Type, 2022-2032

Figure 23: North America Dual Chamber Dispensing Bottles Market Value (US$ Mn) by End Use , 2022-2032

Figure 24: North America Dual Chamber Dispensing Bottles Market Value (US$ Mn) by Country, 2022-2032

Figure 25: North America Dual Chamber Dispensing Bottles Market Value (US$ Mn) Analysis by Country, 2017-2032

Figure 26: North America Dual Chamber Dispensing Bottles Market Value Share (%) and BPS Analysis by Country, 2022-2032

Figure 27: North America Dual Chamber Dispensing Bottles Market Y-o-Y Growth (%) Projections by Country, 2022-2032

Figure 28: North America Dual Chamber Dispensing Bottles Market Value (US$ Mn) Analysis by Material Used, 2017-2032

Figure 29: North America Dual Chamber Dispensing Bottles Market Value Share (%) and BPS Analysis by Material Used, 2022-2032

Figure 30: North America Dual Chamber Dispensing Bottles Market Y-o-Y Growth (%) Projections by Material Used, 2022-2032

Figure 31: North America Dual Chamber Dispensing Bottles Market Value (US$ Mn) Analysis by Capacity Type, 2017-2032

Figure 32: North America Dual Chamber Dispensing Bottles Market Value Share (%) and BPS Analysis by Capacity Type, 2022-2032

Figure 33: North America Dual Chamber Dispensing Bottles Market Y-o-Y Growth (%) Projections by Capacity Type, 2022-2032

Figure 34: North America Dual Chamber Dispensing Bottles Market Value (US$ Mn) Analysis by End Use , 2017-2032

Figure 35: North America Dual Chamber Dispensing Bottles Market Value Share (%) and BPS Analysis by End Use , 2022-2032

Figure 36: North America Dual Chamber Dispensing Bottles Market Y-o-Y Growth (%) Projections by End Use , 2022-2032

Figure 37: North America Dual Chamber Dispensing Bottles Market Attractiveness by Material Used, 2022-2032

Figure 38: North America Dual Chamber Dispensing Bottles Market Attractiveness by Capacity Type, 2022-2032

Figure 39: North America Dual Chamber Dispensing Bottles Market Attractiveness by End Use , 2022-2032

Figure 40: North America Dual Chamber Dispensing Bottles Market Attractiveness by Country, 2022-2032

Figure 41: Latin America Dual Chamber Dispensing Bottles Market Value (US$ Mn) by Material Used, 2022-2032

Figure 42: Latin America Dual Chamber Dispensing Bottles Market Value (US$ Mn) by Capacity Type, 2022-2032

Figure 43: Latin America Dual Chamber Dispensing Bottles Market Value (US$ Mn) by End Use , 2022-2032

Figure 44: Latin America Dual Chamber Dispensing Bottles Market Value (US$ Mn) by Country, 2022-2032

Figure 45: Latin America Dual Chamber Dispensing Bottles Market Value (US$ Mn) Analysis by Country, 2017-2032

Figure 46: Latin America Dual Chamber Dispensing Bottles Market Value Share (%) and BPS Analysis by Country, 2022-2032

Figure 47: Latin America Dual Chamber Dispensing Bottles Market Y-o-Y Growth (%) Projections by Country, 2022-2032

Figure 48: Latin America Dual Chamber Dispensing Bottles Market Value (US$ Mn) Analysis by Material Used, 2017-2032

Figure 49: Latin America Dual Chamber Dispensing Bottles Market Value Share (%) and BPS Analysis by Material Used, 2022-2032

Figure 50: Latin America Dual Chamber Dispensing Bottles Market Y-o-Y Growth (%) Projections by Material Used, 2022-2032

Figure 51: Latin America Dual Chamber Dispensing Bottles Market Value (US$ Mn) Analysis by Capacity Type, 2017-2032

Figure 52: Latin America Dual Chamber Dispensing Bottles Market Value Share (%) and BPS Analysis by Capacity Type, 2022-2032

Figure 53: Latin America Dual Chamber Dispensing Bottles Market Y-o-Y Growth (%) Projections by Capacity Type, 2022-2032

Figure 54: Latin America Dual Chamber Dispensing Bottles Market Value (US$ Mn) Analysis by End Use , 2017-2032

Figure 55: Latin America Dual Chamber Dispensing Bottles Market Value Share (%) and BPS Analysis by End Use , 2022-2032

Figure 56: Latin America Dual Chamber Dispensing Bottles Market Y-o-Y Growth (%) Projections by End Use , 2022-2032

Figure 57: Latin America Dual Chamber Dispensing Bottles Market Attractiveness by Material Used, 2022-2032

Figure 58: Latin America Dual Chamber Dispensing Bottles Market Attractiveness by Capacity Type, 2022-2032

Figure 59: Latin America Dual Chamber Dispensing Bottles Market Attractiveness by End Use , 2022-2032

Figure 60: Latin America Dual Chamber Dispensing Bottles Market Attractiveness by Country, 2022-2032

Figure 61: Europe Dual Chamber Dispensing Bottles Market Value (US$ Mn) by Material Used, 2022-2032

Figure 62: Europe Dual Chamber Dispensing Bottles Market Value (US$ Mn) by Capacity Type, 2022-2032

Figure 63: Europe Dual Chamber Dispensing Bottles Market Value (US$ Mn) by End Use , 2022-2032

Figure 64: Europe Dual Chamber Dispensing Bottles Market Value (US$ Mn) by Country, 2022-2032

Figure 65: Europe Dual Chamber Dispensing Bottles Market Value (US$ Mn) Analysis by Country, 2017-2032

Figure 66: Europe Dual Chamber Dispensing Bottles Market Value Share (%) and BPS Analysis by Country, 2022-2032

Figure 67: Europe Dual Chamber Dispensing Bottles Market Y-o-Y Growth (%) Projections by Country, 2022-2032

Figure 68: Europe Dual Chamber Dispensing Bottles Market Value (US$ Mn) Analysis by Material Used, 2017-2032

Figure 69: Europe Dual Chamber Dispensing Bottles Market Value Share (%) and BPS Analysis by Material Used, 2022-2032

Figure 70: Europe Dual Chamber Dispensing Bottles Market Y-o-Y Growth (%) Projections by Material Used, 2022-2032

Figure 71: Europe Dual Chamber Dispensing Bottles Market Value (US$ Mn) Analysis by Capacity Type, 2017-2032

Figure 72: Europe Dual Chamber Dispensing Bottles Market Value Share (%) and BPS Analysis by Capacity Type, 2022-2032

Figure 73: Europe Dual Chamber Dispensing Bottles Market Y-o-Y Growth (%) Projections by Capacity Type, 2022-2032

Figure 74: Europe Dual Chamber Dispensing Bottles Market Value (US$ Mn) Analysis by End Use , 2017-2032

Figure 75: Europe Dual Chamber Dispensing Bottles Market Value Share (%) and BPS Analysis by End Use , 2022-2032

Figure 76: Europe Dual Chamber Dispensing Bottles Market Y-o-Y Growth (%) Projections by End Use , 2022-2032

Figure 77: Europe Dual Chamber Dispensing Bottles Market Attractiveness by Material Used, 2022-2032

Figure 78: Europe Dual Chamber Dispensing Bottles Market Attractiveness by Capacity Type, 2022-2032

Figure 79: Europe Dual Chamber Dispensing Bottles Market Attractiveness by End Use , 2022-2032

Figure 80: Europe Dual Chamber Dispensing Bottles Market Attractiveness by Country, 2022-2032

Figure 81: South Asia Dual Chamber Dispensing Bottles Market Value (US$ Mn) by Material Used, 2022-2032

Figure 82: South Asia Dual Chamber Dispensing Bottles Market Value (US$ Mn) by Capacity Type, 2022-2032

Figure 83: South Asia Dual Chamber Dispensing Bottles Market Value (US$ Mn) by End Use , 2022-2032

Figure 84: South Asia Dual Chamber Dispensing Bottles Market Value (US$ Mn) by Country, 2022-2032

Figure 85: South Asia Dual Chamber Dispensing Bottles Market Value (US$ Mn) Analysis by Country, 2017-2032

Figure 86: South Asia Dual Chamber Dispensing Bottles Market Value Share (%) and BPS Analysis by Country, 2022-2032

Figure 87: South Asia Dual Chamber Dispensing Bottles Market Y-o-Y Growth (%) Projections by Country, 2022-2032

Figure 88: South Asia Dual Chamber Dispensing Bottles Market Value (US$ Mn) Analysis by Material Used, 2017-2032

Figure 89: South Asia Dual Chamber Dispensing Bottles Market Value Share (%) and BPS Analysis by Material Used, 2022-2032

Figure 90: South Asia Dual Chamber Dispensing Bottles Market Y-o-Y Growth (%) Projections by Material Used, 2022-2032

Figure 91: South Asia Dual Chamber Dispensing Bottles Market Value (US$ Mn) Analysis by Capacity Type, 2017-2032

Figure 92: South Asia Dual Chamber Dispensing Bottles Market Value Share (%) and BPS Analysis by Capacity Type, 2022-2032

Figure 93: South Asia Dual Chamber Dispensing Bottles Market Y-o-Y Growth (%) Projections by Capacity Type, 2022-2032

Figure 94: South Asia Dual Chamber Dispensing Bottles Market Value (US$ Mn) Analysis by End Use , 2017-2032

Figure 95: South Asia Dual Chamber Dispensing Bottles Market Value Share (%) and BPS Analysis by End Use , 2022-2032

Figure 96: South Asia Dual Chamber Dispensing Bottles Market Y-o-Y Growth (%) Projections by End Use , 2022-2032

Figure 97: South Asia Dual Chamber Dispensing Bottles Market Attractiveness by Material Used, 2022-2032

Figure 98: South Asia Dual Chamber Dispensing Bottles Market Attractiveness by Capacity Type, 2022-2032

Figure 99: South Asia Dual Chamber Dispensing Bottles Market Attractiveness by End Use , 2022-2032

Figure 100: South Asia Dual Chamber Dispensing Bottles Market Attractiveness by Country, 2022-2032

Figure 101: East Asia Dual Chamber Dispensing Bottles Market Value (US$ Mn) by Material Used, 2022-2032

Figure 102: East Asia Dual Chamber Dispensing Bottles Market Value (US$ Mn) by Capacity Type, 2022-2032

Figure 103: East Asia Dual Chamber Dispensing Bottles Market Value (US$ Mn) by End Use , 2022-2032

Figure 104: East Asia Dual Chamber Dispensing Bottles Market Value (US$ Mn) by Country, 2022-2032

Figure 105: East Asia Dual Chamber Dispensing Bottles Market Value (US$ Mn) Analysis by Country, 2017-2032

Figure 106: East Asia Dual Chamber Dispensing Bottles Market Value Share (%) and BPS Analysis by Country, 2022-2032

Figure 107: East Asia Dual Chamber Dispensing Bottles Market Y-o-Y Growth (%) Projections by Country, 2022-2032

Figure 108: East Asia Dual Chamber Dispensing Bottles Market Value (US$ Mn) Analysis by Material Used, 2017-2032

Figure 109: East Asia Dual Chamber Dispensing Bottles Market Value Share (%) and BPS Analysis by Material Used, 2022-2032

Figure 110: East Asia Dual Chamber Dispensing Bottles Market Y-o-Y Growth (%) Projections by Material Used, 2022-2032

Figure 111: East Asia Dual Chamber Dispensing Bottles Market Value (US$ Mn) Analysis by Capacity Type, 2017-2032

Figure 112: East Asia Dual Chamber Dispensing Bottles Market Value Share (%) and BPS Analysis by Capacity Type, 2022-2032

Figure 113: East Asia Dual Chamber Dispensing Bottles Market Y-o-Y Growth (%) Projections by Capacity Type, 2022-2032

Figure 114: East Asia Dual Chamber Dispensing Bottles Market Value (US$ Mn) Analysis by End Use , 2017-2032

Figure 115: East Asia Dual Chamber Dispensing Bottles Market Value Share (%) and BPS Analysis by End Use , 2022-2032

Figure 116: East Asia Dual Chamber Dispensing Bottles Market Y-o-Y Growth (%) Projections by End Use , 2022-2032

Figure 117: East Asia Dual Chamber Dispensing Bottles Market Attractiveness by Material Used, 2022-2032

Figure 118: East Asia Dual Chamber Dispensing Bottles Market Attractiveness by Capacity Type, 2022-2032

Figure 119: East Asia Dual Chamber Dispensing Bottles Market Attractiveness by End Use , 2022-2032

Figure 120: East Asia Dual Chamber Dispensing Bottles Market Attractiveness by Country, 2022-2032

Figure 121: Oceania Dual Chamber Dispensing Bottles Market Value (US$ Mn) by Material Used, 2022-2032

Figure 122: Oceania Dual Chamber Dispensing Bottles Market Value (US$ Mn) by Capacity Type, 2022-2032

Figure 123: Oceania Dual Chamber Dispensing Bottles Market Value (US$ Mn) by End Use , 2022-2032

Figure 124: Oceania Dual Chamber Dispensing Bottles Market Value (US$ Mn) by Country, 2022-2032

Figure 125: Oceania Dual Chamber Dispensing Bottles Market Value (US$ Mn) Analysis by Country, 2017-2032

Figure 126: Oceania Dual Chamber Dispensing Bottles Market Value Share (%) and BPS Analysis by Country, 2022-2032

Figure 127: Oceania Dual Chamber Dispensing Bottles Market Y-o-Y Growth (%) Projections by Country, 2022-2032

Figure 128: Oceania Dual Chamber Dispensing Bottles Market Value (US$ Mn) Analysis by Material Used, 2017-2032

Figure 129: Oceania Dual Chamber Dispensing Bottles Market Value Share (%) and BPS Analysis by Material Used, 2022-2032

Figure 130: Oceania Dual Chamber Dispensing Bottles Market Y-o-Y Growth (%) Projections by Material Used, 2022-2032

Figure 131: Oceania Dual Chamber Dispensing Bottles Market Value (US$ Mn) Analysis by Capacity Type, 2017-2032

Figure 132: Oceania Dual Chamber Dispensing Bottles Market Value Share (%) and BPS Analysis by Capacity Type, 2022-2032

Figure 133: Oceania Dual Chamber Dispensing Bottles Market Y-o-Y Growth (%) Projections by Capacity Type, 2022-2032

Figure 134: Oceania Dual Chamber Dispensing Bottles Market Value (US$ Mn) Analysis by End Use , 2017-2032

Figure 135: Oceania Dual Chamber Dispensing Bottles Market Value Share (%) and BPS Analysis by End Use , 2022-2032

Figure 136: Oceania Dual Chamber Dispensing Bottles Market Y-o-Y Growth (%) Projections by End Use , 2022-2032

Figure 137: Oceania Dual Chamber Dispensing Bottles Market Attractiveness by Material Used, 2022-2032

Figure 138: Oceania Dual Chamber Dispensing Bottles Market Attractiveness by Capacity Type, 2022-2032

Figure 139: Oceania Dual Chamber Dispensing Bottles Market Attractiveness by End Use , 2022-2032

Figure 140: Oceania Dual Chamber Dispensing Bottles Market Attractiveness by Country, 2022-2032

Figure 141: MEA Dual Chamber Dispensing Bottles Market Value (US$ Mn) by Material Used, 2022-2032

Figure 142: MEA Dual Chamber Dispensing Bottles Market Value (US$ Mn) by Capacity Type, 2022-2032

Figure 143: MEA Dual Chamber Dispensing Bottles Market Value (US$ Mn) by End Use , 2022-2032

Figure 144: MEA Dual Chamber Dispensing Bottles Market Value (US$ Mn) by Country, 2022-2032

Figure 145: MEA Dual Chamber Dispensing Bottles Market Value (US$ Mn) Analysis by Country, 2017-2032

Figure 146: MEA Dual Chamber Dispensing Bottles Market Value Share (%) and BPS Analysis by Country, 2022-2032

Figure 147: MEA Dual Chamber Dispensing Bottles Market Y-o-Y Growth (%) Projections by Country, 2022-2032

Figure 148: MEA Dual Chamber Dispensing Bottles Market Value (US$ Mn) Analysis by Material Used, 2017-2032

Figure 149: MEA Dual Chamber Dispensing Bottles Market Value Share (%) and BPS Analysis by Material Used, 2022-2032

Figure 150: MEA Dual Chamber Dispensing Bottles Market Y-o-Y Growth (%) Projections by Material Used, 2022-2032

Figure 151: MEA Dual Chamber Dispensing Bottles Market Value (US$ Mn) Analysis by Capacity Type, 2017-2032

Figure 152: MEA Dual Chamber Dispensing Bottles Market Value Share (%) and BPS Analysis by Capacity Type, 2022-2032

Figure 153: MEA Dual Chamber Dispensing Bottles Market Y-o-Y Growth (%) Projections by Capacity Type, 2022-2032

Figure 154: MEA Dual Chamber Dispensing Bottles Market Value (US$ Mn) Analysis by End Use , 2017-2032

Figure 155: MEA Dual Chamber Dispensing Bottles Market Value Share (%) and BPS Analysis by End Use , 2022-2032

Figure 156: MEA Dual Chamber Dispensing Bottles Market Y-o-Y Growth (%) Projections by End Use , 2022-2032

Figure 157: MEA Dual Chamber Dispensing Bottles Market Attractiveness by Material Used, 2022-2032

Figure 158: MEA Dual Chamber Dispensing Bottles Market Attractiveness by Capacity Type, 2022-2032

Figure 159: MEA Dual Chamber Dispensing Bottles Market Attractiveness by End Use , 2022-2032

Figure 160: MEA Dual Chamber Dispensing Bottles Market Attractiveness by Country, 2022-2032

Recommendations

Packaging

Dual Flap Dispensing Closure Market

Published : October 2023

Explore Packaging Insights

View Reports

Dual Chamber Dispensing Bottles Market