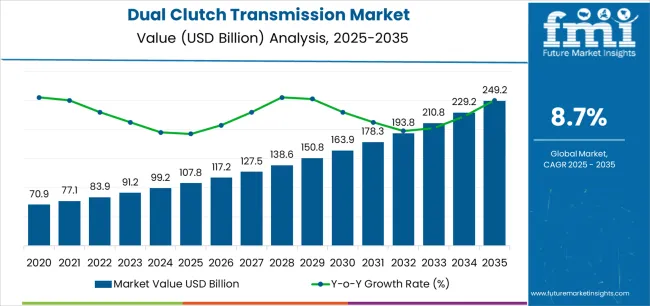
The Dual Clutch Transmission Market is estimated to be valued at USD 107.8 billion in 2025 and is projected to reach USD 249.2 billion by 2035, registering a compound annual growth rate (CAGR) of 8.7% over the forecast period.
The Dual Clutch Transmission market is experiencing significant growth driven by the rising demand for improved fuel efficiency, enhanced driving performance, and smoother gear shifts across passenger and commercial vehicles. The future outlook is shaped by the growing adoption of advanced automotive technologies and the increasing focus on reducing carbon emissions in internal combustion engine vehicles. Continuous developments in transmission systems, including compact designs and lightweight materials, are enhancing vehicle performance while supporting stringent regulatory standards.
Additionally, the increasing preference for automatic transmissions in emerging markets and the expanding automotive production in these regions are fueling market expansion. Investments in research and development by automotive manufacturers to improve torque handling and drivability are also contributing to market growth.
The growing consumer preference for comfort, performance, and reliability, combined with government incentives for efficient vehicles, is further propelling the adoption of dual clutch transmissions globally As vehicle electrification progresses, dual clutch systems continue to be integrated into hybrid and ICE vehicles, offering sustained growth potential.
| Metric | Value |
|---|---|
| Dual Clutch Transmission Market Estimated Value in (2025 E) | USD 107.8 billion |
| Dual Clutch Transmission Market Forecast Value in (2035 F) | USD 249.2 billion |
| Forecast CAGR (2025 to 2035) | 8.7% |
The market is segmented by Product Type, Torque Capacity, Propulsion Type, Vehicle Type, and Sales Channel and region. By Product Type, the market is divided into Dry Plate Clutch and Wet Plate Clutch. In terms of Torque Capacity, the market is classified into 250 To 500 Nm, Up To 250 Nm, 500 To 750 Nm, and Above 750 Nm. Based on Propulsion Type, the market is segmented into ICE Vehicles and HEV Vehicles. By Vehicle Type, the market is divided into Passenger Cars, Light Commercial Vehicles, and Heavy Commercial Vehicles. By Sales Channel, the market is segmented into OEM and Aftermarket. Regionally, the market is classified into North America, Latin America, Western Europe, Eastern Europe, Balkan & Baltic Countries, Russia & Belarus, Central Asia, East Asia, South Asia & Pacific, and the Middle East & Africa.
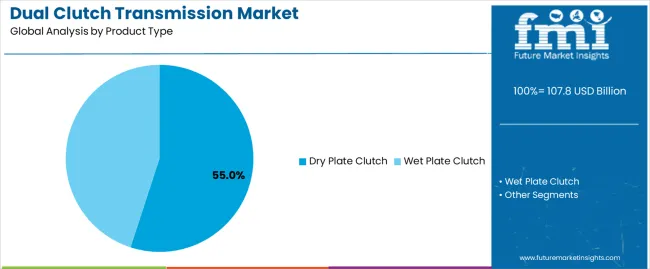
The dry plate clutch product type segment is projected to hold 55.0% of the Dual Clutch Transmission market revenue share in 2025, establishing it as the leading product type. This growth is primarily driven by its lower weight, reduced mechanical complexity, and cost-effectiveness compared to wet clutch systems.
Dry plate clutches are widely preferred in passenger vehicles for their ability to provide efficient torque transfer while improving fuel efficiency and overall vehicle performance. The simplicity of the design facilitates easier integration with existing transmission architectures, making it suitable for mass production and aftermarket applications.
Additionally, the reduced maintenance requirements and higher operational reliability support their adoption across diverse vehicle segments The increasing demand for compact, efficient, and lightweight transmission systems in ICE and hybrid vehicles has further reinforced the prominence of dry plate clutches, positioning this segment as a key contributor to market growth.
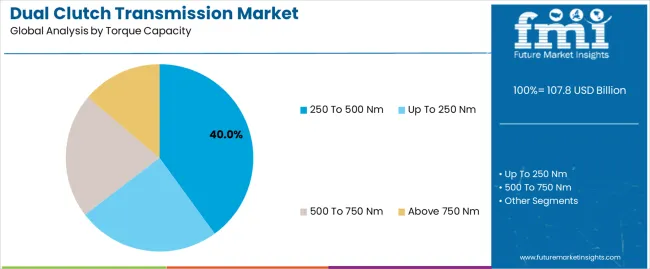
The 250 to 500 Nm torque capacity segment is anticipated to capture 40.0% of the Dual Clutch Transmission market revenue in 2025, highlighting its leading position. This segment has gained prominence due to its ability to support a wide range of passenger vehicles while balancing performance, fuel efficiency, and cost considerations.
Transmission systems within this torque range provide smooth gear transitions, enhanced drivability, and adaptability across multiple vehicle platforms. Manufacturers have increasingly focused on designing dual clutch systems that optimize torque handling without compromising reliability or efficiency.
The combination of moderate torque requirements and the growing production of mid-sized vehicles has further accelerated the adoption of transmissions in this range Additionally, the capability to integrate with modern engine management systems and provide consistent performance under varying driving conditions has reinforced its position as the preferred torque capacity segment.
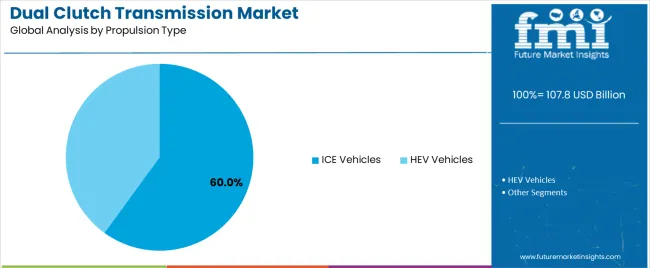
The internal combustion engine vehicle segment is projected to account for 60.0% of the Dual Clutch Transmission market revenue in 2025, making it the dominant propulsion type. The growth of this segment is driven by the continued reliance on ICE vehicles globally, particularly in regions where infrastructure for electrified vehicles is still developing.
Dual clutch transmissions in ICE vehicles offer superior fuel efficiency, smoother acceleration, and reduced energy loss compared to conventional automatic transmissions, enhancing overall driving performance. The demand for high-performance passenger cars and commercial vehicles that require reliable torque transfer and efficient gear management further supports adoption.
Additionally, manufacturers are increasingly optimizing dual clutch systems to meet emission regulations while delivering enhanced drivability The combination of technological advancements, widespread production of ICE vehicles, and consumer preference for efficient, high-performance powertrains underpins the dominance of this propulsion type in the market.
The annual growth rates of the global dual clutch transmission market from 2025 to 2035 are illustrated in the table below. Starting with the base year 2025 and going up to 2025, the report examines how the industry’s trajectory changes from the first half of the year, i.e. January through June (H1) to the second half consisting of July through December (H2).
This gives stakeholders a comprehensive picture of the industry’s performance over time and insights into potential future developments.
The table provided shows the growth for each half-year between 2025 and 2025. The market was projected to rise at a CAGR of 8.8% in the first half (H1) of 2025. However, in the second half (H2), there was a noticeable increase in the growth rate, which surged to 9.6%.
| Particular | Value CAGR |
|---|---|
| H1 | 8.8% (2025 to 2035) |
| H2 | 9.6% (2025 to 2035) |
| H1 | 9.1% (2025 to 2035) |
| H2 | 9.3% (2025 to 2035) |
Moving into the subsequent period, from H1 2025 to H2 2025, the CAGR is projected to dip slightly to 9.1% in the first half and rise to 9.3% in the second half. In the first half (H1), the industry saw a surge of 30 BPS while in the second half (H2), there was a decrease of 30 BPS.
Development of Lightweight Systems Using CAD and Precision Machining is a Key Trend
DCTs' intricate dual clutch mechanisms and multiple gears contributed to the initial bulk designs. Recent developments have LED to the manufacturing of small DCT designs that are highly effective and fit into cars more naturally.
Precision machining, simulation software, and computer-aided design (CAD) are a few examples of modern manufacturing processes. These enable manufacturers to produce smooth gear shift techniques, reduce energy loss, and increase efficiency. These innovations are also anticipated to lower parasitic losses and friction while improving the performance and fuel economy of vehicles.
To minimize the weight of the transmission system, leading players are focusing on the development of DTCs made from cutting-edge materials, such as composites, aluminum alloys, and high-strength steel. These innovations are projected to help reduce overall weight without sacrificing strength, thereby supporting improved fuel efficiency, handling, and vehicle dynamics.
Integration with Autonomous Driving Technologies and ADAS Creates Opportunities
Integrating autonomous driving technologies and advanced driver assistance systems (ADAS) into dual-clutch transmissions (DCTs) offers optimized vehicle performance and enhanced vehicle safety. The computerized calculation of real traffic and road conditions when integrated with autonomous driving software assists DTCs in optimizing gear shifts. It further helps in improving the vehicle's fuel economy and offers a hassle-free driving experience.
Adding more to the benefits, DCTs can work with ADAS features like lane departure warning, adaptive cruise control, and automatic emergency braking. These ensure a safe and more efficient driving experience. This integration is important to offer advanced safety, performance, and driving dynamics in autonomous vehicles.
Rising Demand for Luxury Vehicles with Upgraded Performance Accelerates Growth
Luxury cars are designed with premium materials, upgraded technology, and stellar performance to provide a high-end driving experience. Vehicle manufacturers are under constant pressure to produce vehicles that surpass expectations in terms of comfort, prestige, and rideability of these vehicles.
Delivering an enhanced fuel economy of around 3 to 5% over manual transmissions, DCTs are gaining popularity as an attractive option of transmission in luxury vehicles where efficiency is highly valued. Accessible to a wide range of consumers with a budget of under USD 24,000, Tata Altroz, Hyundai i20, Kia Seltos, and MG Hector are a few models of reasonably priced yet top end premium cars in India that come with DCT technology.
Increasing popularity of hybrid electric vehicles has also augmented the adoption of DCT systems. These provide an efficient and effective driving experience by combining the benefits of manual and automated operations, which is projected to boost demand.
Surging Preference for Automatic Vehicles among Senior Citizens to Bolster Sales
Ease of use, driving comfort, and convenience have been acting as a catalyst for shifting consumer preference toward automatic vehicles in recent years. Automatic transmission is a modern-day solution as it eliminates the need for manual shifting. This makes driving more accessible and less demanding, especially in congested urban environments and heavy traffic conditions.
Automatic transmissions, including dual-clutch transmissions, have eminently improved efficiency, performance, and reliability for driving in crowded areas. As a result of the enhanced driving dynamics offered by DCT, consumers are increasingly selecting automatic transmissions vehicles for a superior driving experience.
Another important factor influencing the preference for automatic transmission systems in vehicles is demographic shifts, including a rising aging population and a surging number of female drivers. Automatic transmissions are often favored by aged drivers and those with limited mobility or physical disabilities, as they require less effort and coordination to operate compared to manual transmissions.
Specialized Parts Needed in DTCs Can be Difficult to Acquire
The complex design and control systems of dual-clutch transmissions (DCTs) make these intrinsically more complicated to manufacture than traditional transmissions. To guarantee dependable performance and seamless operation, the dual-clutch arrangement, which has distinct clutches for odd and even numbered gears, requires exact engineering and close tolerances.
Due to the need for specialized parts, sophisticated procedures, and stringent quality control, this complexity raises the cost of manufacturing. The intricate control electronics, which include sensors, actuators, and electronic control units, also add to the complexity of DCTs by necessitating extra connectors, wiring, and software development.
Despite the increased complexity and expenses, DCTs provide substantial benefits in terms of performance, fuel economy, and smooth driving, thereby promoting sales globally.
The dual-clutch transmission market recorded a CAGR of 4% during the historical period between 2020 and 2025. The growth was positive as the market reached a value of USD 90,958.2 million in 2025 from USD 77,849.1 million in 2020.
DTCs experienced fluctuations during the historical period due to economic challenges, such as trade disputes, currency fluctuations, and geopolitical conflicts. These factors impacted the automotive industry, leading to a temporary downturn for dual-clutch transmissions.
The COVID-19 pandemic further disrupted global automotive supply chains and manufacturing activities, significantly affecting dual-clutch transmission sales. Supply chain disruptions LED to shortages of critical components and manufacturing challenges, impacting the industry’s dynamics. However, the pandemic also underscored the importance of unique transmission technologies for improving vehicle performance and efficiency, leading to a rising interest in dual-clutch transmissions.
Post-2024, the demand for dual-clutch transmissions surged due to the growing focus on vehicle performance, fuel efficiency, and driving comfort. These systems offer advantages, such as faster gear shifts, improved fuel efficiency, and a smoother driving experience compared to traditional automatic transmissions, contributing to increasing adoption.
During the assessment period, demand for dual-clutch transmissions is poised for significant growth, augmented by the rising need for high-performance and fuel-efficient vehicles across various regions. The growth is set to be particularly high in key automotive markets like India, China, and Brazil, where the industry is experiencing robust expansion.
Tier 1 companies comprise players with a revenue of above USD 10 billion, capturing a significant share of 65 to 70% globally. These players are characterized by high production capacity and a wide product portfolio. They are distinguished by their extensive expertise in manufacturing and a broad geographical reach, underpinned by a robust consumer base.
They provide a wide range of superior-quality products by utilizing the latest technology and meeting regulatory standards. Prominent companies within Tier 1 include ZF Friedrichshafen AG, BorgWarner Inc., Magna International Inc., Continental AG, and AISIN CORPORATION.
Tier 2 companies include mid-sized players with revenue below USD 10 billion. These have a robust presence in specific regions and are highly influencing the local industry. These are characterized by a strong presence overseas and good industry knowledge.
They have acquired good technology and help ensure regulatory compliance but may not have a wide global reach. Prominent companies in Tier 2 include Schaeffler AG, HYUNDAI TRANSYS, Valeo SA, GKN Automotive, Allison Transmission, Inc., and Fiat Powertrain Technologies (FPT Industrial).
Below is an analysis of the dual-clutch transmission market across various countries and regions. In East Asia, China is set to dominate with a share of 77.2% in 2035. In South Asia, India is predicted to achieve a CAGR of 9.3% from 2025 to 2035.
The analysis of countries highlights India and Japan as leaders in terms of growth, fueled by increased vehicle sales, demand for industrial machinery, and rising shipbuilding activities. Increasing purchasing power among the millennial population is another significant driver of vehicle sales.
China, a significant manufacturing hub, continues its strong expansion with an 8.3% CAGR through 2035. In the United States and France, growth is diversified across automotive, marine, defense, and aerospace industries. These countries are set to contribute 40 to 45% of the market value during the forecast period.
| Countries | CAGR 2025 to 2035 |
|---|---|
| India | 9.3% |
| Japan | 8.9% |
| France | 8.8% |
| United States | 8.7% |
| China | 8.3% |
The demand for dual-clutch transmissions in the United States is projected to reach USD 26,183.2 million by 2035. Over the forecast period, the country is predicted to surge at an 8.7% CAGR.
Dual-clutch transmissions are gaining immense popularity in the United States as they offer superior performance and efficiency. They provide faster and smoother gear shifts than traditional automatic transmissions, improving both acceleration and driving comfort.
There is a growing demand among local consumers for high-performance vehicles that can deliver better fuel efficiency. This has increased sales of dual-clutch transmission systems in vehicles.
United States-based Ford Motor Company, for instance, provides a dual-clutch transmission system in its 2025 Ford Mustang GT. It embodies the trend by combining powerful performance and precise gear changes, appealing specifically to driving enthusiasts who value both agility and fuel economy.
Several leading carmakers in the country are constantly launching novel products. This is because there has been a rising demand for DCT transmission in the United States as it offers around a 3 to 5% surge in terms of fuel efficiency in vehicles.
Sales in China are projected to reach USD 66,631 million by 2035. Over the forecast period, demand is predicted to surge at an 8.3% CAGR.
As per the China Association of Automobile Manufacturers (CAAM), the country’s automotive industry experienced significant growth in 2025 as production of passenger cars exceeded 30.2 million units. Total vehicle sales reached over 30.1 million units, initiating year-on-year growth of 11.6% and 12%, respectively.
China is one of the world's most prominent car exporters, leaving behind Japan, Germany, South Korea, and the United States. From January to November 2025, the country’s auto exports surged to 4.4 million units, surpassing Japan's 3.9 million units, showing a remarkable 58% y-o-y growth.
Known as a mass producer offering low manufacturing costs, China directly acquires a competitive advantage over other auto hubs globally. This capability enhances the country’s position in the global automotive industry, fostering innovation and expanding share in the DCT segment. Significant developments in the country’s market are anticipated, resulting in improved vehicle performance, efficiency, and revolutionary shifts.
Sales of dual-clutch transmission systems in India are projected to reach USD 12,949.1 million by 2035. Over the forecast period, demand is predicted to surge at a 9.3% CAGR.
The adoption of private vehicles, especially during post COVID-19 era, has grown in India. This has LED to traffic congestion issues not only in metropolitan cities but also in Tier 1 and Tier 2 cities of the country.
Due to the aforementioned factors, automatic vehicles have gained high popularity in India in the past 2 to 3 years. Several leading automakers have introduced automatic vehicle models, thereby foresing this trend. It has LED to the rising adoption of dual-clutch transmissions in several hatchbacks, sedans, and SUVs in the country.
India produced around 107.8 million passenger cars in 2025, with a high percentage of those cars equipped with automatic transmissions. This trend is highlighted by the recent introduction of the Hyundai Verna and numerous other models that come with a DCT.
Local automakers are set to gradually adapt to changing consumer preferences. Hence, the shift to automatic transmissions reflects an inclination of India’s automotive industry toward offering substantial growth opportunities for DCT technology.
The section explains the growth trajectories of the leading segments in the industry. In terms of product type, the wet plate clutch category will likely dominate and account for a share of around 91.2% in 2025.
Based on vehicle type, the passenger car segment is projected to hold a share of 81.3% in 2025. The analysis would enable potential clients to make effective business decisions for investment purposes.
| Segment | Wet Plate Clutch (Product Type) |
|---|---|
| Value Share (2025) | 91.2% |
Based on product type, wet plate clutches are projected to dominate the dual-clutch transmission market through 2035. As wet clutches are immersed in oil, which provides better cooling and lubrication, these allow for high torque capacity and long lifespan.
Wet plate clutches also excel in managing the increased torque and power demands of modern engines, thereby paving the way for its preference in the passenger car segment. The oil bath in wet clutches enhances heat dissipation, making this ideal for high-performance uses, such as sports cars and luxury vehicles.
Wet plate clutches further exhibit lower susceptibility to wear and tear, leading to less frequent maintenance compared to dry clutches. As a result, these clutches are less cost-efficient, marking them as a dependable choice for automakers, which is solidifying their dominance.
| Segment | Passenger Cars (Vehicle Type) |
|---|---|
| Value Share (2025) | 81.3% |
The passenger car segment dominates the DCT industry in terms of revenue, accounting for around 81.3% of the value share in 2025. Dual-clutch transmissions, characterized by quick gear pre-selection and seamless shifting between gears, provide a dynamic and sporty driving experience. It is appealing especially to passenger car buyers interested in a highly engaging ride.
Carmakers are introducing passenger car models equipped with DCTs due to the growing preference of consumers for automatic transmission solutions. The continuous braking and clutching of vehicles in urban areas creates a tiring and exhausting scenario for drivers, which is influencing the choice of consumers for automatic vehicles.
Growth is also set to be driven by continuous innovations in DCT technology, such as the development of electronic control modules, torque converters, and other features. These have improved the reliability, efficiency, and usability of DCTs, which is further accelerating the adoption of DCTs in the passenger car segment.
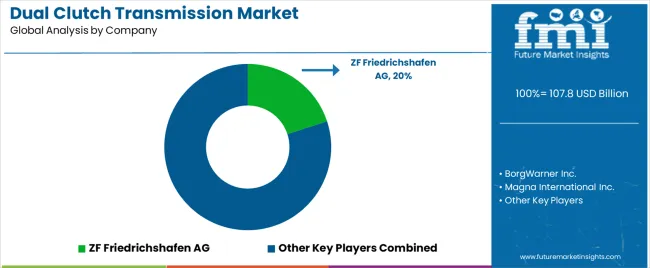
The global dual-clutch transmission market is moderately consolidated with the presence of several leading companies. They are currently holding a share of around 65 to 70%.
Key companies are prioritizing technological innovations, integration of sustainable practices, and expansion of the geographic footprints worldwide. They are also focusing on customer satisfaction by providing customized products to meet diverse needs. These companies are joining hands with leading automakers to provide their in-house products at a relatively low cost.
A handful of companies are investing huge sums in the development of state-of-the-art manufacturing facilities across Europe, Asia Pacific, and North America. Countries like India and China are anticipated to be the key manufacturing hubs for companies due to the easy availability of low-cost raw materials and labor.
Industry Updates
By product type, the industry is categorized into dry plate clutch and wet plate clutch.
A few torque capacities are up to 250 Nm, 250 to 500 Nm, 500 to 750 Nm, and above 750 Nm.
By propulsion type, the industry is categorized into ICE vehicles and HEV vehicles.
A few types of vehicles include passenger cars, light commercial vehicles, and heavy commercial vehicles.
Based on sales channel, the industry is segmented into original equipment manufacturer (OEM) and aftermarket.
Information about key regions like North America, Latin America, Western Europe, Eastern Europe, East Asia, South Asia, and the Middle East and Africa is provided.
The global dual clutch transmission market is estimated to be valued at USD 107.8 billion in 2025.
The market size for the dual clutch transmission market is projected to reach USD 249.2 billion by 2035.
The dual clutch transmission market is expected to grow at a 8.7% CAGR between 2025 and 2035.
The key product types in dual clutch transmission market are dry plate clutch and wet plate clutch.
In terms of torque capacity, 250 to 500 nm segment to command 40.0% share in the dual clutch transmission market in 2025.


Full Research Suite comprises of:
Market outlook & trends analysis
Interviews & case studies
Strategic recommendations
Vendor profiles & capabilities analysis
5-year forecasts
8 regions and 60+ country-level data splits
Market segment data splits
12 months of continuous data updates
DELIVERED AS:
PDF EXCEL ONLINE
Synchronizer for Dual-Clutch Transmissions (DCT) Market Size and Share Forecast Outlook 2025 to 2035
Dual Air Chamber Hydro-pneumatic Suspension Market Size and Share Forecast Outlook 2025 to 2035
DualMode Automated Tow Tractor Market Size and Share Forecast Outlook 2025 to 2035
Dual Frequency Ultrasonic Cleaner Market Size and Share Forecast Outlook 2025 to 2035
Dual-Cure Luting Cements Market Size and Share Forecast Outlook 2025 to 2035
Dual Screen Laptops Market Size and Share Forecast Outlook 2025 to 2035
Dual Ovenable Trays and Containers Market Size and Share Forecast Outlook 2025 to 2035
Dual Relay Board Market Size and Share Forecast Outlook 2025 to 2035
Dual Chamber Dispensing Bottles Market Size and Share Forecast Outlook 2025 to 2035
Dual Voltage Comparator Market Size and Share Forecast Outlook 2025 to 2035
Dual and Multi-Energy Computed Tomography (CT) Market Size and Share Forecast Outlook 2025 to 2035
Dual-Phase Cleanser Market Size and Share Forecast Outlook 2025 to 2035
The Dual Balloon Angioplasty Catheter Market is segmented by Peripheral, and Coronal from 2025 to 2035
Dual Biomarker Assays Market Analysis - Size, Share, & Forecast Outlook 2025 to 2035
Dual Flap Dispensing Closure Market Size & Trends 2025 to 2035
Dual Ovenable Lidding Films Market by Material, Seal Type, Application & Region - Forecast 2025 to 2035
Dual-Chamber Pumps Market Analysis - Size, Share, and Forecast Outlook (2025 to 2035)
Dual Axis Solar Tracker Market Growth - Trends & Forecast 2025 to 2035
Market Share Breakdown of Dual Ovenable Lidding Films Manufacturers
Dual Chamber Bottle Market Insights – Size, Trends & Forecast 2024-2034

Thank you!
You will receive an email from our Business Development Manager. Please be sure to check your SPAM/JUNK folder too.
Chat With
MaRIA