Dual Flap Dispensing Closure Market Size and Share Forecast Outlook 2025 to 2035

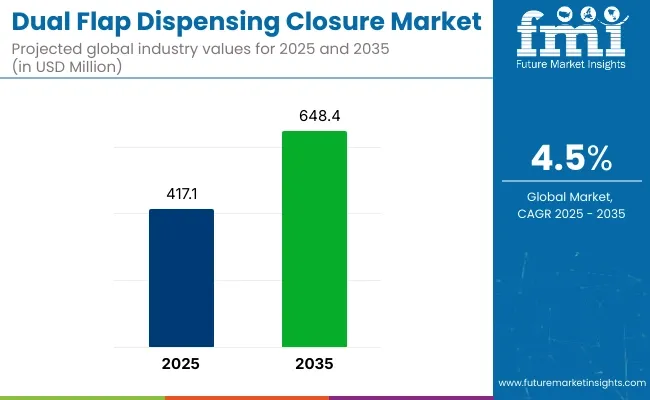
The dual flap dispensing closure market is projected to grow from USD 417.1 million in 2025 to USD 648.4 million by 2035, registering a CAGR of 4.5% during the forecast period. Sales in 2024 reached USD 399.1 million, reflecting a steady increase in demand across various industries.

This growth has been attributed to the rising need for convenient and user-friendly packaging solutions in sectors such as food and beverage, personal care, and household products. The increasing adoption of dual flap dispensing closures for products like spices, condiments, and seasonings has further propelled the market's expansion. Additionally, the surge in e-commerce and the demand for secure packaging have led to a higher utilization of advanced closure technologies globally.
Dual Flap Dispensing Closure Market

Metric Value
Industry Size (2025E) USD 417.1 million
Industry Value (2035F) USD 648.4 million
CAGR (2025 to 2035) 4.5%

In April 2025, Guala Closures, a world leader in the production of closures for the spirits, wine, water, beer, non-alcoholic beverage, and edible oil markets, inaugurated its new Greenfield manufacturing facility in West Africa, strategically located in the Lagos Free Zone.

“This investment underscores our commitment to advancing in the African market and creating value for our partners,” said Andrea Lodetti, CEO of Guala Closures. “Indeed, our global presence and in-depth knowledge of local markets allow us to stay close to our global customers, addressing their specific needs in every region of the world with customized solutions and outstanding service. By leveraging cutting-edge technologies and maintaining a strong focus on product quality and safety, we aim to enhance brand identity while offering robust protection against counterfeiting - an increasingly critical issue in the industry.”

The shift towards sustainable and environmentally friendly solutions has significantly influenced the dual flap dispensing closure market. Manufacturers have been focusing on developing closures that are recyclable, biodegradable, and made from renewable resources.

Innovations include the integration of biodegradable materials, modular designs, and the use of recycled components to reduce environmental impact. These advancements align with global sustainability goals and regulatory requirements, making dual flap dispensing closures an attractive option for environmentally conscious industries. Additionally, the development of automated manufacturing processes has enhanced efficiency and consistency in production, further driving market growth.

The dual flap dispensing closure market is poised for significant growth, driven by increasing demand in food and beverage, personal care, and household products industries. Companies investing in sustainable materials, innovative designs, and eco-friendly production processes are expected to gain a competitive edge. As global supply chains expand and environmental regulations become more stringent, the adoption of dual flap dispensing closures is anticipated to rise, offering cost-effective and eco-friendly solutions for product packaging and dispensing.

Analyzing Dual Flap Dispensing Closure Market by Top Investment Segments

Polypropylene Material Expected to Dominate Due to Process ability, Durability, and Cost Advantage

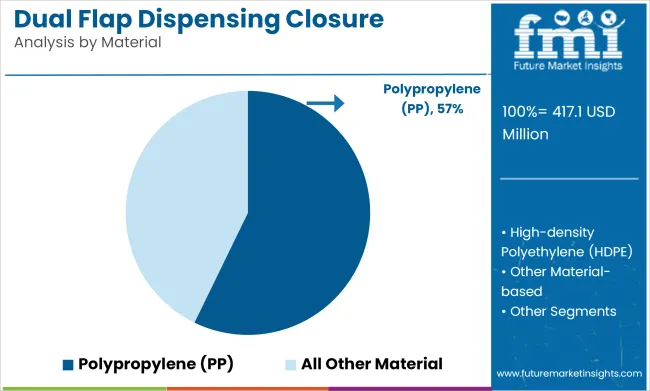
Polypropylene (PP) is projected to account for approximately 57.2% of the global dual flap dispensing closure market by 2025, as its adoption has been supported by high process ability, chemical resistance, and durability under repeated use. PP-based closures have been extensively utilized in dispensing applications that require precision flow control, hinge flexibility, and structural integrity under consumer handling.

Injection-molded PP closures have been manufactured to deliver tight sealing, repeated opening and closing without stress cracking, and a balance of stiffness and impact resistance. Food-grade PP has been particularly favored in condiment, seasoning, and dry food packaging where product hygiene and moisture protection are required.

Its compatibility with colorants, embossing, and custom mold designs has also enabled branding opportunities, while its recyclability has supported sustainability goals across packaging portfolios. Lightweight yet sturdy, PP closures have demonstrated an ability to reduce material consumption and shipping weight without compromising functionality.
Dual Flap Dispensing Closure Market Analysis By Material

As manufacturers aim to provide consumer-friendly, tamper-evident, and reusable packaging solutions, polypropylene is expected to remain the preferred material for dual flap dispensing closures across multiple end-use segments.

Household Segment Projected to Lead Due to Daily Utility and Reusable Packaging Demand

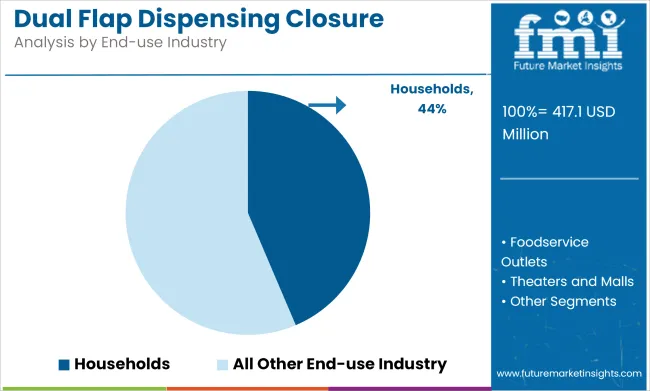
The households segment is anticipated to dominate the dual flap dispensing closure market by 2025, holding an estimated 43.6% market share, as these closures have been widely utilized in everyday packaging for pantry staples, cleaning agents, and personal care products. Their use has been driven by consumer expectations for convenience, portion control, and clean dispensing.

Dual flap closures have been integrated into bottles, jars, and pouches used for salt, spices, powdered detergents, sugar, and bath salts-enabling both wide and narrow openings for controlled dispensing. These closures have facilitated multi-functional use by offering options for pouring, sprinkling, or scooping from a single container.
Dual Flap Dispensing Closure Market Analysis By End Use Industry

Reusable packaging with dual flap closures has been adopted in households seeking to reduce plastic waste and reliance on disposable containers. Enhanced user control, ergonomic design, and moisture resistance have made such closures a standard in family-size and refillable packaging formats. As lifestyle trends continue to favor clutter-free organization, product reusability, and efficient kitchen and cleaning routines, the demand for dual flap dispensing closures in household applications is expected to grow steadily, sustaining its lead as the primary end-use segment in the market.

Challenges and Opportunities

Challenges

The Environmental Effect of Plastic Packaging

The biggest challenge for the dual flap dispensing closure market is likely the environmental effect of plastic packaging. Closures are fundamentally petroleum-derived polymers, and they contribute to the problem of plastic waste. As governments around the globe demand less plastic, business will be asked more and more to provide environmentally sustainable solutions that do not compromise product performance. Material science and recycling technology will be the solution to this issue.

Opportunities

Sustainable Materials Innovation

Increased focus on sustainability is a sound business opportunity. Firms are putting investments in manufacturing biodegradable and recyclable plastic lids to fulfill regulatory and customer acceptability standards. Bioplastics such as PLA (polylactic acid) and PHA (polyhydroxyalkanoates) also have good alternatives since they are as strong and handy as plastic but can be composted. Big packagers are also opting for reusable and refillable closure systems to reduce plastic waste and lengthen product life cycles.
Country Wise Outlook

Country Wise Analysis Of Dual Flap Dispensing Closure Market

United States

USA dual flap dispensing closure market is increasing because of increased demand from personal care and the food industry. Demand by house meal and fast service restaurants for condiment squeeze bottle whiplash has also spurred innovation with controlled-dispensing and spill-proofing. Personal care is also a compelling driver, with companies using dual flap closure on shampoos, soap, and lotion to ensure hassle-free use in a hygienic way.

Sustainability requirements will be one of the key driving forces for the industry in the future. Use by the USA government of recyclable and compostable packaging will cause manufacturers to use bio-based polymers. Demand for refill and bespoke dispensing systems will be fueled by growth of subscription personal care and beauty businesses.

Country CAGR (2025 to 2035)
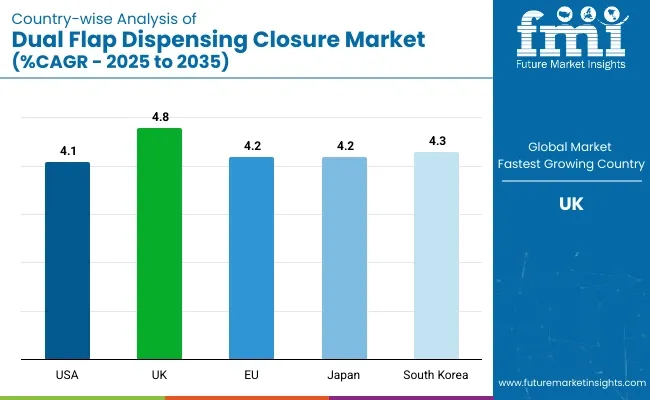
USA 4.1%

United Kingdom

UK's dual flap dispensing closure industry is growing due to the green packaging requirements under the Extended Producer Responsibility (EPR) policy. Light-weight mono-material dispensing closures are increasingly in demand, especially for packaging sauce, spread, and honey. The rise in plastic-free beauty and personal care packaging trends is also propelling companies towards switching to bio-based dispensing closures.

The British grocery market is still eager to purchase dual flap closures for high-end organic, healthy foods and others. Growth in application by retailers of refill stations is also driving demand for closure compatible with reusable and fillable pack formats.

Country CAGR (2025 to 2035)
UK 4.8%

European Union

European Union dual flap dispensing closure industry is recording ongoing growth in conformity with superior sustainability standards pursuant to the EU Packaging and Packaging Waste Directive (PPWD). France, Germany, and Italy are the forerunner markets pursuing bio-based and compostable dispensing closures due to prioritizing plastic uptake diminution coupled with compliance with circular economy strategy.

The EU beverage and food industry still requires precision-dispensing solutions, such as for milk, sauces, and specialty beverages. The personal care industry is shifting toward metal-free hinges and fully recyclable dispensing caps to promote sustainability.

Region CAGR (2025 to 2035)
European Union 4.2%

Japan

Japanese dual flap dispensing closures market is also transforming in the aftermath of technology advancement and precision engineering of the packaging industry. Growing demand for on-the-go, travel-sized personal care and hygiene products is encouraging demand for new-generation dispensing closures. Additionally, country regulations regarding recycling waste are driving consumption of recyclable and reusable dispensing closures for application in consumer goods packaging.

Japan's food market, encompassing specialty drinks, condiments, and sauces, is utilizing advanced oxygen-barrier dispensing closures to protect product freshness. Electronic packaging integration is on the rise, with closures having QR codes to enable interactive consumer engagement.

Country CAGR (2025 to 2035)
Japan 4.2%

South Korea

Market growth is fueled for South Korea dual flap dispensing closure by e-packaging and e-commerce growth. South Korea's growing cosmetics and beauty market is one of the main consumers of high-end dispensing closure, especially personal care and skin care cosmetics.

Food product packaging such as instant noodle spices, sauces, and condiments are moving towards precision-dispensing pack solutions in the name of convenience and reduction in product waste. Environmentally friendly packaging alternatives backed by state policies are pressurizing companies to adopt PCR-based materials.

Country CAGR (2025 to 2035)
South Korea 4.3%

Competitive Outlook

The dual flap dispensing closure market is a competitive market, with the market dominated by large international manufacturers and regional players with product innovation and growth markets combinations. Market leaders focus on convenience development, spill-proof functionality, and reducing material unsustainability.
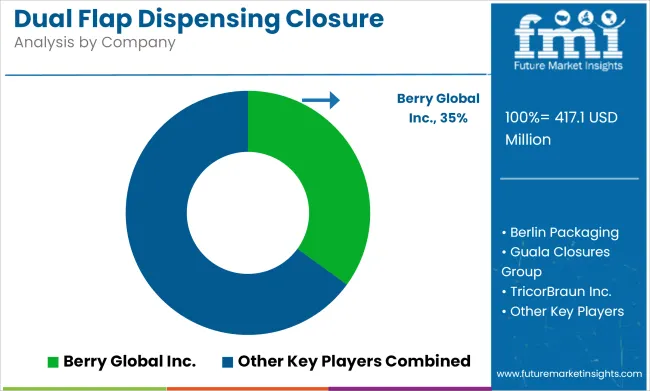
Dual Flap Dispensing Closure Market Analysis By Company

The market has developed dominant industry players with strong distribution networks and new entrants with innovative designs and low-cost manufacturing processes. Growth of food and beverage, personal care, and home and household products businesses continues to fuel demand for new dispensing solutions.

Dual Flap Dispensing Closure Market Segmentation

By Material:

  • Polypropylene (PP)
  • High-density Polyethylene (HDPE)
  • Other Material-based

By Application:

  • Spices, Condiments, and Seasonings
  • Confectionary & Baking Products
  • Sweeteners
  • Other Applications

By End-use Industry:

  • Foodservice Outlets
  • Theaters and Malls
  • Households

By Region:

  • North America
  • Latin America
  • Western Europe
  • Eastern Europe
  • East Asia
  • South Asia Pacific
  • Middle East and Africa

Table of Content

  1. Executive Summary
  2. Industry Introduction, including Taxonomy and Market Definition
  3. Market Trends and Success Factors, including Macro-economic Factors, Market Dynamics, and Recent Industry Developments
  4. Global Market Demand Analysis 2020 to 2024 and Forecast 2025 to 2035, including Historical Analysis and Future Projections
  5. Global Market Analysis 2020 to 2024 and Forecast 2025 to 2035
    • Material
    • Application
    • End-use Industry
  6. Global Market Analysis 2020 to 2024 and Forecast 2025 to 2035, By Material
    • Polypropylene (PP)
    • High-density Polyethylene (HDPE)
    • Other Material-based
  7. Global Market Analysis 2020 to 2024 and Forecast 2025 to 2035, By Application
    • Spices, Condiments, and Seasonings
    • Confectionary & Baking Products
    • Sweeteners
    • Other Applications
  8. Global Market Analysis 2020 to 2024 and Forecast 2025 to 2035, By End-use Industry
    • Foodservice Outlets
    • Theaters and Malls
    • Households
  9. Global Market Analysis 2020 to 2024 and Forecast 2025 to 2035, By Region
    • North America
    • Latin America
    • Western Europe
    • Eastern Europe
    • East Asia
    • South Asia Pacific
    • Middle East and Africa
  10. North America Sales Analysis 2020 to 2024 and Forecast 2025 to 2035, by Key Segments and Countries
  11. Latin America Sales Analysis 2020 to 2024 and Forecast 2025 to 2035, by Key Segments and Countries
  12. Western Europe Sales Analysis 2020 to 2024 and Forecast 2025 to 2035, by Key Segments and Countries
  13. Eastern Europe Sales Analysis 2020 to 2024 and Forecast 2025 to 2035, by Key Segments and Countries
  14. East Asia Sales Analysis 2020 to 2024 and Forecast 2025 to 2035, by Key Segments and Countries
  15. South Asia Pacific Sales Analysis 2020 to 2024 and Forecast 2025 to 2035, by Key Segments and Countries
  16. Middle East and Africa Sales Analysis 2020 to 2024 and Forecast 2025 to 2035, by Key Segments and Countries
  17. Sales Forecast 2025 to 2035 by Material, Application, and End-use Industry for 30 Countries
  18. Competition Outlook, including Market Structure Analysis, Company Share Analysis by Key Players, and Competition Dashboard
  19. Company Profile
    • Berry Global Inc.
    • Silgan Holdings Inc.
    • Berlin Packaging
    • Guala Closures Group
    • TricorBraun Inc.
    • Comar LLC
    • MRP Solutions
    • Value (USD Million) & Volume (Unit)ed Caps
    • O.Berk Company LLC
    • McKernan Packaging Clearing House

List of Tables

  • Table 1: Global Market Value (US$ Million) Forecast by Region, 2020 to 2035
  • Table 2: Global Market Volume (Units) Forecast by Region, 2020 to 2035
  • Table 3: Global Market Value (US$ Million) Forecast by Material, 2020 to 2035
  • Table 4: Global Market Volume (Units) Forecast by Material, 2020 to 2035
  • Table 5: Global Market Value (US$ Million) Forecast by Application, 2020 to 2035
  • Table 6: Global Market Volume (Units) Forecast by Application, 2020 to 2035
  • Table 7: Global Market Value (US$ Million) Forecast by End Use, 2020 to 2035
  • Table 8: Global Market Volume (Units) Forecast by End Use, 2020 to 2035
  • Table 9: North America Market Value (US$ Million) Forecast by Country, 2020 to 2035
  • Table 10: North America Market Volume (Units) Forecast by Country, 2020 to 2035
  • Table 11: North America Market Value (US$ Million) Forecast by Material, 2020 to 2035
  • Table 12: North America Market Volume (Units) Forecast by Material, 2020 to 2035
  • Table 13: North America Market Value (US$ Million) Forecast by Application, 2020 to 2035
  • Table 14: North America Market Volume (Units) Forecast by Application, 2020 to 2035
  • Table 15: North America Market Value (US$ Million) Forecast by End Use, 2020 to 2035
  • Table 16: North America Market Volume (Units) Forecast by End Use, 2020 to 2035
  • Table 17: Latin America Market Value (US$ Million) Forecast by Country, 2020 to 2035
  • Table 18: Latin America Market Volume (Units) Forecast by Country, 2020 to 2035
  • Table 19: Latin America Market Value (US$ Million) Forecast by Material, 2020 to 2035
  • Table 20: Latin America Market Volume (Units) Forecast by Material, 2020 to 2035
  • Table 21: Latin America Market Value (US$ Million) Forecast by Application, 2020 to 2035
  • Table 22: Latin America Market Volume (Units) Forecast by Application, 2020 to 2035
  • Table 23: Latin America Market Value (US$ Million) Forecast by End Use, 2020 to 2035
  • Table 24: Latin America Market Volume (Units) Forecast by End Use, 2020 to 2035
  • Table 25: Western Europe Market Value (US$ Million) Forecast by Country, 2020 to 2035
  • Table 26: Western Europe Market Volume (Units) Forecast by Country, 2020 to 2035
  • Table 27: Western Europe Market Value (US$ Million) Forecast by Material, 2020 to 2035
  • Table 28: Western Europe Market Volume (Units) Forecast by Material, 2020 to 2035
  • Table 29: Western Europe Market Value (US$ Million) Forecast by Application, 2020 to 2035
  • Table 30: Western Europe Market Volume (Units) Forecast by Application, 2020 to 2035
  • Table 31: Western Europe Market Value (US$ Million) Forecast by End Use, 2020 to 2035
  • Table 32: Western Europe Market Volume (Units) Forecast by End Use, 2020 to 2035
  • Table 33: Eastern Europe Market Value (US$ Million) Forecast by Country, 2020 to 2035
  • Table 34: Eastern Europe Market Volume (Units) Forecast by Country, 2020 to 2035
  • Table 35: Eastern Europe Market Value (US$ Million) Forecast by Material, 2020 to 2035
  • Table 36: Eastern Europe Market Volume (Units) Forecast by Material, 2020 to 2035
  • Table 37: Eastern Europe Market Value (US$ Million) Forecast by Application, 2020 to 2035
  • Table 38: Eastern Europe Market Volume (Units) Forecast by Application, 2020 to 2035
  • Table 39: Eastern Europe Market Value (US$ Million) Forecast by End Use, 2020 to 2035
  • Table 40: Eastern Europe Market Volume (Units) Forecast by End Use, 2020 to 2035
  • Table 41: South Asia and Pacific Market Value (US$ Million) Forecast by Country, 2020 to 2035
  • Table 42: South Asia and Pacific Market Volume (Units) Forecast by Country, 2020 to 2035
  • Table 43: South Asia and Pacific Market Value (US$ Million) Forecast by Material, 2020 to 2035
  • Table 44: South Asia and Pacific Market Volume (Units) Forecast by Material, 2020 to 2035
  • Table 45: South Asia and Pacific Market Value (US$ Million) Forecast by Application, 2020 to 2035
  • Table 46: South Asia and Pacific Market Volume (Units) Forecast by Application, 2020 to 2035
  • Table 47: South Asia and Pacific Market Value (US$ Million) Forecast by End Use, 2020 to 2035
  • Table 48: South Asia and Pacific Market Volume (Units) Forecast by End Use, 2020 to 2035
  • Table 49: East Asia Market Value (US$ Million) Forecast by Country, 2020 to 2035
  • Table 50: East Asia Market Volume (Units) Forecast by Country, 2020 to 2035
  • Table 51: East Asia Market Value (US$ Million) Forecast by Material, 2020 to 2035
  • Table 52: East Asia Market Volume (Units) Forecast by Material, 2020 to 2035
  • Table 53: East Asia Market Value (US$ Million) Forecast by Application, 2020 to 2035
  • Table 54: East Asia Market Volume (Units) Forecast by Application, 2020 to 2035
  • Table 55: East Asia Market Value (US$ Million) Forecast by End Use, 2020 to 2035
  • Table 56: East Asia Market Volume (Units) Forecast by End Use, 2020 to 2035
  • Table 57: Middle East and Africa Market Value (US$ Million) Forecast by Country, 2020 to 2035
  • Table 58: Middle East and Africa Market Volume (Units) Forecast by Country, 2020 to 2035
  • Table 59: Middle East and Africa Market Value (US$ Million) Forecast by Material, 2020 to 2035
  • Table 60: Middle East and Africa Market Volume (Units) Forecast by Material, 2020 to 2035
  • Table 61: Middle East and Africa Market Value (US$ Million) Forecast by Application, 2020 to 2035
  • Table 62: Middle East and Africa Market Volume (Units) Forecast by Application, 2020 to 2035
  • Table 63: Middle East and Africa Market Value (US$ Million) Forecast by End Use, 2020 to 2035
  • Table 64: Middle East and Africa Market Volume (Units) Forecast by End Use, 2020 to 2035

List of Figures

  • Figure 1: Global Market Value (US$ Million) by Material, 2025 to 2035
  • Figure 2: Global Market Value (US$ Million) by Application, 2025 to 2035
  • Figure 3: Global Market Value (US$ Million) by End Use, 2025 to 2035
  • Figure 4: Global Market Value (US$ Million) by Region, 2025 to 2035
  • Figure 5: Global Market Value (US$ Million) Analysis by Region, 2020 to 2035
  • Figure 6: Global Market Volume (Units) Analysis by Region, 2020 to 2035
  • Figure 7: Global Market Value Share (%) and BPS Analysis by Region, 2025 to 2035
  • Figure 8: Global Market Y-o-Y Growth (%) Projections by Region, 2025 to 2035
  • Figure 9: Global Market Value (US$ Million) Analysis by Material, 2020 to 2035
  • Figure 10: Global Market Volume (Units) Analysis by Material, 2020 to 2035
  • Figure 11: Global Market Value Share (%) and BPS Analysis by Material, 2025 to 2035
  • Figure 12: Global Market Y-o-Y Growth (%) Projections by Material, 2025 to 2035
  • Figure 13: Global Market Value (US$ Million) Analysis by Application, 2020 to 2035
  • Figure 14: Global Market Volume (Units) Analysis by Application, 2020 to 2035
  • Figure 15: Global Market Value Share (%) and BPS Analysis by Application, 2025 to 2035
  • Figure 16: Global Market Y-o-Y Growth (%) Projections by Application, 2025 to 2035
  • Figure 17: Global Market Value (US$ Million) Analysis by End Use, 2020 to 2035
  • Figure 18: Global Market Volume (Units) Analysis by End Use, 2020 to 2035
  • Figure 19: Global Market Value Share (%) and BPS Analysis by End Use, 2025 to 2035
  • Figure 20: Global Market Y-o-Y Growth (%) Projections by End Use, 2025 to 2035
  • Figure 21: Global Market Attractiveness by Material, 2025 to 2035
  • Figure 22: Global Market Attractiveness by Application, 2025 to 2035
  • Figure 23: Global Market Attractiveness by End Use, 2025 to 2035
  • Figure 24: Global Market Attractiveness by Region, 2025 to 2035
  • Figure 25: North America Market Value (US$ Million) by Material, 2025 to 2035
  • Figure 26: North America Market Value (US$ Million) by Application, 2025 to 2035
  • Figure 27: North America Market Value (US$ Million) by End Use, 2025 to 2035
  • Figure 28: North America Market Value (US$ Million) by Country, 2025 to 2035
  • Figure 29: North America Market Value (US$ Million) Analysis by Country, 2020 to 2035
  • Figure 30: North America Market Volume (Units) Analysis by Country, 2020 to 2035
  • Figure 31: North America Market Value Share (%) and BPS Analysis by Country, 2025 to 2035
  • Figure 32: North America Market Y-o-Y Growth (%) Projections by Country, 2025 to 2035
  • Figure 33: North America Market Value (US$ Million) Analysis by Material, 2020 to 2035
  • Figure 34: North America Market Volume (Units) Analysis by Material, 2020 to 2035
  • Figure 35: North America Market Value Share (%) and BPS Analysis by Material, 2025 to 2035
  • Figure 36: North America Market Y-o-Y Growth (%) Projections by Material, 2025 to 2035
  • Figure 37: North America Market Value (US$ Million) Analysis by Application, 2020 to 2035
  • Figure 38: North America Market Volume (Units) Analysis by Application, 2020 to 2035
  • Figure 39: North America Market Value Share (%) and BPS Analysis by Application, 2025 to 2035
  • Figure 40: North America Market Y-o-Y Growth (%) Projections by Application, 2025 to 2035
  • Figure 41: North America Market Value (US$ Million) Analysis by End Use, 2020 to 2035
  • Figure 42: North America Market Volume (Units) Analysis by End Use, 2020 to 2035
  • Figure 43: North America Market Value Share (%) and BPS Analysis by End Use, 2025 to 2035
  • Figure 44: North America Market Y-o-Y Growth (%) Projections by End Use, 2025 to 2035
  • Figure 45: North America Market Attractiveness by Material, 2025 to 2035
  • Figure 46: North America Market Attractiveness by Application, 2025 to 2035
  • Figure 47: North America Market Attractiveness by End Use, 2025 to 2035
  • Figure 48: North America Market Attractiveness by Country, 2025 to 2035
  • Figure 49: Latin America Market Value (US$ Million) by Material, 2025 to 2035
  • Figure 50: Latin America Market Value (US$ Million) by Application, 2025 to 2035
  • Figure 51: Latin America Market Value (US$ Million) by End Use, 2025 to 2035
  • Figure 52: Latin America Market Value (US$ Million) by Country, 2025 to 2035
  • Figure 53: Latin America Market Value (US$ Million) Analysis by Country, 2020 to 2035
  • Figure 54: Latin America Market Volume (Units) Analysis by Country, 2020 to 2035
  • Figure 55: Latin America Market Value Share (%) and BPS Analysis by Country, 2025 to 2035
  • Figure 56: Latin America Market Y-o-Y Growth (%) Projections by Country, 2025 to 2035
  • Figure 57: Latin America Market Value (US$ Million) Analysis by Material, 2020 to 2035
  • Figure 58: Latin America Market Volume (Units) Analysis by Material, 2020 to 2035
  • Figure 59: Latin America Market Value Share (%) and BPS Analysis by Material, 2025 to 2035
  • Figure 60: Latin America Market Y-o-Y Growth (%) Projections by Material, 2025 to 2035
  • Figure 61: Latin America Market Value (US$ Million) Analysis by Application, 2020 to 2035
  • Figure 62: Latin America Market Volume (Units) Analysis by Application, 2020 to 2035
  • Figure 63: Latin America Market Value Share (%) and BPS Analysis by Application, 2025 to 2035
  • Figure 64: Latin America Market Y-o-Y Growth (%) Projections by Application, 2025 to 2035
  • Figure 65: Latin America Market Value (US$ Million) Analysis by End Use, 2020 to 2035
  • Figure 66: Latin America Market Volume (Units) Analysis by End Use, 2020 to 2035
  • Figure 67: Latin America Market Value Share (%) and BPS Analysis by End Use, 2025 to 2035
  • Figure 68: Latin America Market Y-o-Y Growth (%) Projections by End Use, 2025 to 2035
  • Figure 69: Latin America Market Attractiveness by Material, 2025 to 2035
  • Figure 70: Latin America Market Attractiveness by Application, 2025 to 2035
  • Figure 71: Latin America Market Attractiveness by End Use, 2025 to 2035
  • Figure 72: Latin America Market Attractiveness by Country, 2025 to 2035
  • Figure 73: Western Europe Market Value (US$ Million) by Material, 2025 to 2035
  • Figure 74: Western Europe Market Value (US$ Million) by Application, 2025 to 2035
  • Figure 75: Western Europe Market Value (US$ Million) by End Use, 2025 to 2035
  • Figure 76: Western Europe Market Value (US$ Million) by Country, 2025 to 2035
  • Figure 77: Western Europe Market Value (US$ Million) Analysis by Country, 2020 to 2035
  • Figure 78: Western Europe Market Volume (Units) Analysis by Country, 2020 to 2035
  • Figure 79: Western Europe Market Value Share (%) and BPS Analysis by Country, 2025 to 2035
  • Figure 80: Western Europe Market Y-o-Y Growth (%) Projections by Country, 2025 to 2035
  • Figure 81: Western Europe Market Value (US$ Million) Analysis by Material, 2020 to 2035
  • Figure 82: Western Europe Market Volume (Units) Analysis by Material, 2020 to 2035
  • Figure 83: Western Europe Market Value Share (%) and BPS Analysis by Material, 2025 to 2035
  • Figure 84: Western Europe Market Y-o-Y Growth (%) Projections by Material, 2025 to 2035
  • Figure 85: Western Europe Market Value (US$ Million) Analysis by Application, 2020 to 2035
  • Figure 86: Western Europe Market Volume (Units) Analysis by Application, 2020 to 2035
  • Figure 87: Western Europe Market Value Share (%) and BPS Analysis by Application, 2025 to 2035
  • Figure 88: Western Europe Market Y-o-Y Growth (%) Projections by Application, 2025 to 2035
  • Figure 89: Western Europe Market Value (US$ Million) Analysis by End Use, 2020 to 2035
  • Figure 90: Western Europe Market Volume (Units) Analysis by End Use, 2020 to 2035
  • Figure 91: Western Europe Market Value Share (%) and BPS Analysis by End Use, 2025 to 2035
  • Figure 92: Western Europe Market Y-o-Y Growth (%) Projections by End Use, 2025 to 2035
  • Figure 93: Western Europe Market Attractiveness by Material, 2025 to 2035
  • Figure 94: Western Europe Market Attractiveness by Application, 2025 to 2035
  • Figure 95: Western Europe Market Attractiveness by End Use, 2025 to 2035
  • Figure 96: Western Europe Market Attractiveness by Country, 2025 to 2035
  • Figure 97: Eastern Europe Market Value (US$ Million) by Material, 2025 to 2035
  • Figure 98: Eastern Europe Market Value (US$ Million) by Application, 2025 to 2035
  • Figure 99: Eastern Europe Market Value (US$ Million) by End Use, 2025 to 2035
  • Figure 100: Eastern Europe Market Value (US$ Million) by Country, 2025 to 2035
  • Figure 101: Eastern Europe Market Value (US$ Million) Analysis by Country, 2020 to 2035
  • Figure 102: Eastern Europe Market Volume (Units) Analysis by Country, 2020 to 2035
  • Figure 103: Eastern Europe Market Value Share (%) and BPS Analysis by Country, 2025 to 2035
  • Figure 104: Eastern Europe Market Y-o-Y Growth (%) Projections by Country, 2025 to 2035
  • Figure 105: Eastern Europe Market Value (US$ Million) Analysis by Material, 2020 to 2035
  • Figure 106: Eastern Europe Market Volume (Units) Analysis by Material, 2020 to 2035
  • Figure 107: Eastern Europe Market Value Share (%) and BPS Analysis by Material, 2025 to 2035
  • Figure 108: Eastern Europe Market Y-o-Y Growth (%) Projections by Material, 2025 to 2035
  • Figure 109: Eastern Europe Market Value (US$ Million) Analysis by Application, 2020 to 2035
  • Figure 110: Eastern Europe Market Volume (Units) Analysis by Application, 2020 to 2035
  • Figure 111: Eastern Europe Market Value Share (%) and BPS Analysis by Application, 2025 to 2035
  • Figure 112: Eastern Europe Market Y-o-Y Growth (%) Projections by Application, 2025 to 2035
  • Figure 113: Eastern Europe Market Value (US$ Million) Analysis by End Use, 2020 to 2035
  • Figure 114: Eastern Europe Market Volume (Units) Analysis by End Use, 2020 to 2035
  • Figure 115: Eastern Europe Market Value Share (%) and BPS Analysis by End Use, 2025 to 2035
  • Figure 116: Eastern Europe Market Y-o-Y Growth (%) Projections by End Use, 2025 to 2035
  • Figure 117: Eastern Europe Market Attractiveness by Material, 2025 to 2035
  • Figure 118: Eastern Europe Market Attractiveness by Application, 2025 to 2035
  • Figure 119: Eastern Europe Market Attractiveness by End Use, 2025 to 2035
  • Figure 120: Eastern Europe Market Attractiveness by Country, 2025 to 2035
  • Figure 121: South Asia and Pacific Market Value (US$ Million) by Material, 2025 to 2035
  • Figure 122: South Asia and Pacific Market Value (US$ Million) by Application, 2025 to 2035
  • Figure 123: South Asia and Pacific Market Value (US$ Million) by End Use, 2025 to 2035
  • Figure 124: South Asia and Pacific Market Value (US$ Million) by Country, 2025 to 2035
  • Figure 125: South Asia and Pacific Market Value (US$ Million) Analysis by Country, 2020 to 2035
  • Figure 126: South Asia and Pacific Market Volume (Units) Analysis by Country, 2020 to 2035
  • Figure 127: South Asia and Pacific Market Value Share (%) and BPS Analysis by Country, 2025 to 2035
  • Figure 128: South Asia and Pacific Market Y-o-Y Growth (%) Projections by Country, 2025 to 2035
  • Figure 129: South Asia and Pacific Market Value (US$ Million) Analysis by Material, 2020 to 2035
  • Figure 130: South Asia and Pacific Market Volume (Units) Analysis by Material, 2020 to 2035
  • Figure 131: South Asia and Pacific Market Value Share (%) and BPS Analysis by Material, 2025 to 2035
  • Figure 132: South Asia and Pacific Market Y-o-Y Growth (%) Projections by Material, 2025 to 2035
  • Figure 133: South Asia and Pacific Market Value (US$ Million) Analysis by Application, 2020 to 2035
  • Figure 134: South Asia and Pacific Market Volume (Units) Analysis by Application, 2020 to 2035
  • Figure 135: South Asia and Pacific Market Value Share (%) and BPS Analysis by Application, 2025 to 2035
  • Figure 136: South Asia and Pacific Market Y-o-Y Growth (%) Projections by Application, 2025 to 2035
  • Figure 137: South Asia and Pacific Market Value (US$ Million) Analysis by End Use, 2020 to 2035
  • Figure 138: South Asia and Pacific Market Volume (Units) Analysis by End Use, 2020 to 2035
  • Figure 139: South Asia and Pacific Market Value Share (%) and BPS Analysis by End Use, 2025 to 2035
  • Figure 140: South Asia and Pacific Market Y-o-Y Growth (%) Projections by End Use, 2025 to 2035
  • Figure 141: South Asia and Pacific Market Attractiveness by Material, 2025 to 2035
  • Figure 142: South Asia and Pacific Market Attractiveness by Application, 2025 to 2035
  • Figure 143: South Asia and Pacific Market Attractiveness by End Use, 2025 to 2035
  • Figure 144: South Asia and Pacific Market Attractiveness by Country, 2025 to 2035
  • Figure 145: East Asia Market Value (US$ Million) by Material, 2025 to 2035
  • Figure 146: East Asia Market Value (US$ Million) by Application, 2025 to 2035
  • Figure 147: East Asia Market Value (US$ Million) by End Use, 2025 to 2035
  • Figure 148: East Asia Market Value (US$ Million) by Country, 2025 to 2035
  • Figure 149: East Asia Market Value (US$ Million) Analysis by Country, 2020 to 2035
  • Figure 150: East Asia Market Volume (Units) Analysis by Country, 2020 to 2035
  • Figure 151: East Asia Market Value Share (%) and BPS Analysis by Country, 2025 to 2035
  • Figure 152: East Asia Market Y-o-Y Growth (%) Projections by Country, 2025 to 2035
  • Figure 153: East Asia Market Value (US$ Million) Analysis by Material, 2020 to 2035
  • Figure 154: East Asia Market Volume (Units) Analysis by Material, 2020 to 2035
  • Figure 155: East Asia Market Value Share (%) and BPS Analysis by Material, 2025 to 2035
  • Figure 156: East Asia Market Y-o-Y Growth (%) Projections by Material, 2025 to 2035
  • Figure 157: East Asia Market Value (US$ Million) Analysis by Application, 2020 to 2035
  • Figure 158: East Asia Market Volume (Units) Analysis by Application, 2020 to 2035
  • Figure 159: East Asia Market Value Share (%) and BPS Analysis by Application, 2025 to 2035
  • Figure 160: East Asia Market Y-o-Y Growth (%) Projections by Application, 2025 to 2035
  • Figure 161: East Asia Market Value (US$ Million) Analysis by End Use, 2020 to 2035
  • Figure 162: East Asia Market Volume (Units) Analysis by End Use, 2020 to 2035
  • Figure 163: East Asia Market Value Share (%) and BPS Analysis by End Use, 2025 to 2035
  • Figure 164: East Asia Market Y-o-Y Growth (%) Projections by End Use, 2025 to 2035
  • Figure 165: East Asia Market Attractiveness by Material, 2025 to 2035
  • Figure 166: East Asia Market Attractiveness by Application, 2025 to 2035
  • Figure 167: East Asia Market Attractiveness by End Use, 2025 to 2035
  • Figure 168: East Asia Market Attractiveness by Country, 2025 to 2035
  • Figure 169: Middle East and Africa Market Value (US$ Million) by Material, 2025 to 2035
  • Figure 170: Middle East and Africa Market Value (US$ Million) by Application, 2025 to 2035
  • Figure 171: Middle East and Africa Market Value (US$ Million) by End Use, 2025 to 2035
  • Figure 172: Middle East and Africa Market Value (US$ Million) by Country, 2025 to 2035
  • Figure 173: Middle East and Africa Market Value (US$ Million) Analysis by Country, 2020 to 2035
  • Figure 174: Middle East and Africa Market Volume (Units) Analysis by Country, 2020 to 2035
  • Figure 175: Middle East and Africa Market Value Share (%) and BPS Analysis by Country, 2025 to 2035
  • Figure 176: Middle East and Africa Market Y-o-Y Growth (%) Projections by Country, 2025 to 2035
  • Figure 177: Middle East and Africa Market Value (US$ Million) Analysis by Material, 2020 to 2035
  • Figure 178: Middle East and Africa Market Volume (Units) Analysis by Material, 2020 to 2035
  • Figure 179: Middle East and Africa Market Value Share (%) and BPS Analysis by Material, 2025 to 2035
  • Figure 180: Middle East and Africa Market Y-o-Y Growth (%) Projections by Material, 2025 to 2035
  • Figure 181: Middle East and Africa Market Value (US$ Million) Analysis by Application, 2020 to 2035
  • Figure 182: Middle East and Africa Market Volume (Units) Analysis by Application, 2020 to 2035
  • Figure 183: Middle East and Africa Market Value Share (%) and BPS Analysis by Application, 2025 to 2035
  • Figure 184: Middle East and Africa Market Y-o-Y Growth (%) Projections by Application, 2025 to 2035
  • Figure 185: Middle East and Africa Market Value (US$ Million) Analysis by End Use, 2020 to 2035
  • Figure 186: Middle East and Africa Market Volume (Units) Analysis by End Use, 2020 to 2035
  • Figure 187: Middle East and Africa Market Value Share (%) and BPS Analysis by End Use, 2025 to 2035
  • Figure 188: Middle East and Africa Market Y-o-Y Growth (%) Projections by End Use, 2025 to 2035
  • Figure 189: Middle East and Africa Market Attractiveness by Material, 2025 to 2035
  • Figure 190: Middle East and Africa Market Attractiveness by Application, 2025 to 2035
  • Figure 191: Middle East and Africa Market Attractiveness by End Use, 2025 to 2035
  • Figure 192: Middle East and Africa Market Attractiveness by Country, 2025 to 2035

Frequently Asked Questions

What was the overall size of the dual flap dispensing closure market in 2025?

The overall market size for the dual flap dispensing closure market was USD 417.1 million in 2025.

How big is the dual flap dispensing closure market expected to be in 2035?

The dual flap dispensing closure market is expected to reach USD 648.4 million in 2035.

What will drive the demand for the dual flap dispensing closure market during the forecast period?

The increasing adoption of convenient packaging solutions in the food, personal care, and household product industries fuels the dual flap dispensing closure market during the forecast period.

List the top 5 countries contributing to the dual flap dispensing closure market.

The top 5 countries driving the development of the dual flap dispensing closure market are the USA, Germany, China, India, and Brazil.

Which is the leading segment in the dual flap dispensing closure market?

On the basis of end-use, the food packaging segment is expected to command a significant share over the forecast period.

Explore Similar Insights

Future Market Insights

Dual Flap Dispensing Closure Market