Reports

- Global Locations -

Headquarters

Future Market Insights, Inc.

Christiana Corporate, 200
Continental Drive, Suite 401,
Newark, Delaware - 19713,
United States

T: +1-845-579-5705

Americas

Future Market Insights, Inc.

616 Corporate Way, Suite 2-9018,
Valley Cottage, NY 10989, United States

T: +1-347-918-3531

MEA

Future Market Insights

1602-6 Jumeirah Bay X2 Tower, Plot No: JLT-PH2-X2A,
Jumeirah Lakes Towers, Dubai,
United Arab Emirates

Europe

Future Market Insights

3rd Floor, 207 Regent Street,
W1B 3HH London
United Kingdom

T: + 44 (0) 20 8123 9659
D: +44 (0) 20 3287 4268

Asia Pacific

Future Market Insights

IndiaLand Global Tech Park, Unit UG-1, Behind Grand HighStreet, Phase 1, Hinjawadi, MH, Pune – 411057, India

Bag Closures Market Outlook

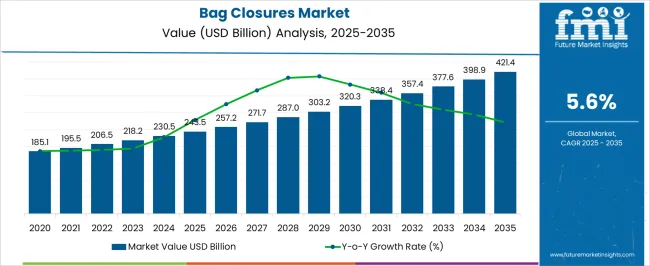
The bag closures market is capturing a valuation of US$ 217.1 million in 2023 and is predicted to reach US$ 385.1 million by 2033. The market is registering a CAGR of 5.9% during the forecast period.

Consumers' growing preference for reusable packaged foods has sparked a surge in demand for bag closures in recent years. Growing demand for bread and confessional products presents a significant potential opportunity for bag closure consumption growth over the coming years.

Attribute Details
Market CAGR (2023 to 2033) 5.9%
Market Valuation (2023) US$ 217.1 million
Market Valuation (2033) US$ 385.1 million

Don't pay for what you don't need

Customize your report by selecting specific countries or regions and save 30%!

What are the Key Trends Favoring Bag Closures Market Growth?

Increasing Demand for Reusable Packaged Food Products Drive Sales of Bag Closures & Seals, Especially Clips & Twist Ties

Sales of bag closures are closely linked to the demand for reusable packaged food products, the popular of which are bakery and confectionery items. Flexible packaging for bread processing is the prominent end user of bread clips, which number millions daily. As sales of bakery products continue to reflect above-average consumption habits, demand for these bag clips is projected to hold steady.

In addition to bread, many cafés and bakery chains worldwide have increased demand for clips and twist ties. As these are used to close coffee, tea, and other products effectively. Thus, sales of bag closures are estimated to keep increasing over the coming years.

Availability of a Wide Range of Bakery Products to Augment Demand for Bag Closures and Seals

The introduction of a broad variety of bakery products for diet and health-conscious consumers, such as gluten-free and sugar-free, has also increased demand for bag closures. Thus, during the projection period, a rising consumer base for baked and confectionery goods is expected to add to the sales of bag closures.

Furthermore, various government and non-government organizations are working to limit the use of plastic in packaging. This has raised awareness within the packaging and plastic industries.

On the plus side, this has resulted in a considerable increase in demand for twist ties and the use of paperboard to manufacture re-closures. Twist ties are predicted to be significantly more environmentally friendly than plastic clips and are estimated to aid in eliminating single-use plastic.

Increasing Fashion Trend among Working Women Driving Need & Sales of Bag Clasps and Closures

The growing female workforce and increased brand recognition are fuelling global demand for handbags. Over the past several years, expanding the availability of designer bags in various styles has raised the demand for handbags.

Worldwide, the increased use of handbags among working-class women is projected to be a prominent trend. Rising demand for handbags subsequently increases the sales of bag clasps and closures.

Bag clasps and closures are available in different designs and sizes. An increase in the standard of living and the rising fashion craze is estimated to propel the demand for bag clasps and closures.

What's Adversely Affecting the Sales of Bag Closures?

Increasing Environmental Awareness & Easy Availability of Durable Substitutes to Hinder Market Growth

During the projection period, easy availability of strong replacements and rising environmental concerns among people are projected to stifle market growth. Significant R&D expenditure on other cheaper products may also threaten market expansion.

As the general public becomes more aware of environmental concerns due to various programs on global warming. The population's thought process is shifting towards necessity over luxury. This can pose challenges to the market as fewer people are making multiple purchases and using the same products for longer periods.

Ismail Sutaria
Ismail Sutaria

Principal Consultant

Talk to Analyst

Find your sweet spots for generating winning opportunities in this market.

Bag Closures Market, 2018 to 2022 Historical Sales, Compared to 2023 to 2033 Future Outlook

The market expanded at a CAGR of 4.1% from 2018 to 2022. Demand for bag closures has risen dramatically in recent years. Bag closures and seals have regularly used packaging solutions for the packing and sealing of various sorts of bags.

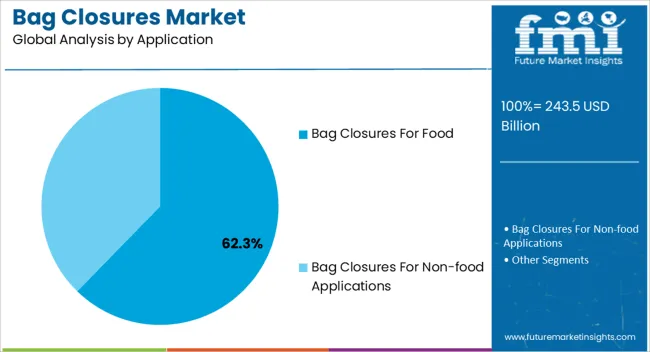
Bag closures and seals are used for reclosing or sealing flexible bags made of less expensive materials with basic but effective designs. Bag seals and closures are commonly used in the food industry for baked goods, confectionery, powdered tea & coffee, and other products. Bag closure and seal manufacturers offer goods that can be used as labels or tags to display product and manufacturer information.

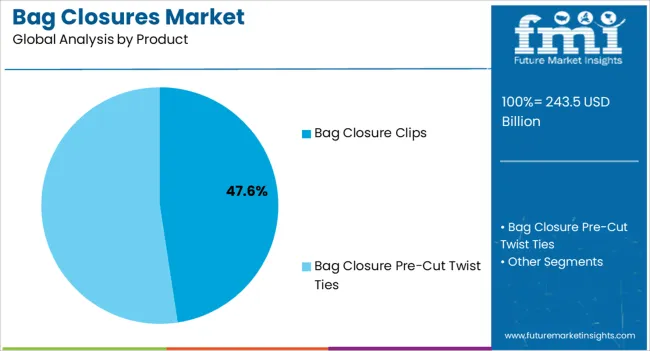
The global market is characterized by supply closure and seal products. Such as bread clips or bag closure clips, magnetic bag closures, drawstring closures, snap bag closures, zip closures, flap bag closures, clasp bag closures, tote bag closures, bag fasteners, and more. Various bag closure types are available in the market. Bags' weight and other physical parameters determine the strength and material capacity of bag closures and seals.

Furthermore, bag closure demand is influenced by its visibility among the target client group. A product such as a bag closure was previously beyond the reach of retail customers. It was only with the growth of organized retail that specialized and unique products such as bag closures began to emerge.

A wide range of items, including bag closures, have benefited from this transition. The evolution of e-commerce platforms from buying points to shopping platforms is one underlying driver. Due to the customers' continued exploration and experimentation with new items; products such as bag closures have found their way into mainstream customer marketplaces.

Comparative Analysis of Adjacent Markets

Bag Closures Market:

Attributes Bag Closures Market
CAGR (2023 to 2033) 5.9%
Value (2023) US$ 217.1 million
Value (2033) US$ 385.1 million
Trends Rising demand for hygiene, convenient, and easy-to-store products in the food & beverages sector.
Opportunities Growing advanced technologies promote sustainability and huge investment in research and development activities.

Bag Closure Clips Market:

Attributes Bag Closure Clips Market
CAGR (2023 to 2033) 5.6%
Value (2023) US$ 204.86 million
Value (2033) US$ 353.26 million
Trends Growing environmental concerns, increasing demand for bag closures in the food industry.
Opportunities Innovation of high-quality clips to closure bags, easy-to-apply closures, and growing food & beverages sector.

Plastic Caps & Closures Market:

Attributes Plastic Caps & Closures Market
CAGR (2023 to 2033) 5.3%
Value (2023) US$ 45,913 million
Value (2033) US$ 76,953 million
Trends Increasing demand for light-weighted, recyclable, and convenient packaging solutions.
Opportunities Changing consumer preferences, the popularity of screw closures, rising huge investments, and the growing beverages sector.

Get the data you need at a Fraction of the cost

Personalize your report by choosing insights you need
and save 40%!

Top Segment in the Global Market

Which Material is Highly Favoured by Suppliers of Bag Closures?

Biodegradability Quality of Paperboard Clips Dramatically Reduces Waste Caused by Plastic Clips

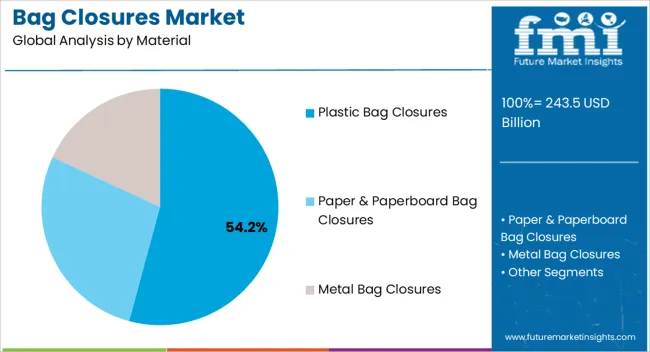
Paperboard is projected to be a game-changing material, ushering in a new era in the global market. Its strong design and biodegradability are likely to make it a popular alternative to plastic in clip production. Paper fastener evolution has been vital in reimagining the clips for appropriate closure.

According to this study, the paperboard segment is expected to represent an incremental opportunity by 2030. While complete replacement of plastic in packaging is unlikely, usage of paperboard clips is a relatively small product. It is expected to significantly impact the reduction in the accumulation of plastic trash.

Which is the Highly Profitable Regional Market for Bag Closure Suppliers?

North America to Hold Dominant Market Share Through 2030

The global market has been studied across North America, Latin America, Europe, East Asia, South Asia & Pacific, and the Middle East & Africa (MEA). The North America bag closures market accounts for a higher market share of around 38.5% in 2022. North America is estimated to continue to lead the global market, as demand for frozen meats, bread, and other packaged foods is expected to stay strong throughout the forecast period.

The Europe market is expected to account for a market share of around 18.9%. Clips are estimated to likely benefit from increased cereals for breakfast consumption across Europe. These are mostly employed in home settings and are accessible to retail consumers at mom-and-pop retail establishments. The rising cost of coffee and tea has also driven demand for resealing closures to keep them from spoiling due to air moisture.

The Latin American market is estimated to account for 9.7% of the global market share in 2022. Bag closure production in Latin America is keeping up with demand, but small and regular packaging companies are expanding their services to include bag closures.

The Asia Pacific market is estimated to account for 28% of the global market share in 2022. Plastic bag re-possibility has given the market a substantial consumer base in the Asia Pacific. Clips and twist ties are now employed in various industries to re-close flexible packaging solutions, such as those used in agriculture, food and beverages, and garbage disposal.

The demand for bag closures in MEA is expected to progress slower than other regions, but this is expected to change slightly towards the end of 2030. In 2022, the market in MEA accounted for a 4.8% share of the global market.
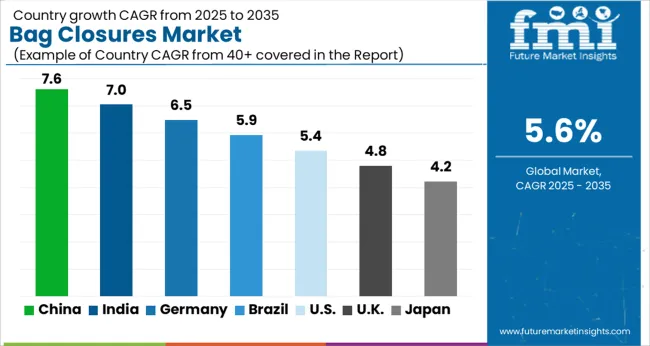
Country-wise Analysis

What is Supporting the Market Growth in China?

Rising Food & Beverage Industry Driving Consumption of Bag Closures and Seals

As demand for baked products rises, China is estimated to provide enormous potential, putting East Asia on the globe. Dietary changes and substituting bread and other sweet foods for traditional meals are estimated to help this market grow.

Although China is recognized as being a tea-drinking country, coffee is gaining appeal, particularly among young Chinese customers. China's rising food and beverage industry is estimated to contribute significantly to the demand growth for bag closures. China is securing a CAGR of 7.9% in the global market by 2033.

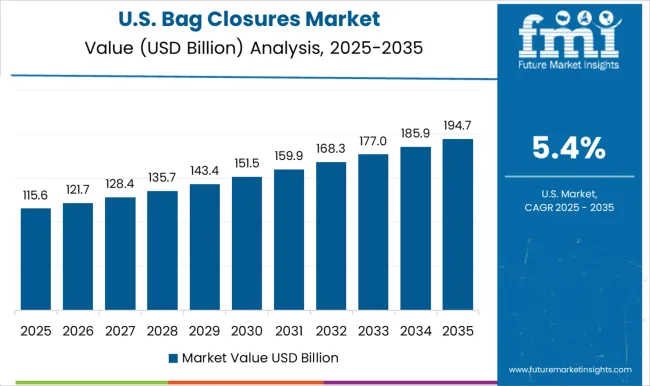
What's Driving Bag Closure Sales in the United States?

Rising Demand for Healthcare Products to Drive Sales of Bag Closures

The prevalence of obesity and other health conditions has increased in the United States, igniting a renewed sense of health and fitness among the populace. Growing emphasis on health and fitness has boosted demand for healthy drinks, driving bag closure sales.

Other factors driving bag closure shipments in the United States include large beverage makers, a high spending potential population, and rising demand for alcoholic beverages, spirits, healthy drinks, and RTD beverages. The United States is registering a share of 31.8% in the global market during the forecast period.
Competitive Landscape

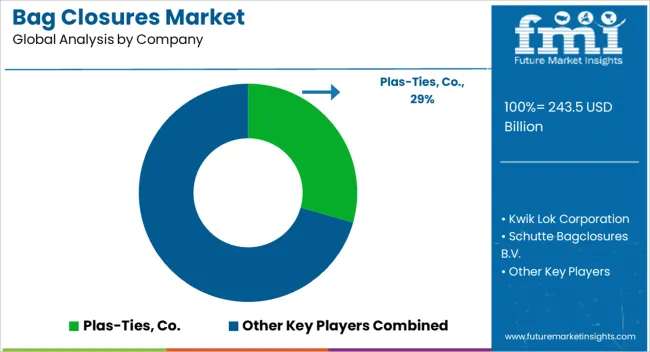
The bag closures market is fragmented, with regional and global companies competing. The rise of regional companies and increasing investments in upstream applications are shaping the competitive landscape.

Leading bag closure manufacturers such as Kwik Lok Corporation, Schutte bag closures B.V., Bedford Industries Inc., Multi-Pack Solutions LLC, Plas-Ties Co., International Plastics Inc., AndFel Corp., Detmold Group, and GBE Product Packaging are included in this report.

Product launches, acquisitions, and partnerships are a part of the growth strategies of leading manufacturers of bag closures, all of which contribute to the global growth of the market.

Other Prominent Players in the Global Market are:

  • Plas-Ties, Co.
  • Kwik Lok Corporation
  • Schutte Bagclosures B.V.
  • Bedford Industries, Inc.
  • Multipack B.V.B.A.
  • International Plastics Inc.
  • Inno Bag Closure
  • Truseal (Pty) Ltd.
  • Vikela Aluvin Pty Ltd.
  • ITW Envopak Limited
  • T & T Industries Inc.
  • Zhenjiang Hongda Commodity Co., Ltd.
  • AndFel Corporation
  • Detmold Group
  • A. Rifkin Co.
  • HSA International Group.

Recent Developments in the Global Market are:

Velcro Companies announced its newly launched closure bags such as straps, adhesive-backed tapes, and specialty fasteners. The company continues to innovate improved products to expand its business portfolio.

Scope of Report

Attribute Details
Forecast Period 2023 to 2033
Historical Data Available for 2018 to 2022
Market Analysis US$ billion for Value
Key Countries Covered United States, United Kingdom, Japan, India, China, Australia, Germany
Key Segments Covered
  • Material
  • Product
  • Application
  • Region
Key Companies Profiled
  • Plas-Ties, Co.
  • Kwik Lok Corporation
  • Schutte Bagclosures B.V.
  • Bedford Industries, Inc.
  • Multipack B.V.B.A.
  • International Plastics Inc.
  • Inno Bag Closure
  • Truseal (Pty) Ltd.
  • Vikela Aluvin Pty Ltd.
  • ITW Envopak Limited
  • T & T Industries Inc.
  • Zhenjiang Hongda Commodity Co., Ltd.
  • AndFel Corporation
  • Detmold Group
  • A. Rifkin Co.
  • HSA International Group.
Report Coverage Market Forecast, Company Share Analysis, Competition Intelligence, DROT Analysis, Market Dynamics and Challenges, and Strategic Growth Initiatives
Customization & Pricing Available upon Request

Bag Closures Market by Category

By Material:

  • Plastic Bag Closures
    • Polyethylene (PE)
    • Polypropylene (PP)
    • Polystyrene (PS)
    • Polyethylene Terephthalate (PET)
    • Polyvinyl Chloride (PVC)
  • Paper & Paperboard Bag Closures
  • Metal Bag Closures

By Product:

  • Bag Closure Clips
    • Clip Bands
    • Multi-clips
  • Bag Closure Pre-cut Twist Ties
    • Twist-bands/Twist-strips
    • Tin Ties

By Application:

  • Bag Closures for Food
    • Bakery & Confectionery
    • Fruits & Vegetables
    • Meat
    • Poultry & Seafood
    • Ready-to-Eat Food
    • Others (Tea, Coffee, etc.)
  • Bag Closures for Non-food Applications
    • Garbage / Trash
    • Security Packaging
    • Others (Toys, Stationery, etc.)

By Region:

  • North America
  • Latin America
  • Europe
  • Asia Pacific
  • The Middle East and Africa

Frequently Asked Questions

How large has the Bag Closures Market grown?

By 2023-end, the fruit powders market will reach a valuation of US$ 217.1 million.

What is the scope of the Bag Closures Market's reach by 2033?

The global market size is to reach US$ 385.1 million by 2033.

What creates Demand in the Bag Closures Market?

Increasing demand for reusable packaged food products drives sales in the market.

What Limits the Growth Potential of the Market?

Increasing environmental awareness and easy availability of durable substitutes limits market potential.

Which is the Top Trend in the Bag Closures Market?

The increasing fashion styles trending among working women is a popular trend in the market.

Table of Content

1. Executive Summary

    1.1. Global Market Outlook

    1.2. Demand-side Trends

    1.3. Supply-side Trends

    1.4. Technology Roadmap Analysis

    1.5. Analysis and Recommendations

2. Market Overview

    2.1. Market Coverage / Taxonomy

    2.2. Market Definition / Scope / Limitations

3. Market Background

    3.1. Market Dynamics

        3.1.1. Drivers

        3.1.2. Restraints

        3.1.3. Opportunity

        3.1.4. Trends

    3.2. Scenario Forecast

        3.2.1. Demand in Optimistic Scenario

        3.2.2. Demand in Likely Scenario

        3.2.3. Demand in Conservative Scenario

    3.3. Opportunity Map Analysis

    3.4. Product Life Cycle Analysis

    3.5. Supply Chain Analysis

        3.5.1. Supply Side Participants and their Roles

            3.5.1.1. Producers

            3.5.1.2. Mid-Level Participants (Traders/ Agents/ Brokers)

            3.5.1.3. Wholesalers and Distributors

        3.5.2. Value Added and Value Created at Node in the Supply Chain

        3.5.3. List of Raw Material Suppliers

        3.5.4. List of Existing and Potential Buyer’s

    3.6. Investment Feasibility Matrix

    3.7. Value Chain Analysis

        3.7.1. Profit Margin Analysis

        3.7.2. Wholesalers and Distributors

        3.7.3. Retailers

    3.8. PESTLE and Porter’s Analysis

    3.9. Regulatory Landscape

        3.9.1. By Key Regions

        3.9.2. By Key Countries

    3.10. Regional Parent Market Outlook

    3.11. Production and Consumption Statistics

    3.12. Import and Export Statistics

4. Global Market Analysis 2018 to 2022 and Forecast, 2023 to 2033

    4.1. Historical Market Size Value (US$ Million) & Volume (Units) Analysis, 2018 to 2022

    4.2. Current and Future Market Size Value (US$ Million) & Volume (Units) Projections, 2023 to 2033

        4.2.1. Y-o-Y Growth Trend Analysis

        4.2.2. Absolute $ Opportunity Analysis

5. Global Market Analysis 2018 to 2022 and Forecast 2023 to 2033, By Material

    5.1. Introduction / Key Findings

    5.2. Historical Market Size Value (US$ Million) & Volume (Units) Analysis By Material, 2018 to 2022

    5.3. Current and Future Market Size Value (US$ Million) & Volume (Units) Analysis and Forecast By Material, 2023 to 2033

        5.3.1. Plastic

            5.3.1.1. Polyethylene (PE)

            5.3.1.2. Polypropylene (PP)

            5.3.1.3. Polystyrene (PS)

            5.3.1.4. Polyethylene Terephthalate (PET)

            5.3.1.5. Polyvinyl Chloride (PVC)

        5.3.2. Paper & Paperboard

        5.3.3. Metal

    5.4. Y-o-Y Growth Trend Analysis By Material, 2018 to 2022

    5.5. Absolute $ Opportunity Analysis By Material, 2023 to 2033

6. Global Market Analysis 2018 to 2022 and Forecast 2023 to 2033, By Product

    6.1. Introduction / Key Findings

    6.2. Historical Market Size Value (US$ Million) & Volume (Units) Analysis By Product, 2018 to 2022

    6.3. Current and Future Market Size Value (US$ Million) & Volume (Units) Analysis and Forecast By Product, 2023 to 2033

        6.3.1. Bag Closure Clips

            6.3.1.1. Clip Bands

            6.3.1.2. Multi-clips

        6.3.2. Bag Closure Pre-cut Twist Ties

            6.3.2.1. Twist-bands/Twist-strips

            6.3.2.2. Tin Ties

    6.4. Y-o-Y Growth Trend Analysis By Product, 2018 to 2022

    6.5. Absolute $ Opportunity Analysis By Product, 2023 to 2033

7. Global Market Analysis 2018 to 2022 and Forecast 2023 to 2033, By Application

    7.1. Introduction / Key Findings

    7.2. Historical Market Size Value (US$ Million) & Volume (Units) Analysis By Application, 2018 to 2022

    7.3. Current and Future Market Size Value (US$ Million) & Volume (Units) Analysis and Forecast By Application, 2023 to 2033

        7.3.1. for Food

            7.3.1.1. Bakery & Confectionery

            7.3.1.2. Fruits & Vegetables

            7.3.1.3. Meat

            7.3.1.4. Poultry & Seafood

            7.3.1.5. Ready-to-Eat Food

            7.3.1.6. Others

        7.3.2. for Non-food Applications

            7.3.2.1. Garbage / Trash

            7.3.2.2. Security Packaging

            7.3.2.3. Others

    7.4. Y-o-Y Growth Trend Analysis By Application, 2018 to 2022

    7.5. Absolute $ Opportunity Analysis By Application, 2023 to 2033

8. Global Market Analysis 2018 to 2022 and Forecast 2023 to 2033, By Region

    8.1. Introduction

    8.2. Historical Market Size Value (US$ Million) & Volume (Units) Analysis By Region, 2018 to 2022

    8.3. Current Market Size Value (US$ Million) & Volume (Units) Analysis and Forecast By Region, 2023 to 2033

        8.3.1. North America

        8.3.2. Latin America

        8.3.3. Europe

        8.3.4. Asia Pacific

        8.3.5. MEA

    8.4. Market Attractiveness Analysis By Region

9. North America Market Analysis 2018 to 2022 and Forecast 2023 to 2033, By Country

    9.1. Historical Market Size Value (US$ Million) & Volume (Units) Trend Analysis By Market Taxonomy, 2018 to 2022

    9.2. Market Size Value (US$ Million) & Volume (Units) Forecast By Market Taxonomy, 2023 to 2033

        9.2.1. By Country

            9.2.1.1. The USA

            9.2.1.2. Canada

        9.2.2. By Material

        9.2.3. By Product

        9.2.4. By Application

    9.3. Market Attractiveness Analysis

        9.3.1. By Country

        9.3.2. By Material

        9.3.3. By Product

        9.3.4. By Application

    9.4. Key Takeaways

10. Latin America Market Analysis 2018 to 2022 and Forecast 2023 to 2033, By Country

    10.1. Historical Market Size Value (US$ Million) & Volume (Units) Trend Analysis By Market Taxonomy, 2018 to 2022

    10.2. Market Size Value (US$ Million) & Volume (Units) Forecast By Market Taxonomy, 2023 to 2033

        10.2.1. By Country

            10.2.1.1. Brazil

            10.2.1.2. Mexico

            10.2.1.3. Rest of Latin America

        10.2.2. By Material

        10.2.3. By Product

        10.2.4. By Application

    10.3. Market Attractiveness Analysis

        10.3.1. By Country

        10.3.2. By Material

        10.3.3. By Product

        10.3.4. By Application

    10.4. Key Takeaways

11. Europe Market Analysis 2018 to 2022 and Forecast 2023 to 2033, By Country

    11.1. Historical Market Size Value (US$ Million) & Volume (Units) Trend Analysis By Market Taxonomy, 2018 to 2022

    11.2. Market Size Value (US$ Million) & Volume (Units) Forecast By Market Taxonomy, 2023 to 2033

        11.2.1. By Country

            11.2.1.1. Germany

            11.2.1.2. United Kingdom

            11.2.1.3. France

            11.2.1.4. Spain

            11.2.1.5. Italy

            11.2.1.6. Rest of Europe

        11.2.2. By Material

        11.2.3. By Product

        11.2.4. By Application

    11.3. Market Attractiveness Analysis

        11.3.1. By Country

        11.3.2. By Material

        11.3.3. By Product

        11.3.4. By Application

    11.4. Key Takeaways

12. Asia Pacific Market Analysis 2018 to 2022 and Forecast 2023 to 2033, By Country

    12.1. Historical Market Size Value (US$ Million) & Volume (Units) Trend Analysis By Market Taxonomy, 2018 to 2022

    12.2. Market Size Value (US$ Million) & Volume (Units) Forecast By Market Taxonomy, 2023 to 2033

        12.2.1. By Country

            12.2.1.1. China

            12.2.1.2. Japan

            12.2.1.3. South Korea

            12.2.1.4. Singapore

            12.2.1.5. Thailand

            12.2.1.6. Indonesia

            12.2.1.7. Australia

            12.2.1.8. New Zealand

            12.2.1.9. Rest of Asia Pacific

        12.2.2. By Material

        12.2.3. By Product

        12.2.4. By Application

    12.3. Market Attractiveness Analysis

        12.3.1. By Country

        12.3.2. By Material

        12.3.3. By Product

        12.3.4. By Application

    12.4. Key Takeaways

13. MEA Market Analysis 2018 to 2022 and Forecast 2023 to 2033, By Country

    13.1. Historical Market Size Value (US$ Million) & Volume (Units) Trend Analysis By Market Taxonomy, 2018 to 2022

    13.2. Market Size Value (US$ Million) & Volume (Units) Forecast By Market Taxonomy, 2023 to 2033

        13.2.1. By Country

            13.2.1.1. GCC Countries

            13.2.1.2. South Africa

            13.2.1.3. Israel

            13.2.1.4. Rest of MEA

        13.2.2. By Material

        13.2.3. By Product

        13.2.4. By Application

    13.3. Market Attractiveness Analysis

        13.3.1. By Country

        13.3.2. By Material

        13.3.3. By Product

        13.3.4. By Application

    13.4. Key Takeaways

14. Key Countries Market Analysis

    14.1. USA

        14.1.1. Pricing Analysis

        14.1.2. Market Share Analysis, 2022

            14.1.2.1. By Material

            14.1.2.2. By Product

            14.1.2.3. By Application

    14.2. Canada

        14.2.1. Pricing Analysis

        14.2.2. Market Share Analysis, 2022

            14.2.2.1. By Material

            14.2.2.2. By Product

            14.2.2.3. By Application

    14.3. Brazil

        14.3.1. Pricing Analysis

        14.3.2. Market Share Analysis, 2022

            14.3.2.1. By Material

            14.3.2.2. By Product

            14.3.2.3. By Application

    14.4. Mexico

        14.4.1. Pricing Analysis

        14.4.2. Market Share Analysis, 2022

            14.4.2.1. By Material

            14.4.2.2. By Product

            14.4.2.3. By Application

    14.5. Germany

        14.5.1. Pricing Analysis

        14.5.2. Market Share Analysis, 2022

            14.5.2.1. By Material

            14.5.2.2. By Product

            14.5.2.3. By Application

    14.6. United Kingdom

        14.6.1. Pricing Analysis

        14.6.2. Market Share Analysis, 2022

            14.6.2.1. By Material

            14.6.2.2. By Product

            14.6.2.3. By Application

    14.7. France

        14.7.1. Pricing Analysis

        14.7.2. Market Share Analysis, 2022

            14.7.2.1. By Material

            14.7.2.2. By Product

            14.7.2.3. By Application

    14.8. Spain

        14.8.1. Pricing Analysis

        14.8.2. Market Share Analysis, 2022

            14.8.2.1. By Material

            14.8.2.2. By Product

            14.8.2.3. By Application

    14.9. Italy

        14.9.1. Pricing Analysis

        14.9.2. Market Share Analysis, 2022

            14.9.2.1. By Material

            14.9.2.2. By Product

            14.9.2.3. By Application

    14.10. China

        14.10.1. Pricing Analysis

        14.10.2. Market Share Analysis, 2022

            14.10.2.1. By Material

            14.10.2.2. By Product

            14.10.2.3. By Application

    14.11. Japan

        14.11.1. Pricing Analysis

        14.11.2. Market Share Analysis, 2022

            14.11.2.1. By Material

            14.11.2.2. By Product

            14.11.2.3. By Application

    14.12. South Korea

        14.12.1. Pricing Analysis

        14.12.2. Market Share Analysis, 2022

            14.12.2.1. By Material

            14.12.2.2. By Product

            14.12.2.3. By Application

    14.13. Singapore

        14.13.1. Pricing Analysis

        14.13.2. Market Share Analysis, 2022

            14.13.2.1. By Material

            14.13.2.2. By Product

            14.13.2.3. By Application

    14.14. Thailand

        14.14.1. Pricing Analysis

        14.14.2. Market Share Analysis, 2022

            14.14.2.1. By Material

            14.14.2.2. By Product

            14.14.2.3. By Application

    14.15. Indonesia

        14.15.1. Pricing Analysis

        14.15.2. Market Share Analysis, 2022

            14.15.2.1. By Material

            14.15.2.2. By Product

            14.15.2.3. By Application

    14.16. Australia

        14.16.1. Pricing Analysis

        14.16.2. Market Share Analysis, 2022

            14.16.2.1. By Material

            14.16.2.2. By Product

            14.16.2.3. By Application

    14.17. New Zealand

        14.17.1. Pricing Analysis

        14.17.2. Market Share Analysis, 2022

            14.17.2.1. By Material

            14.17.2.2. By Product

            14.17.2.3. By Application

    14.18. GCC Countries

        14.18.1. Pricing Analysis

        14.18.2. Market Share Analysis, 2022

            14.18.2.1. By Material

            14.18.2.2. By Product

            14.18.2.3. By Application

    14.19. South Africa

        14.19.1. Pricing Analysis

        14.19.2. Market Share Analysis, 2022

            14.19.2.1. By Material

            14.19.2.2. By Product

            14.19.2.3. By Application

    14.20. Israel

        14.20.1. Pricing Analysis

        14.20.2. Market Share Analysis, 2022

            14.20.2.1. By Material

            14.20.2.2. By Product

            14.20.2.3. By Application

15. Market Structure Analysis

    15.1. Competition Dashboard

    15.2. Competition Benchmarking

    15.3. Market Share Analysis of Top Players

        15.3.1. By Regional

        15.3.2. By Material

        15.3.3. By Product

        15.3.4. By Application

16. Competition Analysis

    16.1. Competition Deep Dive

        16.1.1. Plas-Ties, Co.

            16.1.1.1. Overview

            16.1.1.2. Product Portfolio

            16.1.1.3. Profitability by Market Segments

            16.1.1.4. Sales Footprint

            16.1.1.5. Strategy Overview

                16.1.1.5.1. Marketing Strategy

                16.1.1.5.2. Product Strategy

                16.1.1.5.3. Channel Strategy

        16.1.2. Kwik Lok Corporation

            16.1.2.1. Overview

            16.1.2.2. Product Portfolio

            16.1.2.3. Profitability by Market Segments

            16.1.2.4. Sales Footprint

            16.1.2.5. Strategy Overview

                16.1.2.5.1. Marketing Strategy

                16.1.2.5.2. Product Strategy

                16.1.2.5.3. Channel Strategy

        16.1.3. Schutte Bagclosures B.V.

            16.1.3.1. Overview

            16.1.3.2. Product Portfolio

            16.1.3.3. Profitability by Market Segments

            16.1.3.4. Sales Footprint

            16.1.3.5. Strategy Overview

                16.1.3.5.1. Marketing Strategy

                16.1.3.5.2. Product Strategy

                16.1.3.5.3. Channel Strategy

        16.1.4. Bedford Industries, Inc.

            16.1.4.1. Overview

            16.1.4.2. Product Portfolio

            16.1.4.3. Profitability by Market Segments

            16.1.4.4. Sales Footprint

            16.1.4.5. Strategy Overview

                16.1.4.5.1. Marketing Strategy

                16.1.4.5.2. Product Strategy

                16.1.4.5.3. Channel Strategy

        16.1.5. Multipack B.V.B.A.

            16.1.5.1. Overview

            16.1.5.2. Product Portfolio

            16.1.5.3. Profitability by Market Segments

            16.1.5.4. Sales Footprint

            16.1.5.5. Strategy Overview

                16.1.5.5.1. Marketing Strategy

                16.1.5.5.2. Product Strategy

                16.1.5.5.3. Channel Strategy

        16.1.6. International Plastics Inc.

            16.1.6.1. Overview

            16.1.6.2. Product Portfolio

            16.1.6.3. Profitability by Market Segments

            16.1.6.4. Sales Footprint

            16.1.6.5. Strategy Overview

                16.1.6.5.1. Marketing Strategy

                16.1.6.5.2. Product Strategy

                16.1.6.5.3. Channel Strategy

        16.1.7. Inno Bag Closure

            16.1.7.1. Overview

            16.1.7.2. Product Portfolio

            16.1.7.3. Profitability by Market Segments

            16.1.7.4. Sales Footprint

            16.1.7.5. Strategy Overview

                16.1.7.5.1. Marketing Strategy

                16.1.7.5.2. Product Strategy

                16.1.7.5.3. Channel Strategy

        16.1.8. Truseal (Pty) Ltd.

            16.1.8.1. Overview

            16.1.8.2. Product Portfolio

            16.1.8.3. Profitability by Market Segments

            16.1.8.4. Sales Footprint

            16.1.8.5. Strategy Overview

                16.1.8.5.1. Marketing Strategy

                16.1.8.5.2. Product Strategy

                16.1.8.5.3. Channel Strategy

        16.1.9. Vikela Aluvin Pty Ltd.

            16.1.9.1. Overview

            16.1.9.2. Product Portfolio

            16.1.9.3. Profitability by Market Segments

            16.1.9.4. Sales Footprint

            16.1.9.5. Strategy Overview

                16.1.9.5.1. Marketing Strategy

                16.1.9.5.2. Product Strategy

                16.1.9.5.3. Channel Strategy

        16.1.10. ITW Envopak Limited

            16.1.10.1. Overview

            16.1.10.2. Product Portfolio

            16.1.10.3. Profitability by Market Segments

            16.1.10.4. Sales Footprint

            16.1.10.5. Strategy Overview

                16.1.10.5.1. Marketing Strategy

                16.1.10.5.2. Product Strategy

                16.1.10.5.3. Channel Strategy

        16.1.11. T & T Industries Inc.

            16.1.11.1. Overview

            16.1.11.2. Product Portfolio

            16.1.11.3. Profitability by Market Segments

            16.1.11.4. Sales Footprint

            16.1.11.5. Strategy Overview

                16.1.11.5.1. Marketing Strategy

                16.1.11.5.2. Product Strategy

                16.1.11.5.3. Channel Strategy

        16.1.12. Zhenjiang Hongda Commodity Co., Ltd.

            16.1.12.1. Overview

            16.1.12.2. Product Portfolio

            16.1.12.3. Profitability by Market Segments

            16.1.12.4. Sales Footprint

            16.1.12.5. Strategy Overview

                16.1.12.5.1. Marketing Strategy

                16.1.12.5.2. Product Strategy

                16.1.12.5.3. Channel Strategy

        16.1.13. AndFel Corporation

            16.1.13.1. Overview

            16.1.13.2. Product Portfolio

            16.1.13.3. Profitability by Market Segments

            16.1.13.4. Sales Footprint

            16.1.13.5. Strategy Overview

                16.1.13.5.1. Marketing Strategy

                16.1.13.5.2. Product Strategy

                16.1.13.5.3. Channel Strategy

        16.1.14. Detmold Group

            16.1.14.1. Overview

            16.1.14.2. Product Portfolio

            16.1.14.3. Profitability by Market Segments

            16.1.14.4. Sales Footprint

            16.1.14.5. Strategy Overview

                16.1.14.5.1. Marketing Strategy

                16.1.14.5.2. Product Strategy

                16.1.14.5.3. Channel Strategy

        16.1.15. A. Rifkin Co.

            16.1.15.1. Overview

            16.1.15.2. Product Portfolio

            16.1.15.3. Profitability by Market Segments

            16.1.15.4. Sales Footprint

            16.1.15.5. Strategy Overview

                16.1.15.5.1. Marketing Strategy

                16.1.15.5.2. Product Strategy

                16.1.15.5.3. Channel Strategy

        16.1.16. HSA International Group.

            16.1.16.1. Overview

            16.1.16.2. Product Portfolio

            16.1.16.3. Profitability by Market Segments

            16.1.16.4. Sales Footprint

            16.1.16.5. Strategy Overview

                16.1.16.5.1. Marketing Strategy

                16.1.16.5.2. Product Strategy

                16.1.16.5.3. Channel Strategy

17. Assumptions & Acronyms Used

18. Research Methodology

Don't pay for what you don't need

Customize your report by selecting specific countries or regions and save 30%!

List of Tables

Table 1: Global Market Value (US$ Million) Forecast by Region, 2018 to 2033

Table 2: Global Market Volume (Units) Forecast by Region, 2018 to 2033

Table 3: Global Market Value (US$ Million) Forecast by Material, 2018 to 2033

Table 4: Global Market Volume (Units) Forecast by Material, 2018 to 2033

Table 5: Global Market Value (US$ Million) Forecast by Product, 2018 to 2033

Table 6: Global Market Volume (Units) Forecast by Product, 2018 to 2033

Table 7: Global Market Value (US$ Million) Forecast by Application, 2018 to 2033

Table 8: Global Market Volume (Units) Forecast by Application, 2018 to 2033

Table 9: North America Market Value (US$ Million) Forecast by Country, 2018 to 2033

Table 10: North America Market Volume (Units) Forecast by Country, 2018 to 2033

Table 11: North America Market Value (US$ Million) Forecast by Material, 2018 to 2033

Table 12: North America Market Volume (Units) Forecast by Material, 2018 to 2033

Table 13: North America Market Value (US$ Million) Forecast by Product, 2018 to 2033

Table 14: North America Market Volume (Units) Forecast by Product, 2018 to 2033

Table 15: North America Market Value (US$ Million) Forecast by Application, 2018 to 2033

Table 16: North America Market Volume (Units) Forecast by Application, 2018 to 2033

Table 17: Latin America Market Value (US$ Million) Forecast by Country, 2018 to 2033

Table 18: Latin America Market Volume (Units) Forecast by Country, 2018 to 2033

Table 19: Latin America Market Value (US$ Million) Forecast by Material, 2018 to 2033

Table 20: Latin America Market Volume (Units) Forecast by Material, 2018 to 2033

Table 21: Latin America Market Value (US$ Million) Forecast by Product, 2018 to 2033

Table 22: Latin America Market Volume (Units) Forecast by Product, 2018 to 2033

Table 23: Latin America Market Value (US$ Million) Forecast by Application, 2018 to 2033

Table 24: Latin America Market Volume (Units) Forecast by Application, 2018 to 2033

Table 25: Europe Market Value (US$ Million) Forecast by Country, 2018 to 2033

Table 26: Europe Market Volume (Units) Forecast by Country, 2018 to 2033

Table 27: Europe Market Value (US$ Million) Forecast by Material, 2018 to 2033

Table 28: Europe Market Volume (Units) Forecast by Material, 2018 to 2033

Table 29: Europe Market Value (US$ Million) Forecast by Product, 2018 to 2033

Table 30: Europe Market Volume (Units) Forecast by Product, 2018 to 2033

Table 31: Europe Market Value (US$ Million) Forecast by Application, 2018 to 2033

Table 32: Europe Market Volume (Units) Forecast by Application, 2018 to 2033

Table 33: Asia Pacific Market Value (US$ Million) Forecast by Country, 2018 to 2033

Table 34: Asia Pacific Market Volume (Units) Forecast by Country, 2018 to 2033

Table 35: Asia Pacific Market Value (US$ Million) Forecast by Material, 2018 to 2033

Table 36: Asia Pacific Market Volume (Units) Forecast by Material, 2018 to 2033

Table 37: Asia Pacific Market Value (US$ Million) Forecast by Product, 2018 to 2033

Table 38: Asia Pacific Market Volume (Units) Forecast by Product, 2018 to 2033

Table 39: Asia Pacific Market Value (US$ Million) Forecast by Application, 2018 to 2033

Table 40: Asia Pacific Market Volume (Units) Forecast by Application, 2018 to 2033

Table 41: MEA Market Value (US$ Million) Forecast by Country, 2018 to 2033

Table 42: MEA Market Volume (Units) Forecast by Country, 2018 to 2033

Table 43: MEA Market Value (US$ Million) Forecast by Material, 2018 to 2033

Table 44: MEA Market Volume (Units) Forecast by Material, 2018 to 2033

Table 45: MEA Market Value (US$ Million) Forecast by Product, 2018 to 2033

Table 46: MEA Market Volume (Units) Forecast by Product, 2018 to 2033

Table 47: MEA Market Value (US$ Million) Forecast by Application, 2018 to 2033

Table 48: MEA Market Volume (Units) Forecast by Application, 2018 to 2033
Ismail Sutaria
Ismail Sutaria

Principal Consultant

Talk to Analyst

Find your sweet spots for generating winning opportunities in this market.

List of Charts

Figure 1: Global Market Value (US$ Million) by Material, 2023 to 2033

Figure 2: Global Market Value (US$ Million) by Product, 2023 to 2033

Figure 3: Global Market Value (US$ Million) by Application, 2023 to 2033

Figure 4: Global Market Value (US$ Million) by Region, 2023 to 2033

Figure 5: Global Market Value (US$ Million) Analysis by Region, 2018 to 2033

Figure 6: Global Market Volume (Units) Analysis by Region, 2018 to 2033

Figure 7: Global Market Value Share (%) and BPS Analysis by Region, 2023 to 2033

Figure 8: Global Market Y-o-Y Growth (%) Projections by Region, 2023 to 2033

Figure 9: Global Market Value (US$ Million) Analysis by Material, 2018 to 2033

Figure 10: Global Market Volume (Units) Analysis by Material, 2018 to 2033

Figure 11: Global Market Value Share (%) and BPS Analysis by Material, 2023 to 2033

Figure 12: Global Market Y-o-Y Growth (%) Projections by Material, 2023 to 2033

Figure 13: Global Market Value (US$ Million) Analysis by Product, 2018 to 2033

Figure 14: Global Market Volume (Units) Analysis by Product, 2018 to 2033

Figure 15: Global Market Value Share (%) and BPS Analysis by Product, 2023 to 2033

Figure 16: Global Market Y-o-Y Growth (%) Projections by Product, 2023 to 2033

Figure 17: Global Market Value (US$ Million) Analysis by Application, 2018 to 2033

Figure 18: Global Market Volume (Units) Analysis by Application, 2018 to 2033

Figure 19: Global Market Value Share (%) and BPS Analysis by Application, 2023 to 2033

Figure 20: Global Market Y-o-Y Growth (%) Projections by Application, 2023 to 2033

Figure 21: Global Market Attractiveness by Material, 2023 to 2033

Figure 22: Global Market Attractiveness by Product, 2023 to 2033

Figure 23: Global Market Attractiveness by Application, 2023 to 2033

Figure 24: Global Market Attractiveness by Region, 2023 to 2033

Figure 25: North America Market Value (US$ Million) by Material, 2023 to 2033

Figure 26: North America Market Value (US$ Million) by Product, 2023 to 2033

Figure 27: North America Market Value (US$ Million) by Application, 2023 to 2033

Figure 28: North America Market Value (US$ Million) by Country, 2023 to 2033

Figure 29: North America Market Value (US$ Million) Analysis by Country, 2018 to 2033

Figure 30: North America Market Volume (Units) Analysis by Country, 2018 to 2033

Figure 31: North America Market Value Share (%) and BPS Analysis by Country, 2023 to 2033

Figure 32: North America Market Y-o-Y Growth (%) Projections by Country, 2023 to 2033

Figure 33: North America Market Value (US$ Million) Analysis by Material, 2018 to 2033

Figure 34: North America Market Volume (Units) Analysis by Material, 2018 to 2033

Figure 35: North America Market Value Share (%) and BPS Analysis by Material, 2023 to 2033

Figure 36: North America Market Y-o-Y Growth (%) Projections by Material, 2023 to 2033

Figure 37: North America Market Value (US$ Million) Analysis by Product, 2018 to 2033

Figure 38: North America Market Volume (Units) Analysis by Product, 2018 to 2033

Figure 39: North America Market Value Share (%) and BPS Analysis by Product, 2023 to 2033

Figure 40: North America Market Y-o-Y Growth (%) Projections by Product, 2023 to 2033

Figure 41: North America Market Value (US$ Million) Analysis by Application, 2018 to 2033

Figure 42: North America Market Volume (Units) Analysis by Application, 2018 to 2033

Figure 43: North America Market Value Share (%) and BPS Analysis by Application, 2023 to 2033

Figure 44: North America Market Y-o-Y Growth (%) Projections by Application, 2023 to 2033

Figure 45: North America Market Attractiveness by Material, 2023 to 2033

Figure 46: North America Market Attractiveness by Product, 2023 to 2033

Figure 47: North America Market Attractiveness by Application, 2023 to 2033

Figure 48: North America Market Attractiveness by Country, 2023 to 2033

Figure 49: Latin America Market Value (US$ Million) by Material, 2023 to 2033

Figure 50: Latin America Market Value (US$ Million) by Product, 2023 to 2033

Figure 51: Latin America Market Value (US$ Million) by Application, 2023 to 2033

Figure 52: Latin America Market Value (US$ Million) by Country, 2023 to 2033

Figure 53: Latin America Market Value (US$ Million) Analysis by Country, 2018 to 2033

Figure 54: Latin America Market Volume (Units) Analysis by Country, 2018 to 2033

Figure 55: Latin America Market Value Share (%) and BPS Analysis by Country, 2023 to 2033

Figure 56: Latin America Market Y-o-Y Growth (%) Projections by Country, 2023 to 2033

Figure 57: Latin America Market Value (US$ Million) Analysis by Material, 2018 to 2033

Figure 58: Latin America Market Volume (Units) Analysis by Material, 2018 to 2033

Figure 59: Latin America Market Value Share (%) and BPS Analysis by Material, 2023 to 2033

Figure 60: Latin America Market Y-o-Y Growth (%) Projections by Material, 2023 to 2033

Figure 61: Latin America Market Value (US$ Million) Analysis by Product, 2018 to 2033

Figure 62: Latin America Market Volume (Units) Analysis by Product, 2018 to 2033

Figure 63: Latin America Market Value Share (%) and BPS Analysis by Product, 2023 to 2033

Figure 64: Latin America Market Y-o-Y Growth (%) Projections by Product, 2023 to 2033

Figure 65: Latin America Market Value (US$ Million) Analysis by Application, 2018 to 2033

Figure 66: Latin America Market Volume (Units) Analysis by Application, 2018 to 2033

Figure 67: Latin America Market Value Share (%) and BPS Analysis by Application, 2023 to 2033

Figure 68: Latin America Market Y-o-Y Growth (%) Projections by Application, 2023 to 2033

Figure 69: Latin America Market Attractiveness by Material, 2023 to 2033

Figure 70: Latin America Market Attractiveness by Product, 2023 to 2033

Figure 71: Latin America Market Attractiveness by Application, 2023 to 2033

Figure 72: Latin America Market Attractiveness by Country, 2023 to 2033

Figure 73: Europe Market Value (US$ Million) by Material, 2023 to 2033

Figure 74: Europe Market Value (US$ Million) by Product, 2023 to 2033

Figure 75: Europe Market Value (US$ Million) by Application, 2023 to 2033

Figure 76: Europe Market Value (US$ Million) by Country, 2023 to 2033

Figure 77: Europe Market Value (US$ Million) Analysis by Country, 2018 to 2033

Figure 78: Europe Market Volume (Units) Analysis by Country, 2018 to 2033

Figure 79: Europe Market Value Share (%) and BPS Analysis by Country, 2023 to 2033

Figure 80: Europe Market Y-o-Y Growth (%) Projections by Country, 2023 to 2033

Figure 81: Europe Market Value (US$ Million) Analysis by Material, 2018 to 2033

Figure 82: Europe Market Volume (Units) Analysis by Material, 2018 to 2033

Figure 83: Europe Market Value Share (%) and BPS Analysis by Material, 2023 to 2033

Figure 84: Europe Market Y-o-Y Growth (%) Projections by Material, 2023 to 2033

Figure 85: Europe Market Value (US$ Million) Analysis by Product, 2018 to 2033

Figure 86: Europe Market Volume (Units) Analysis by Product, 2018 to 2033

Figure 87: Europe Market Value Share (%) and BPS Analysis by Product, 2023 to 2033

Figure 88: Europe Market Y-o-Y Growth (%) Projections by Product, 2023 to 2033

Figure 89: Europe Market Value (US$ Million) Analysis by Application, 2018 to 2033

Figure 90: Europe Market Volume (Units) Analysis by Application, 2018 to 2033

Figure 91: Europe Market Value Share (%) and BPS Analysis by Application, 2023 to 2033

Figure 92: Europe Market Y-o-Y Growth (%) Projections by Application, 2023 to 2033

Figure 93: Europe Market Attractiveness by Material, 2023 to 2033

Figure 94: Europe Market Attractiveness by Product, 2023 to 2033

Figure 95: Europe Market Attractiveness by Application, 2023 to 2033

Figure 96: Europe Market Attractiveness by Country, 2023 to 2033

Figure 97: Asia Pacific Market Value (US$ Million) by Material, 2023 to 2033

Figure 98: Asia Pacific Market Value (US$ Million) by Product, 2023 to 2033

Figure 99: Asia Pacific Market Value (US$ Million) by Application, 2023 to 2033

Figure 100: Asia Pacific Market Value (US$ Million) by Country, 2023 to 2033

Figure 101: Asia Pacific Market Value (US$ Million) Analysis by Country, 2018 to 2033

Figure 102: Asia Pacific Market Volume (Units) Analysis by Country, 2018 to 2033

Figure 103: Asia Pacific Market Value Share (%) and BPS Analysis by Country, 2023 to 2033

Figure 104: Asia Pacific Market Y-o-Y Growth (%) Projections by Country, 2023 to 2033

Figure 105: Asia Pacific Market Value (US$ Million) Analysis by Material, 2018 to 2033

Figure 106: Asia Pacific Market Volume (Units) Analysis by Material, 2018 to 2033

Figure 107: Asia Pacific Market Value Share (%) and BPS Analysis by Material, 2023 to 2033

Figure 108: Asia Pacific Market Y-o-Y Growth (%) Projections by Material, 2023 to 2033

Figure 109: Asia Pacific Market Value (US$ Million) Analysis by Product, 2018 to 2033

Figure 110: Asia Pacific Market Volume (Units) Analysis by Product, 2018 to 2033

Figure 111: Asia Pacific Market Value Share (%) and BPS Analysis by Product, 2023 to 2033

Figure 112: Asia Pacific Market Y-o-Y Growth (%) Projections by Product, 2023 to 2033

Figure 113: Asia Pacific Market Value (US$ Million) Analysis by Application, 2018 to 2033

Figure 114: Asia Pacific Market Volume (Units) Analysis by Application, 2018 to 2033

Figure 115: Asia Pacific Market Value Share (%) and BPS Analysis by Application, 2023 to 2033

Figure 116: Asia Pacific Market Y-o-Y Growth (%) Projections by Application, 2023 to 2033

Figure 117: Asia Pacific Market Attractiveness by Material, 2023 to 2033

Figure 118: Asia Pacific Market Attractiveness by Product, 2023 to 2033

Figure 119: Asia Pacific Market Attractiveness by Application, 2023 to 2033

Figure 120: Asia Pacific Market Attractiveness by Country, 2023 to 2033

Figure 121: MEA Market Value (US$ Million) by Material, 2023 to 2033

Figure 122: MEA Market Value (US$ Million) by Product, 2023 to 2033

Figure 123: MEA Market Value (US$ Million) by Application, 2023 to 2033

Figure 124: MEA Market Value (US$ Million) by Country, 2023 to 2033

Figure 125: MEA Market Value (US$ Million) Analysis by Country, 2018 to 2033

Figure 126: MEA Market Volume (Units) Analysis by Country, 2018 to 2033

Figure 127: MEA Market Value Share (%) and BPS Analysis by Country, 2023 to 2033

Figure 128: MEA Market Y-o-Y Growth (%) Projections by Country, 2023 to 2033

Figure 129: MEA Market Value (US$ Million) Analysis by Material, 2018 to 2033

Figure 130: MEA Market Volume (Units) Analysis by Material, 2018 to 2033

Figure 131: MEA Market Value Share (%) and BPS Analysis by Material, 2023 to 2033

Figure 132: MEA Market Y-o-Y Growth (%) Projections by Material, 2023 to 2033

Figure 133: MEA Market Value (US$ Million) Analysis by Product, 2018 to 2033

Figure 134: MEA Market Volume (Units) Analysis by Product, 2018 to 2033

Figure 135: MEA Market Value Share (%) and BPS Analysis by Product, 2023 to 2033

Figure 136: MEA Market Y-o-Y Growth (%) Projections by Product, 2023 to 2033

Figure 137: MEA Market Value (US$ Million) Analysis by Application, 2018 to 2033

Figure 138: MEA Market Volume (Units) Analysis by Application, 2018 to 2033

Figure 139: MEA Market Value Share (%) and BPS Analysis by Application, 2023 to 2033

Figure 140: MEA Market Y-o-Y Growth (%) Projections by Application, 2023 to 2033

Figure 141: MEA Market Attractiveness by Material, 2023 to 2033

Figure 142: MEA Market Attractiveness by Product, 2023 to 2033

Figure 143: MEA Market Attractiveness by Application, 2023 to 2033

Figure 144: MEA Market Attractiveness by Country, 2023 to 2033

Recommendations

Packaging

Bag Clips Market

Published : August 2023

Packaging

T-Top Closures Market

Published : January 2023

Explore Packaging Insights

View Reports