This site uses cookies, including third-party cookies, that help us to provide and improve our services.

Privacy Policy
- Global Locations -
Headquarters
Future Market Insights, Inc.
Christiana Corporate, 200 Continental Drive, Suite 401, Newark, Delaware - 19713, United States
T: +1-845-579-5705
MEA
Market Access DMCC

1602-6 Jumeirah Bay X2 Tower, Plot No: JLT-PH2-X2A,

Jumeirah Lakes Towers, Dubai,

United Arab Emirates

Americas
Future Market Insights
616 Corporate Way, Suite 2-9018,
Valley Cottage, NY 10989,
United States
T: +1-347-918-3531
Europe
Future Market Insights
3rd Floor, 207 Regent Street,
London W1B 3HH
United Kingdom
T: + 44 (0) 20 8123 9659
D: +44 (0) 20 3287 4268
APAC
Future Market Insights
Office No. 401-A, 4th Floor,
VANTAGE 9, S.No. 36/1/1,
Baner, Pune 411045 India

Bagasse Tableware Products Market

Bagasse Tableware Products: Innovative Green Packaging Solutions for a Greener Earth! FMI Analysis Opportunities Across 30+Countries including, Japan, Korea, USA, UK, Germany, Italy, and Others to Reveal the Level of Penetration of these Products

Bagasse Tableware Products Market by Product Type, Lamination, Application, Sales Channel, End Use, & Region | Forecast for 2023 to 2032

Bagasse Tableware Products Market Outlook (2023 to 2032)

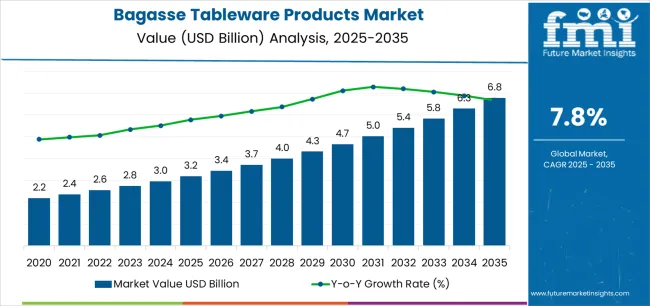
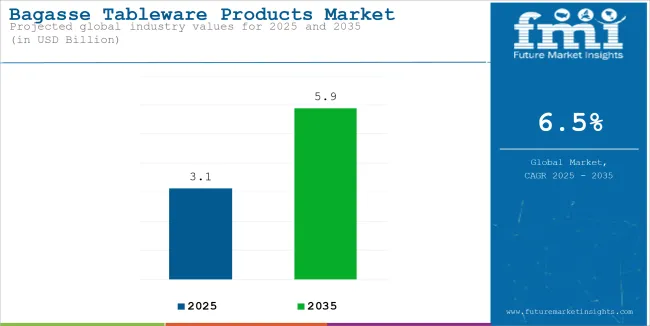
The global bagasse tableware products market size is expected to reach US$ 3.0 Billion in 2023 and further expand at a CAGR of 6.4% during the forecast period (2023 to 2032). Overall bagasse tableware product sales are poised to total a valuation of US$ 5.2 Billion by 2032. The growing popularity of bagasse cutlery and packaging solutions across residential, institutional, and commercial sectors due to their eco-friendly nature is a key factor driving bagasse tableware products’ demand globally.

Currently, the global market for bagasse tableware products forms around 5-7% of the worldwide tableware market standing at a valuation of US$ 45 Billion. Based on the sales channel, the manufacturers (direct sales) segment is anticipated to create a growth opportunity of US$ 1.1 Billion during the forecast period (2023 to 2032). The revenue of the bagasse tableware products market will increase at a healthy pace with the top 3 countries projected to hold 35-40% of the global market by the end of 2022.

A new forecast by FMI predicts that overall sales of bagasse tableware products will boost during the next ten years, creating an incremental growth opportunity of US$ 2.5 Billion by the end of 2032.

Bagasse tableware products are innovative tableware solutions made from sugarcane residue. These tableware products are strong, lightweight, and affordable. They have become ideal eco-friendly substitutes for Styrofoam and polystyrene tableware products.

Rising demand for sustainable and eco-friendly tableware along with the increasing consumer awareness of environmental concerns and government restrictions on the use of single-use plastic products are expected to boost the bagasse tableware products industry during the forecast period. The bagasse tableware products market is anticipated to grow 1.9x the current market value from 2023 to 2032.

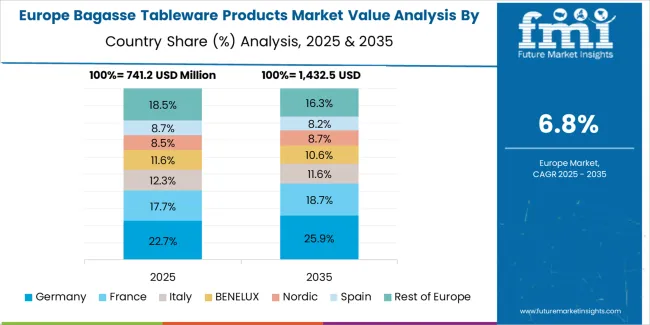
Regionally, South Asia and Europe are projected to collectively hold around 3/5th portion of the global bagasse tableware products industry during the forecast period owing to the ban imposed on the usage of single-use plastic products in European countries along with the high production of sugarcane in South Asian countries like India.

Attribute

Key Insights

Bagasse Tableware Products Market Estimated Value (2023)

US$ 3.0 Billion

Projected Market Value (2032)

US$ 5.2 Billion

Value-based CAGR (2023 to 2032)

6.4%

Collective Value Share: Top 3 Countries (2022)

30-35%

Don't pay for what you don't need

Customize your report by selecting specific countries or regions and save 30%!

2017 to 2021 Bagasse Tableware Products Market Historic Outlook in Comparison to 2022 to 2032 Forecast

The global market for bagasse tableware products grew at a CAGR of 3.4% during the historic period (2017 to 2022) and reached a total valuation of US$ 2.8 Billion at the end of 2022. However, with growing environmental concerns and increasing usage of eco-friendly packaging solutions globally, the overall bagasse tableware products demand is set to rise at a healthy CAGR of 6.4% between 2023 and 2032.

Bagasse tableware products are made from sugarcane pulp. They consist of a variety of products such as plates, bowls, containers, cups, clamshells, trays, straws, drink carriers, end caps, and cutlery with different shapes and sizes. These bagasse tableware products are versatile, and sturdy, and can handle a variety of hot, cold, wet, and oily foods.

They are naturally cut and grease resistant, microwavable, freezer safe, renewable, and can withstand the temperature of 200 degrees Fahrenheit. As a result, they are widely used in commercial establishments such as hotels, cafes, restaurants, catering, etc., households, and institutions like schools, colleges, and hospitals

The bagasse tableware products are gaining momentum for green-minded cafeterias, food service industries, and catering services due to the rising trend towards sustainable living practices.

Bagasse tableware products help to keep the food safe without losing the food quality, taste, and flavor. The market for bagasse tableware products is expanding due to a boom in quick-service restaurants owing to changing lifestyles and the rising trend of ready-to-eat, on-the-go meals, and online food ordering.

Consumers’ preference for safe, reliable, and hygienic product delivery has led food service providers to choose bagasse tableware products as a perfect packaging solution. They are using these compostable packaging solutions to woo more and more customers as well as to comply with strict government regulations.

What are the Trends Shaping the Bagasse Tableware Products Market?

Rising Demand for Sustainable Products Boosting Bagasse Tableware Products Market

Bagasse is the residue from sugarcane whose pulp has been extracted. The fiber is molded into sturdy, high-quality shapes by applying high temperatures and pressure. Bagasse is an eco-friendly sugarcane byproduct that is far superior to polystyrene. It is easily biodegradable and 100% compostable. As a result, it is being extensively used for making biodegradable packaging including food service packaging solutions.

Bagasse tableware products are made from renewable plant fibers and thus are considered a potential alternative to plastic packaging materials. The growing food service sector is choosing bagasse tableware products as a sustainable packaging solution. Bagasse tableware products are sustainable products because they can degrade easily and do not impact the environment.

Therefore, with the rise in demand for green packaging products for a sustainable environment, reusable and recyclable bagasse tableware products are becoming increasingly popular. This will boost the global bagasse tableware products industry during the assessment period.

Ismail Sutaria
Ismail Sutaria
Principal Consultant
LinkedIn
Talk to Analyst

Find your sweet spots for generating winning opportunities in this market.

Talk to Analyst

Country-wise insights

How Does Germany Bolster the Sales of Bagasse Tableware Products?

Ban on Single-Use Plastic to Boost Bagasse Tableware Product Sales in Germany

As per FMI, the German bagasse tableware products market is projected to grow 2.1x the current market value during the forecast period owing to the growing demand for eco-friendly and sustainable packaging solutions.

The ban on single-use plastic products to reduce plastic waste in 2021 by the European government in countries like Germany, Spain, the UK, and others have acted as a catalyst triggering the development of the bagasse tableware products industry.

According to Earth.Org, with the aim of reducing plastic waste and aligning with an EU directive, Germany banned sales of single-use plastic cutlery, food containers, straw, and other plastic products since July 2021.

Bagasse tableware products are compostable, biodegradable, and recyclable. As a result, end users like restaurants, hotels, and cafes are increasingly using them as a replacement for plastic packaging solutions. This will continue to fuel bagasse tableware product sales in Germany during the projection period.

Will India Become an Attractive Destination for Bagasse Tableware Product Manufacturers?

Easy Availability of Raw Materials at Lower Costs Making India a Profitable Market

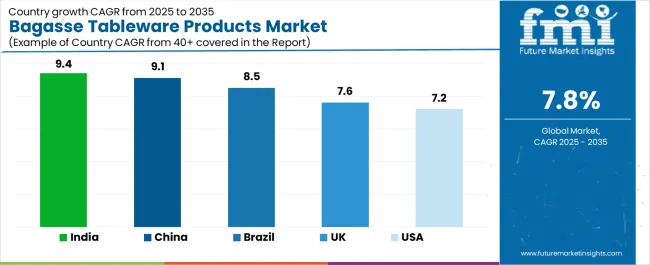
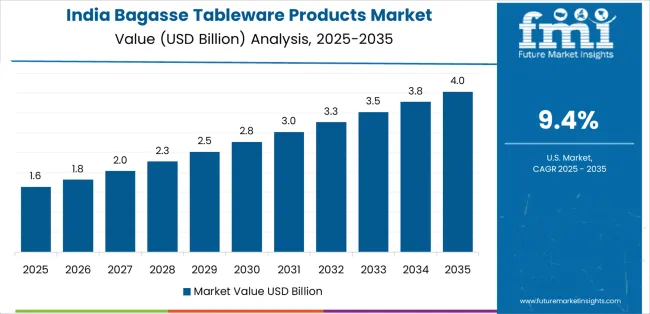
India’s bagasse tableware products industry is anticipated to register a healthy CAGR of 9.2% during the forecast period (2023 to 2032). The bagasse material is crushed sugarcane. The high availability of sugarcane due to its high production in India is the major factor facilitating the development of the bagasse tableware products industry.

As per the data provided by the All India Sugar Trade Association (AISTA), in India, the production of sugarcane reached approximately 350 MMT. Thus, the easy availability of sugarcane in India at much lower costs is making it an attractive destination for manufacturers of bagasse tableware products and the trend is likely to continue during the forecast period.

Similarly, the government’s crackdown on plastics and rising usage of bagasse packaging across the thriving HoReCa sector will elevate bagasse tableware products demand in India during the assessment period.

Category-wise Insights

Which is the Top Selling Product Type in the Market?

Bagasse Plates, Bowls, and Containers Remain the Most Sought-After Products Types

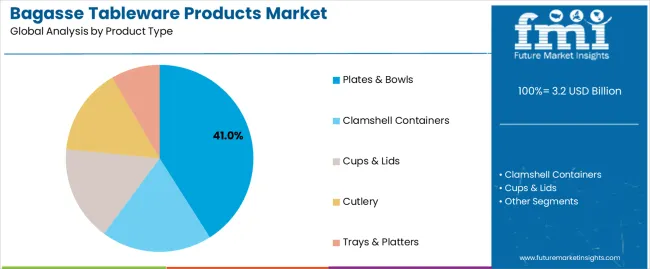
Based on the product type, the plates segment and the bowls & containers segment are expected to collectively hold around 63% value share of the global market for the bagasse tableware products market by the end of 2032.

The increased preference for eco-friendly products for household and commercial purposes is a key factor augmenting the sales of bagasse plates, bowls, and containers.

Due to growing environmental concerns, end users are rapidly shifting their preference toward biodegradable packaging solutions. They are replacing their plastic plates and containers with bagasse products. This will continue to generate high demand for bagasse plates, bowls, and containers during the next ten years.

Which is the Most Lucrative Application for Bagasse Tableware Products?

Food Sector to Create Maximum Opportunities for Bagasse Tableware Product Manufacturers

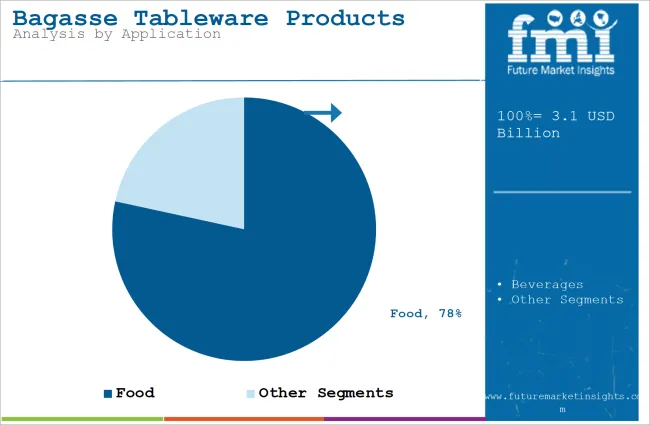
By application, the food segment is estimated to generate the highest demand for bagasse tableware products during the forecast period. FMI predicts the food segment to expand at a CAGR of 7.0% between 2023 and 2032. This is attributed to the increased usage of bagasse products by food providers.

The food service industry is constantly looking for using eco-friendly products and compostable packaging to reduce plastic pollution levels as well as to comply with stringent regulations. This has generated enormous growth opportunities for bagasse tableware product manufacturers and the trend is expected to continue during the forecast period.

Which is the Leading End-Use Industry for Bagasse Tableware Products?

Most of the Bagasse Tableware Products Demand arises from Commercial Sector

Based on end use, the global market for bagasse tableware products is segmented into commercial, institutional, and household. Among these, FMI predicts the commercial segment is to create a growth opportunity of US$ 1.8 Billion during the forecast period. This is attributed to expanding food service sector across the globe and growing preferences towards bagasse packaging.

Commercial establishments like hotels, restaurants, and cafes are increasingly adopting bagasse tableware products as an ideal alternative to plastic ones. This is helping them to cut down plastic usage, reduce pollution levels, and gain consumer confidence. Thus, the increasing number of these commercial establishments along with rising consumer shifts towards eco-friendly products will continue to fuel bagasse tableware product sales over the next ten years.

Get the data you need at a Fraction of the cost

Personalize your report by choosing insights you need
and save 40%!

Competitive Landscape

Key players operating in the market are focusing on expanding their presence by launching new products, partnerships, mergers, collaborations, facility expansions, and strengthening distribution channels to capture a large market share. Some of the development by the key players are as below-

  • Detpak (Detmold Group) announced a partnership with Eco-Products® in May 2021 which helped the company expand its footprint for sustainable packaging in Australia and New Zealand.
  • In April 2020, the Harvest® Fiber line of sustainable packaging was introduced by Genpak, LLC.

Scope of the Report

Attribute

Details

Estimated Market Size (2023)

US$ 3.0 Billion

Projected Market Size (2032)

US$ 5.2 Billion

Anticipated Growth Rate (2023 to 2032)

6.4% CAGR

Historical Data

2018 to 2022

Forecast Period

2023 to 2033

Quantitative Units

Revenue in US$ Billion, Volume in Tonnes, and CAGR from 2023 to 2033

Segments Covered

  • Product Type
  • Lamination
  • Application
  • End Use
  • Sales Channel
  • Region

Regions Covered

  • North America
  • Latin America
  • Europe
  • East Asia
  • South Asia
  • Middle East and Africa
  • Oceania

Key Countries Covered

  • USA
  • Canada
  • Mexico
  • Brazil
  • Germany
  • UK
  • France
  • Italy
  • Spain
  • Russia
  • China
  • Japan
  • India
  • GCC countries
  • Australia

Key Companies Profiled

  • Vegware Ltd.
  • GreenGood USA
  • Pactiv Evergreen Inc.
  • Dart Container Corporation
  • Genpak, LLC
  • Material Motion, Inc.
  • Natural Tableware
  • Karat (by Lollicup)
  • Pappco Greenware
  • Ecoriti
  • Duni Group AB
  • Bio Futura B.V.
  • Detpak (Detmold Group)
  • Greenvale Eco Products
  • Shenzhen Zhiben Technology Group Co., Ltd.
  • Greenweimo
  • DevEuro Paper Products LLP
  • Jinhua Zhongsheng Fiber Products Co., Ltd.
  • Shanghai Youngpac Biotech Ltd.
  • Hengda Industries Co., Ltd
  • Eco-Products, Inc.
  • Sorcit

Report Coverage

Revenue Forecast, Volume Forecast, Company Ranking, Competitive Landscape, Growth Factors, Trends, and Pricing Analysis

Bagasse Tableware Products Industry by Category

By Product Type:

  • Plates
    • Less than 8 inches
    • 8 inches to 12 inches
    • More than 12 inches
  • Bowls & Containers
    • Less than 12 Oz
    • 12 Oz to 16 Oz
    • More than 16 Oz
  • Cups
    • Less than 6 Oz
    • 6 Oz to 12 Oz
    • More than 12 Oz
  • Trays
    • Less than 8 inches
    • 8 inches to 12 inches
    • More than 12 inches
  • Clamshells
    • Less than 8 inches
    • 8 inches to 12 inches
    • More than 12 inches
  • End Caps
  • Drink Carriers
  • Straw
  • Cutlery (Spoons, Fork, Knife & Spork)

By Lamination:

  • Laminated
  • Non-Laminated

By Application:

  • Food
    • Fruits & Vegetables
    • Processed Food
    • Ready-to-eat meals
    • Bakery & Confectionery
    • Cereals
    • Dairy
    • Others Food Products
  • Beverages

By Sales Channel:

  • Manufacturers (Direct Sales)
  • Retail
    • Hypermarket
    • Supermarket
    • Convenience Stores
    • Specialty Stores
  • Distributors
  • Online

By End Use:

  • Commercial Use
    • Hotels & Cafes
    • Full-Service Restaurants
    • Quick Service Restaurants
    • Venues & Catering
    • Mobile Food Vendors
    • Bakery & Patisserie
  • Institutional Use
    • Schools & Colleges
    • Offices
    • Hospitals
    • Airports & Railways
  • Household Use

By Region:

  • North America
  • Latin America
  • Europe
  • South Asia
  • East Asia
  • Middle East & Africa
  • Oceania

Frequently Asked Questions

The global bagasse tableware products market size is expected to reach US$ 3.0 Billion in 2023.

During the forecast period (2023 to 2032), the global demand for bagasse tableware products is anticipated to increase at a CAGR of 6.4%.

The global bagasse tableware products industry is expected to reach a valuation of US$ 5.2 Billion by the end of 2032.

During the forecast period, the plates segment is likely to be the fastest-growing product type segment in the global market.

Stringent regulations imposed by governments on single-use plastic products and increasing adoption of sustainable packaging are some of the key factors propelling demand for bagasse tableware products.

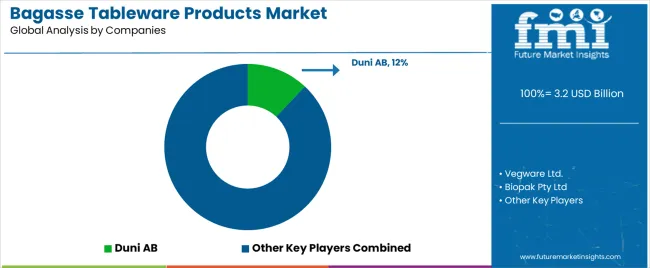
Key players operating in the market for bagasse tableware products are Pactiv Evergreen Inc., Dart Container Corporation, Duni AB, Genpak, LLC, Detpak (Detmold Group), Karat by Lollicup, and others.

The global market for bagasse tableware products is anticipated to showcase positive growth by expanding 1.9 times the current market value from 2023 to 2032.

From 2023 to 2032, the overall market for bagasse tableware products in India is projected to expand at a CAGR of 9.2%.

Table of Content

1. Executive Summary | Bagasse Tableware Products Market

    1.1. Global Market Outlook

    1.2. Market Analysis

    1.3. Analysis and Recommendations

2. Market Overview

    2.1. Market Coverage / Taxonomy

    2.2. Market Definition / Scope / Limitations

3. Key Market Trends

    3.1. Key Trends Impacting the Market

    3.2. Product Innovation / Development Trends

4. Key Success Factors

    4.1. Product Adoption / Usage Analysis

    4.2. Product USPs / Features

    4.3. Strategic Promotional Strategies

5. Global Market Demand Analysis 2017 to 2022 and Forecast, 2023 to 2032

    5.1. Historical Market Volume (Tonnes) Analysis, 2017 to 2022

    5.2. Current and Future Market Volume (Tonnes) Projections, 2023 to 2032

    5.3. Y-o-Y Growth Trend Analysis

6. Global Market - Pricing Analysis

    6.1. Regional Pricing Analysis By Region

    6.2. Global Average Pricing Analysis Benchmark

7. Market Demand (in Value or Size in US$ Million) Analysis 2017 to 2022 and Forecast, 2023 to 2032

    7.1. Historical Market Value (US$ Million) Analysis, 2017 to 2022

    7.2. Current and Future Market Value (US$ Million) Projections, 2023 to 2032

        7.2.1. Y-o-Y Growth Trend Analysis

        7.2.2. Absolute $ Opportunity Analysis

8. Market Background

    8.1. Global Packaging Market Overview

    8.2. Rigid Packaging Market Overview

    8.3. Macro-Economic Factors

    8.4. Forecast Factors - Relevance & Impact

    8.5. Value Chain

        8.5.1. Raw Material Suppliers

        8.5.2. Manufacturers

        8.5.3. End Users

    8.6. COVID-19 Crisis - Impact Assessment

        8.6.1. Current Statistics

        8.6.2. Short-Mid-Long Term Outlook

        8.6.3. Likely Rebound

    8.7. Market Dynamics

        8.7.1. Drivers

        8.7.2. Restraints

        8.7.3. Opportunity Analysis

    8.8. Global Supply Demand Analysis

9. Global Market Analysis 2017 to 2022 and Forecast 2023 to 2032, By Product Type 

    9.1. Introduction / Key Findings

    9.2. Historical Market Size (US$ Million) and Volume (Tonnes) Analysis By Product Type, 2017 to 2022

    9.3. Current and Future Market Size (US$ Million) and Volume (Tonnes) Analysis and Forecast By Product Type, 2023 to 2032

        9.3.1. Plates

            9.3.1.1. Less than 8 inches

            9.3.1.2. 8 inches to 12 inches

            9.3.1.3. More than 12 inches

        9.3.2. Bowls & Containers

            9.3.2.1. Less than 12 Oz

            9.3.2.2. 12 Oz to 16 Oz

            9.3.2.3. More than 16 Oz

        9.3.3. Cups

            9.3.3.1. Less than 6 Oz

            9.3.3.2. 6 Oz to 12 Oz

            9.3.3.3. More than 12 Oz

        9.3.4. Trays

            9.3.4.1. Less than 8 inches

            9.3.4.2. 8 inches to 12 inches

            9.3.4.3. More than 12 inches

        9.3.5. Clamshells

            9.3.5.1. Less than 8 inches

            9.3.5.2. 8 inches to 12 inches

            9.3.5.3. More than 12 inches

        9.3.6. End Caps

        9.3.7. Drink Carriers

        9.3.8. Straw

        9.3.9. Cutlery (Spoons, Fork, Knife & Spork)

    9.4. Market Attractiveness Analysis By Product Type

10. Global Market Analysis 2017 to 2022 and Forecast 2023 to 2032, By Lamination

    10.1. Introduction / Key Findings

    10.2. Historical Market Size (US$ Million) and Volume (Tonnes) Analysis By Lamination, 2017 to 2022

    10.3. Current and Future Market Size (US$ Million) and Volume (Tonnes) Analysis and Forecast By Lamination, 2023 to 2032

        10.3.1. Laminated

        10.3.2. Non-Laminated

    10.4. Market Attractiveness Analysis By Lamination

11. Global Market Analysis 2017 to 2022 and Forecast 2023 to 2032, By Application 

    11.1. Introduction / Key Findings

    11.2. Historical Market Size (US$ Million) and Volume (Tonnes) Analysis By Application, 2017 to 2022

    11.3. Current and Future Market Size (US$ Million) and Volume (Tonnes) Analysis and Forecast By Application, 2023 to 2032

        11.3.1. Food

            11.3.1.1. Fruits & Vegetables

            11.3.1.2. Processed Food

            11.3.1.3. Ready-to-eat meals

            11.3.1.4. Bakery & Confectionery

            11.3.1.5. Cereals

            11.3.1.6. Dairy

            11.3.1.7. Other Food Products

        11.3.2. Beverages

    11.4. Market Attractiveness Analysis By Application

12. Global Market Analysis 2017 to 2022 and Forecast 2023 to 2032, By Sales Channel 

    12.1. Introduction / Key Findings

    12.2. Historical Market Size (US$ Million) and Volume (Tonnes) Analysis By Sales Channel, 2017 to 2022

    12.3. Current and Future Market Size (US$ Million) and Volume (Tonnes) Analysis and Forecast By Sales Channel, 2023 to 2032

        12.3.1. Manufacturers (Direct Sales)

        12.3.2. Retail

            12.3.2.1. Hypermarket

            12.3.2.2. Supermarket

            12.3.2.3. Convenience Stores

            12.3.2.4. Specialty Stores

        12.3.3. Distributors

        12.3.4. Online

    12.4. Market Attractiveness Analysis By Sales Channel

13. Global Market Analysis 2017 to 2022 and Forecast 2023 to 2032, By End Use 

    13.1. Introduction / Key Findings

    13.2. Historical Market Size (US$ Million) and Volume (Tonnes) Analysis By Product Type, 2017 to 2022

    13.3. Current and Future Market Size (US$ Million) and Volume (Tonnes) Analysis and Forecast By Product Type, 2023 to 2032

        13.3.1. Commercial Use

            13.3.1.1. Hotels & Cafes

            13.3.1.2. Full-Service Restaurants

            13.3.1.3. Quick Service Restaurants

            13.3.1.4. Venues & Catering

            13.3.1.5. Mobile Food Vendors

            13.3.1.6. Bakery & Patisserie

        13.3.2. Institutional Use

            13.3.2.1. Schools & Colleges

            13.3.2.2. Offices

            13.3.2.3. Hospitals

            13.3.2.4. Airports & Railways

        13.3.3. Household Use

    13.4. Market Attractiveness Analysis By Product Type

14. Global Market Analysis 2017 to 2022 and Forecast 2023 to 2032, By Region

    14.1. Introduction / Key Findings

    14.2. Historical Market Size (US$ Million) and Volume (Tonnes) Analysis By Region, 2017 to 2022

    14.3. Current and Future Market Size (US$ Million) and Volume (Tonnes) Analysis and Forecast By Region, 2023 to 2032

        14.3.1. North America

        14.3.2. Latin America

        14.3.3. Europe

        14.3.4. East Asia

        14.3.5. South Asia

        14.3.6. Middle East and Africa (MEA)

        14.3.7. Oceania

    14.4. Market Attractiveness Analysis By Region

15. North America Market Analysis 2017 to 2022 and Forecast 2023 to 2032

    15.1. Introduction / Key Findings

    15.2. Historical Market Size (US$ Million) and Volume (Tonnes) Analysis by Market Taxonomy, 2017 to 2022

    15.3. Current Market Size (US$ Million) and Volume (Tonnes) Analysis and Forecast by Market Taxonomy, 2023 to 2032

        15.3.1. By Country

            15.3.1.1.United States of America

            15.3.1.2. Canada

        15.3.2. By Product Type

        15.3.3. By Lamination

        15.3.4. By Application

        15.3.5. By End Use

        15.3.6. By Sales Channel

    15.4. Market Attractiveness Analysis

        15.4.1. By Country

        15.4.2. By Product Type

        15.4.3. By Lamination

        15.4.4. By Application

        15.4.5. By End Use

        15.4.6. By Sales Channel

16. Latin America Market Analysis 2017 to 2022 and Forecast 2023 to 2032

    16.1. Introduction / Key Findings

    16.2. Historical Market Size (US$ Million) and Volume (Tonnes) Analysis by Market Taxonomy, 2017 to 2022

    16.3. Current Market Size (US$ Million) and Volume (Tonnes) Analysis and Forecast by Market Taxonomy, 2023 to 2032

        16.3.1. By Country

            16.3.1.1. Brazil

            16.3.1.2. Mexico

            16.3.1.3. Argentina

            16.3.1.4. Rest of Latin America

        16.3.2. By Product Type

        16.3.3. By Lamination

        16.3.4. By Application

        16.3.5. By End Use

        16.3.6. By Sales Channel

    16.4. Market Attractiveness Analysis

        16.4.1. By Country

        16.4.2. By Product Type

        16.4.3. By Lamination

        16.4.4. By Application

        16.4.5. By End Use

        16.4.6. By Sales Channel

17. Europe Market Analysis 2017 to 2022 and Forecast 2023 to 2032

    17.1. Introduction / Key Findings

    17.2. Historical Market Size (US$ Million) and Volume (Tonnes) Analysis by Market Taxonomy, 2017 to 2022

    17.3. Current Market Size (US$ Million) and Volume (Tonnes) Analysis and Forecast by Market Taxonomy, 2023 to 2032

        17.3.1. By Country

            17.3.1.1. Germany

            17.3.1.2. Italy

            17.3.1.3. France

            17.3.1.4. United Kingdom

            17.3.1.5. Spain

            17.3.1.6. BENELUX

            17.3.1.7. Nordics

            17.3.1.8. Russia

            17.3.1.9. Poland

            17.3.1.10. Rest of Europe

        17.3.2. By Product Type

        17.3.3. By Lamination

        17.3.4. By Application

        17.3.5. By End Use

        17.3.6. By Sales Channel

    17.4. Market Attractiveness Analysis

        17.4.1. By Country

        17.4.2. By Product Type

        17.4.3. By Lamination

        17.4.4. By Application

        17.4.5. By End Use

        17.4.6. By Sales Channel

18. East Asia Market Analysis 2017 to 2022 and Forecast 2023 to 2032

    18.1. Introduction / Key Findings

    18.2. Historical Market Size (US$ Million) and Volume (Tonnes) Analysis by Market Taxonomy, 2017 to 2022

    18.3. Current Market Size (US$ Million) and Volume (Tonnes) Analysis and Forecast by Market Taxonomy, 2023 to 2032

        18.3.1. By Country

            18.3.1.1. China

            18.3.1.2. Japan

            18.3.1.3. South Korea

        18.3.2. By Product Type

        18.3.3. By Lamination

        18.3.4. By Application

        18.3.5. By End Use

        18.3.6. By Sales Channel

    18.4. Market Attractiveness Analysis

        18.4.1. By Country

        18.4.2. By Product Type

        18.4.3. By Lamination

        18.4.4. By Application

        18.4.5. By End Use

        18.4.6. By Sales Channel

19. South Asia Market Analysis 2017 to 2022 and Forecast 2023 to 2032

    19.1. Introduction / Key Findings

    19.2. Historical Market Size (US$ Million) and Volume (Tonnes) Analysis by Market Taxonomy, 2017 to 2022

    19.3. Current Market Size (US$ Million) and Volume (Tonnes) Analysis and Forecast by Market Taxonomy, 2023 to 2032

        19.3.1. By Country

            19.3.1.1. India

            19.3.1.2. Thailand

            19.3.1.3. Indonesia

            19.3.1.4. Malaysia

            19.3.1.5. Rest of South Asia

        19.3.2. By Product Type

        19.3.3. By Lamination

        19.3.4. By Application

        19.3.5. By End Use

        19.3.6. By Sales Channel

    19.4. Market Attractiveness Analysis

        19.4.1. By Country

        19.4.2. By Product Type

        19.4.3. By Lamination

        19.4.4. By Application

        19.4.5. By End Use

        19.4.6. By Sales Channel

20. Middle East & Africa Market Analysis 2017 to 2022 and Forecast 2023 to 2032

    20.1. Introduction / Key Findings

    20.2. Historical Market Size (US$ Million) and Volume (Tonnes) Analysis by Market Taxonomy, 2017 to 2022

    20.3. Current Market Size (US$ Million) and Volume (Tonnes) Analysis and Forecast by Market Taxonomy, 2023 to 2032

        20.3.1. By Country

            20.3.1.1. GCC Countries

            20.3.1.2. Turkey

            20.3.1.3. Northern Africa

            20.3.1.4. South Africa

            20.3.1.5. Rest of Middle East and Africa

        20.3.2. By Country

        20.3.3. By Product Type

        20.3.4. By Lamination

        20.3.5. By Application

        20.3.6. By End Use

        20.3.7. By Sales Channel

    20.4. Market Attractiveness Analysis

        20.4.1. By Country

        20.4.2. By Product Type

        20.4.3. By Lamination

        20.4.4. By Application

        20.4.5. By End Use

        20.4.6. By Sales Channel

21. Oceania Market Analysis 2017 to 2022 and Forecast 2023 to 2032

    21.1. Introduction / Key Findings

    21.2. Historical Market Size (US$ Million) and Volume (Tonnes) Analysis by Market Taxonomy, 2017 to 2022

    21.3. Current Market Size (US$ Million) and Volume (Tonnes) Analysis and Forecast by Market Taxonomy, 2023 to 2032

        21.3.1. By Country

            21.3.1.1. Australia

            21.3.1.2. New Zealand

        21.3.2. By Product Type

        21.3.3. By Lamination

        21.3.4. By Application

        21.3.5. By End Use

        21.3.6. By Sales Channel

    21.4. Market Attractiveness Analysis

        21.4.1. By Country

        21.4.2. By Product Type

        21.4.3. By Lamination

        21.4.4. By Application

        21.4.5. By End Use

        21.4.6. By Sales Channel

22. Country-wise Market Analysis 2022 & 2032

    22.1. USA  Analysis

        22.1.1. By Product Type

        22.1.2. By Lamination

        22.1.3. By Application

        22.1.4. By End Use

        22.1.5. By Sales Channel

    22.2. Canada Market Analysis

        22.2.1. By Product Type

        22.2.2. By Lamination

        22.2.3. By Application

        22.2.4. By End Use

        22.2.5. By Sales Channel

    22.3. Brazil  Market Analysis

        22.3.1. By Product Type

        22.3.2. By Lamination

        22.3.3. By Application

        22.3.4. By End Use

        22.3.5. By Sales Channel

    22.4. Mexico  Analysis

        22.4.1. By Product Type

        22.4.2. By Lamination

        22.4.3. By Application

        22.4.4. By End Use

        22.4.5. By Sales Channel

    22.5. Germany Analysis

        22.5.1. By Product Type

        22.5.2. By Lamination

        22.5.3. By Application

        22.5.4. By End Use

        22.5.5. By Sales Channel

    22.6. UK Analysis

        22.6.1. By Product Type

        22.6.2. By Lamination

        22.6.3. By Application

        22.6.4. By End Use

        22.6.5. By Sales Channel

    22.7. Spain Analysis

        22.7.1. By Product Type

        22.7.2. By Lamination

        22.7.3. By Application

        22.7.4. By End Use

        22.7.5. By Sales Channel

    22.8. France Analysis

        22.8.1. By Product Type

        22.8.2. By Lamination

        22.8.3. By Application

        22.8.4. By End Use

        22.8.5. By Sales Channel

    22.9. Russia Analysis

        22.9.1. By Product Type

        22.9.2. By Lamination

        22.9.3. By Application

        22.9.4. By End Use

        22.9.5. By Sales Channel

    22.10. China Analysis

        22.10.1. By Product Type

        22.10.2. By Lamination

        22.10.3. By Application

        22.10.4. By End Use

        22.10.5. By Sales Channel

    22.11. Japan Analysis

        22.11.1. By Product Type

        22.11.2. By Lamination

        22.11.3. By Application

        22.11.4. By End Use

        22.11.5. By Sales Channel

    22.12. India Analysis

        22.12.1. By Product Type

        22.12.2. By Lamination

        22.12.3. By Application

        22.12.4. By End Use

        22.12.5. By Sales Channel

    22.13. GCC Countries Analysis

        22.13.1. By Product Type

        22.13.2. By Lamination

        22.13.3. By Application

        22.13.4. By End Use

        22.13.5. By Sales Channel

    22.14. Australia Analysis

        22.14.1. By Product Type

        22.14.2. By Lamination

        22.14.3. By Application

        22.14.4. By End Use

        22.14.5. By Sales Channel

23. Market Structure Analysis

    23.1. Market Analysis by Tier of Companies

    23.2. Market Share Analysis of Top Players

    23.3. Market Presence Analysis

24. Competition Analysis

    24.1. Competition Dashboard

    24.2. Competition Benchmarking

    24.3. Competition Deep Dive

        24.3.1. Vegware Ltd

            24.3.1.1. Overview

            24.3.1.2. Product Portfolio

            24.3.1.3. Profitability by Market Segments (Product Type/Lamination/Application/End Use/Sales Channel/Region)

            24.3.1.4. Sales Footprint

            24.3.1.5. Strategy Overview

        24.3.2. GreenGood USA

            24.3.2.1. Overview

            24.3.2.2. Product Portfolio

            24.3.2.3. Profitability by Market Segments (Product Type/Lamination/Application/End Use/Sales Channel/Region)

            24.3.2.4. Sales Footprint

            24.3.2.5. Strategy Overview

        24.3.3. Pactiv Evergreen Inc.

            24.3.3.1. Overview

            24.3.3.2. Product Portfolio

            24.3.3.3. Profitability by Market Segments (Product Type/Lamination/Application/End Use/Sales Channel/Region)

            24.3.3.4. Sales Footprint

            24.3.3.5. Strategy Overview

        24.3.4. Dart Container Corporation

            24.3.4.1. Overview

            24.3.4.2. Product Portfolio

            24.3.4.3. Profitability by Market Segments (Product Type/Lamination/Application/End Use/Sales Channel/Region)

            24.3.4.4. Sales Footprint

            24.3.4.5. Strategy Overview

        24.3.5. Genpak, LLC

            24.3.5.1. Overview

            24.3.5.2. Product Portfolio

            24.3.5.3. Profitability by Market Segments (Product Type/Lamination/Application/End Use/Sales Channel/Region)

            24.3.5.4. Sales Footprint

            24.3.5.5. Strategy Overview

        24.3.6. Material Motion, Inc.

            24.3.6.1. Overview

            24.3.6.2. Product Portfolio

            24.3.6.3. Profitability by Market Segments (Product Type/Lamination/Application/End Use/Sales Channel/Region)

            24.3.6.4. Sales Footprint

            24.3.6.5. Strategy Overview

        24.3.7. Natural Tableware

            24.3.7.1. Overview

            24.3.7.2. Product Portfolio

            24.3.7.3. Profitability by Market Segments (Product Type/Lamination/Application/End Use/Sales Channel/Region)

            24.3.7.4. Sales Footprint

            24.3.7.5. Strategy Overview

        24.3.8. Eco-Products, Inc.

            24.3.8.1. Overview

            24.3.8.2. Product Portfolio

            24.3.8.3. Profitability by Market Segments (Product Type/Lamination/Application/End Use/Sales Channel/Region)

            24.3.8.4. Sales Footprint

            24.3.8.5. Strategy Overview

        24.3.9. Karat (by Lollicup)

            24.3.9.1. Overview

            24.3.9.2. Product Portfolio

            24.3.9.3. Profitability by Market Segments (Product Type/Lamination/Application/End Use/Sales Channel/Region)

            24.3.9.4. Sales Footprint

            24.3.9.5. Strategy Overview

        24.3.10. Pappco Greenware

            24.3.10.1. Overview

            24.3.10.2. Product Portfolio

            24.3.10.3. Profitability by Market Segments (Product Type/Lamination/Application/End Use/Sales Channel/Region)

            24.3.10.4. Sales Footprint

            24.3.10.5. Strategy Overview

        24.3.11. Ecoriti

            24.3.11.1. Overview

            24.3.11.2. Product Portfolio

            24.3.11.3. Profitability by Market Segments (Product Type/Lamination/Application/End Use/Sales Channel/Region)

            24.3.11.4. Sales Footprint

            24.3.11.5. Strategy Overview

        24.3.12. Duni Group AB

            24.3.12.1. Overview

            24.3.12.2. Product Portfolio

            24.3.12.3. Profitability by Market Segments (Product Type/Lamination/Application/End Use/Sales Channel/Region)

            24.3.12.4. Sales Footprint

            24.3.12.5. Strategy Overview

        24.3.13. Bio Futura B.V.

            24.3.13.1. Overview

            24.3.13.2. Product Portfolio

            24.3.13.3. Profitability by Market Segments (Product Type/Lamination/Application/End Use/Sales Channel/Region)

            24.3.13.4. Sales Footprint

            24.3.13.5. Strategy Overview

        24.3.14. Detpak (Detmold Group)

            24.3.14.1. Overview

            24.3.14.2. Product Portfolio

            24.3.14.3. Profitability by Market Segments (Product Type/Lamination/Application/End Use/Sales Channel/Region)

            24.3.14.4. Sales Footprint

            24.3.14.5. Strategy Overview

        24.3.15. Greenvale Eco Products

            24.3.15.1. Overview

            24.3.15.2. Product Portfolio

            24.3.15.3. Profitability by Market Segments (Product Type/Lamination/Application/End Use/Sales Channel/Region)

            24.3.15.4. Sales Footprint

            24.3.15.5. Strategy Overview

        24.3.16. Shenzhen Zhiben Technology Group Co., Ltd.

            24.3.16.1. Overview

            24.3.16.2. Product Portfolio

            24.3.16.3. Profitability by Market Segments (Product Type/Lamination/Application/End Use/Sales Channel/Region)

            24.3.16.4. Sales Footprint

            24.3.16.5. Strategy Overview

        24.3.17. Greenweimo

            24.3.17.1. Overview

            24.3.17.2. Product Portfolio

            24.3.17.3. Profitability by Market Segments (Product Type/Lamination/Application/End Use/Sales Channel/Region)

            24.3.17.4. Sales Footprint

            24.3.17.5. Strategy Overview

        24.3.18. DevEuro Paper Products LLP

            24.3.18.1. Overview

            24.3.18.2. Product Portfolio

            24.3.18.3. Profitability by Market Segments (Product Type/Lamination/Application/End Use/Sales Channel/Region)

            24.3.18.4. Sales Footprint

            24.3.18.5. Strategy Overview

        24.3.19. Jinhua Zhongsheng Fiber Products Co., Ltd.

            24.3.19.1. Overview

            24.3.19.2. Product Portfolio

            24.3.19.3. Profitability by Market Segments (Product Type/Lamination/Application/End Use/Sales Channel/Region)

            24.3.19.4. Sales Footprint

            24.3.19.5. Strategy Overview

        24.3.20. Shanghai Youngpac Biotech Ltd.

            24.3.20.1. Overview

            24.3.20.2. Product Portfolio

            24.3.20.3. Profitability by Market Segments (Product Type/Lamination/Application/End Use/Sales Channel/Region)

            24.3.20.4. Sales Footprint

            24.3.20.5. Strategy Overview

        24.3.21. Hengda Industries Co., Ltd

            24.3.21.1. Overview

            24.3.21.2. Product Portfolio

            24.3.21.3. Profitability by Market Segments (Product Type/Lamination/Application/End Use/Sales Channel/Region)

            24.3.21.4. Sales Footprint

            24.3.21.5. Strategy Overview

        24.3.22. Sorcit

            24.3.22.1. Overview

            24.3.22.2. Product Portfolio

            24.3.22.3. Profitability by Market Segments (Product Type/Lamination/Application/End Use/Sales Channel/Region)

            24.3.22.4. Sales Footprint

            24.3.22.5. Strategy Overview

25. Assumptions and Acronyms Used

26. Research Methodology

Don't pay for what you don't need

Customize your report by selecting specific countries or regions and save 30%!

List of Tables

Table 01: Global Market Volume (Tonnes), by Product Type, 2017H to 2032F

Table 02: Global Market Value (US$ Million), by Product Type, 2017H to 2032F

Table 03: Global Market Volume (Tonnes), by Lamination, 2017H to 2032F

Table 04: Global Market Volume (US$ Million), by Lamination, 2017H to 2032F

Table 05: Global Market Volume (Tonnes), by Application, 2017H to 2032F

Table 06: Global Market Value (US$ Million), by Application, 2017H to 2032F

Table 07: Global Market Volume (Tonnes), by Sales Channel, 2017H to 2032F

Table 08: Global Market Value (US$ Million), by Sales Channel, 2017H to 2032F

Table 09: Global Market Volume (Tonnes), by End Use, 2017H to 2032F

Table 10: Global Market Value (US$ Million), by End Use, 2017H to 2032F

Table 11: Global Market Volume (Tonnes), by Region, 2017H to 2032F

Table 12: Global Market Value (US$ Million), by Region, 2017H to 2032F

Table 13: North America Market Volume (Tonnes), by Product Type, 2017H to 2032F

Table 14: North America Market Value (US$ Million), by Product Type, 2017H to 2032F

Table 15: North America Market Volume (Tonnes), by Lamination, 2017H to 2032F

Table 16: North America Market Volume (US$ Million), by Lamination, 2017H to 2032F

Table 17: North America Market Volume (Tonnes), by Application, 2017H to 2032F

Table 18: North America Market Value (US$ Million), by Application, 2017H to 2032F

Table 19: North America Market Volume (Tonnes), by Sales Channel, 2017H to 2032F

Table 20: North America Market Value (US$ Million), by Sales Channel, 2017H to 2032F

Table 21: North America Market Volume (Tonnes), by End Use, 2017H to 2032F

Table 22: North America Market Value (US$ Million), by End Use, 2017H to 2032F

Table 23: North America Market Volume (Tonnes), by Country, 2017H to 2032F

Table 24: North America Market Value (US$ Million), by Country, 2017H to 2032F

Table 25: Latin America Market Volume (Tonnes), by Product Type, 2017H to 2032F

Table 26: Latin America Market Value (US$ Million), by Product Type, 2017H to 2032F

Table 27: Latin America Market Volume (Tonnes), by Lamination, 2017H to 2032F

Table 28: Latin America Market Volume (US$ Million), by Lamination, 2017H to 2032F

Table 29: Latin America Market Volume (Tonnes), by Application, 2017H to 2032F

Table 30: Latin America Market Value (US$ Million), by Application, 2017H to 2032F

Table 31: Latin America Market Volume (Tonnes), by Sales Channel, 2017H to 2032F

Table 32: Latin America Market Value (US$ Million), by Sales Channel, 2017H to 2032F

Table 33: Latin America Market Volume (Tonnes), by End Use, 2017H to 2032F

Table 34: Latin America Market Value (US$ Million), by End Use, 2017H to 2032F

Table 35: Latin America Market Volume (Tonnes), by Country, 2017H to 2032F

Table 36: Latin America Market Value (US$ Million), by Country, 2017H to 2032F

Table 37: Europe Market Volume (Tonnes), by Product Type, 2017H to 2032F

Table 38: Europe Market Value (US$ Million), by Product Type, 2017H to 2032F

Table 39: Europe Market Volume (Tonnes), by Lamination, 2017H to 2032F

Table 40: Europe Market Volume (US$ Million), by Lamination, 2017H to 2032F

Table 41: Europe Market Volume (Tonnes), by Application, 2017H to 2032F

Table 42: Europe Market Value (US$ Million), by Application, 2017H to 2032F

Table 43: Europe Market Volume (Tonnes), by Sales Channel, 2017H to 2032F

Table 44: Europe Market Value (US$ Million), by Sales Channel, 2017H to 2032F

Table 45: Europe Market Volume (Tonnes), by End Use, 2017H to 2032F

Table 46: Europe Market Value (US$ Million), by End Use, 2017H to 2032F

Table 47: Europe Market Volume (Tonnes), by Country, 2017H to 2032F

Table 48: Europe Market Value (US$ Million), by Country, 2017H to 2032F

Table 49: East Asia Market Volume (Tonnes), by Product Type, 2017H to 2032F

Table 50: East Asia Market Value (US$ Million), by Product Type, 2017H to 2032F

Table 51: East Asia Market Volume (Tonnes), by Lamination, 2017H to 2032F

Table 52: East Asia Market Volume (US$ Million), by Lamination, 2017H to 2032F

Table 53: East Asia Market Volume (Tonnes), by Application, 2017H to 2032F

Table 54: East Asia Market Value (US$ Million), by Application, 2017H to 2032F

Table 55: East Asia Market Volume (Tonnes), by Sales Channel, 2017H to 2032F

Table 56: East Asia Market Value (US$ Million), by Sales Channel, 2017H to 2032F

Table 57: East Asia Market Volume (Tonnes), by End Use, 2017H to 2032F

Table 58: East Asia Market Value (US$ Million), by End Use, 2017H to 2032F

Table 59: East Asia Market Volume (Tonnes), by Country, 2017H to 2032F

Table 60: East Asia Market Value (US$ Million), by Country, 2017H to 2032F

Table 61: South Asia Market Volume (Tonnes), by Product Type, 2017H to 2032F

Table 62: South Asia Market Value (US$ Million), by Product Type, 2017H to 2032F

Table 63: South Asia Market Volume (Tonnes), by Lamination, 2017H to 2032F

Table 64: South Asia Market Volume (US$ Million), by Lamination, 2017H to 2032F

Table 65: South Asia Market Volume (Tonnes), by Application, 2017H to 2032F

Table 66: South Asia Market Value (US$ Million), by Application, 2017H to 2032F

Table 67: South Asia Market Volume (Tonnes), by Sales Channel, 2017H to 2032F

Table 68: South Asia Market Value (US$ Million), by Sales Channel, 2017H to 2032F

Table 69: South Asia Market Volume (Tonnes), by End Use, 2017H to 2032F

Table 70: South Asia Market Value (US$ Million), by End Use, 2017H to 2032F

Table 71: South Asia Market Volume (Tonnes), by Country, 2017H to 2032F

Table 72: South Asia Market Value (US$ Million), by Country, 2017H to 2032F

Table 73: MEA Market Volume (Tonnes), by Product Type, 2017H to 2032F

Table 74: MEA Market Value (US$ Million), by Product Type, 2017H to 2032F

Table 75: MEA Market Volume (Tonnes), by Lamination, 2017H to 2032F

Table 76: MEA Market Volume (US$ Million), by Lamination, 2017H to 2032F

Table 77: MEA Market Volume (Tonnes), by Application, 2017H to 2032F

Table 78: MEA Market Value (US$ Million), by Application, 2017H to 2032F

Table 79: MEA Market Volume (Tonnes), by Sales Channel, 2017H to 2032F

Table 80: MEA Market Value (US$ Million), by Sales Channel, 2017H to 2032F

Table 81: MEA Market Volume (Tonnes), by End Use, 2017H to 2032F

Table 82: MEA Market Value (US$ Million), by End Use, 2017H to 2032F

Table 83: MEA Market Volume (Tonnes), by Country, 2017H to 2032F

Table 84: MEA Market Value (US$ Million), by Country, 2017H to 2032F

Table 85: Oceania Market Volume (Tonnes), by Product Type, 2017H to 2032F

Table 86: Oceania Market Value (US$ Million), by Product Type, 2017H to 2032F

Table 87: Oceania Market Volume (Tonnes), by Lamination, 2017H to 2032F

Table 88: Oceania Market Volume (US$ Million), by Lamination, 2017H to 2032F

Table 89: Oceania Market Volume (Tonnes), by Application, 2017H to 2032F

Table 90: Oceania Market Value (US$ Million), by Application, 2017H to 2032F

Table 91: Oceania Market Volume (Tonnes), by Sales Channel, 2017H to 2032F

Table 92: Oceania Market Value (US$ Million), by Sales Channel, 2017H to 2032F

Table 93: Oceania Market Volume (Tonnes), by End Use, 2017H to 2032F

Table 94: Oceania Market Value (US$ Million), by End Use, 2017H to 2032F

Table 95: Oceania Market Volume (Tonnes), by Country, 2017H to 2032F

Table 96: Oceania Market Value (US$ Million), by Country, 2017H to 2032F

Table 97: USA Market Value (US$ Million) Forecast by Product Type, Lamination, Application, Sales Channel, and End Use (2023(E) to 2033(F))

Table 98: Canada Market Value (US$ Million) Forecast by Product Type, Lamination, Application, Sales Channel, and End Use (2023(E) to 2033(F))

Table 99: Brazil Market Value (US$ Million) Forecast by Product Type, Lamination, Application, Sales Channel, and End Use (2023(E) to 2033(F))

Table 100: Mexico Market Value (US$ Million) Forecast by Product Type, Lamination, Application, Sales Channel, and End Use (2023(E) to 2033(F))

Table 101: Germany Market Value (US$ Million) Forecast by Product Type, Lamination, Application, Sales Channel, and End Use (2023(E) to 2033(F))

Table 102: UK Market Value (US$ Million) Forecast by Product Type, Lamination, Application, Sales Channel, and End Use (2023(E) to 2033(F))

Table 103: Spain Market Value (US$ Million) Forecast by Product Type, Lamination, Application, Sales Channel, and End Use (2023(E) to 2033(F))

Table 104: France Market Value (US$ Million) Forecast by Product Type, Lamination, Application, Sales Channel, and End Use (2023(E) to 2033(F))

Table 105: Russia Market Value (US$ Million) Forecast by Product Type, Lamination, Application, Sales Channel, and End Use (2023(E) to 2033(F))

Table 106: China Market Value (US$ Million) Forecast by Product Type, Lamination, Application, Sales Channel, and End Use (2023(E) to 2033(F))

Table 107: Japan Market Value (US$ Million) Forecast by Product Type, Lamination, Application, Sales Channel, and End Use (2023(E) to 2033(F))

Table 108: India Market Value (US$ Million) Forecast by Product Type, Lamination, Application, Sales Channel, and End Use (2023(E) to 2033(F))

Table 109: GCC Countries Market Value (US$ Million) Forecast by Product Type, Lamination, Application, Sales Channel, and End Use (2023(E) to 2033(F))

Table 110: Australia Market Value (US$ Million) Forecast by Product Type, Lamination, Application, Sales Channel, and End Use (2023(E) to 2033(F))
Ismail Sutaria
Ismail Sutaria
Principal Consultant
LinkedIn
Talk to Analyst

Find your sweet spots for generating winning opportunities in this market.

Talk to Analyst

List of Charts

Figure 01: Global Market Share Analysis, by Product Type, 2023(E) to 2032(F)

Figure 02: Global Market Y-o-Y Analysis, by Product Type, 2019(H) to 2032(F)

Figure 03: Global Market Attractiveness, by Product Type, 2023(E) to 2032(F)

Figure 04: Global Market Share Analysis, by Lamination, 2023(E) to 2032(F)

Figure 05: Global Market Y-o-Y Analysis, by Lamination, 2019(H) to 2032(F)

Figure 06: Global Market Attractiveness, by Lamination, 2023(E) to 2032(F)

Figure 07: Global Market Share Analysis, by Application, 2023(E) to 2032(F)

Figure 08: Global Market Y-o-Y Analysis, by Application, 2019(H) to 2032(F)

Figure 09: Global Market Attractiveness, by Application, 2023(E) to 2032(F)

Figure 10: Global Market Share Analysis, by Sales Channel, 2023(E) to 2032(F)

Figure 11: Global Market Y-o-Y Analysis, by Sales Channel, 2019(H) to 2032(F)

Figure 12: Global Market Attractiveness, by Sales Channel, 2023(E) to 2032(F)

Figure 13: Global Market Share Analysis, by End Use, 2023(E) to 2032(F)

Figure 14: Global Market Y-o-Y Analysis, by End Use, 2019(H) to 2032(F)

Figure 15: Global Market Attractiveness, End Use by, 2023(E) to 2032(F)

Figure 16: Global Market Share Analysis, by Region, 2023(E) to 2032(F)

Figure 17: Global Market Y-o-Y Analysis, by Region, 2019(H) to 2032(F)

Figure 18: Global Market Attractiveness, by Region, 2023(E) to 2032(F)

Figure 19: North America Market Attractiveness Analysis, by Product Type, 2023(E) to 2032(F)

Figure 20: North America Market Value Share Analysis, by Lamination, 2023(E) to 2032(F)

Figure 21: North America Market Value Share Analysis, by Application, 2023(E) to 2032(F)

Figure 22: North America Market Value Share Analysis, by Sales Channel, 2023(E) to 2032(F)

Figure 23: North America Market Value Share Analysis, by End Use, 2023(E) to 2032(F)

Figure 24: North America Market Attractiveness Analysis by Country, 2023E-2032F

Figure 25: Latin America Market Attractiveness Analysis, by Product Type, 2023(E) to 2032(F)

Figure 26: Latin America Market Value Share Analysis, by Lamination, 2023(E) to 2032(F)

Figure 27: Latin America Market Value Share Analysis, by Application, 2023(E) to 2032(F)

Figure 28: Latin America Market Value Share Analysis, by Sales Channel, 2023(E) to 2032(F)

Figure 29: Latin America Market Value Share Analysis, by End Use, 2023(E) to 2032(F)

Figure 30: Latin America Market Attractiveness Analysis by Country, 2023E-2032F

Figure 31: Europe Market Attractiveness Analysis, by Product Type, 2023(E) to 2032(F)

Figure 32: Europe Market Value Share Analysis, by Lamination, 2023(E) to 2032(F)

Figure 33: Europe Market Value Share Analysis, by Application, 2023(E) to 2032(F)

Figure 34: Europe Market Value Share Analysis, by Sales Channel, 2023(E) to 2032(F)

Figure 35: Europe Market Value Share Analysis, by End Use, 2023(E) to 2032(F)

Figure 36: Europe Market Attractiveness Analysis by Country, 2023E-2032F

Figure 37: East Asia Market Attractiveness Analysis, by Product Type, 2023(E) to 2032(F)

Figure 38: East Asia Market Value Share Analysis, by Lamination, 2023(E) to 2032(F)

Figure 39: East Asia Market Value Share Analysis, by Application, 2023(E) to 2032(F)

Figure 40: East Asia Market Value Share Analysis, by Sales Channel, 2023(E) to 2032(F)

Figure 41: East Asia Market Value Share Analysis, by End Use, 2023(E) to 2032(F)

Figure 42: East Asia Market Attractiveness Analysis by Country, 2023E-2032F

Figure 43: South Asia Market Attractiveness Analysis, by Product Type, 2023(E) to 2032(F)

Figure 44: South Asia Market Value Share Analysis, by Lamination, 2023(E) to 2032(F)

Figure 45: South Asia Market Value Share Analysis, by Application, 2023(E) to 2032(F)

Figure 46: South Asia Market Value Share Analysis, by Sales Channel, 2023(E) to 2032(F)

Figure 47: South Asia Market Value Share Analysis, by End Use, 2023(E) to 2032(F)

Figure 48: South Asia Market Attractiveness Analysis by Country, 2023E-2032F

Figure 49: Middle East & Africa Market Attractiveness Analysis, by Product Type, 2023(E) to 2032(F)

Figure 50: Middle East & Africa Market Value Share Analysis, by Lamination, 2023(E) to 2032(F)

Figure 51: Middle East & Africa Market Value Share Analysis, by Application, 2023(E) to 2032(F)

Figure 52: Middle East & Africa Market Value Share Analysis, by Sales Channel, 2023(E) to 2032(F)

Figure 53: Middle East & Africa Market Value Share Analysis, by End Use, 2023(E) to 2032(F)

Figure 54: Middle East & Africa Market Attractiveness Analysis by Country, 2023E-2032F

Figure 55: Oceania Market Attractiveness Analysis, by Product Type, 2023(E) to 2032(F)

Figure 56: Oceania Market Value Share Analysis, by Lamination, 2023(E) to 2032(F)

Figure 57: Oceania Market Value Share Analysis, by Application, 2023(E) to 2032(F)

Figure 58: Oceania Market Value Share Analysis, by Sales Channel, 2023(E) to 2032(F)

Figure 59: Oceania Market Value Share Analysis, by End Use, 2023(E) to 2032(F)

Figure 60: Oceania Market Attractiveness Analysis by Country, 2023E-2032F

Recommendations

Packaging

Disposable Plates Market

Published : May 2023

Packaging

Disposable Cutlery Market

Published : February 2023

Packaging

Biodegradable Disposable Tableware Market

Published : July 2022

Packaging

Tableware Market

Published : March 2022

Explore Packaging Insights

View Reports
Google translate

Bagasse Tableware Products Market