The global tableware market is valued at USD 15.6 billion in 2025 and is slated to reach USD 23.8 billion by 2035, recording an absolute increase of USD 8.2 billion over the forecast period. This translates into a total growth of 52.6%, with the market forecast to expand at a compound annual growth rate (CAGR) of 4.3% between 2025 and 2035. The overall market size is expected to grow by nearly 1.53X during the same period, supported by increasing demand for premium dining experiences in hospitality industry, growing adoption of eco-friendly tableware solutions in foodservice establishments, and rising preference for aesthetically appealing dinnerware across restaurants, hotels, and catering applications.
Between 2025 and 2030, the tableware market is projected to expand from USD 15.6 billion to USD 19.2 billion, resulting in a value increase of USD 3.6 billion, which represents 43.9% of the total forecast growth for the decade. This phase of development will be shaped by increasing foodservice industry expansion requiring durable commercial tableware systems, rising adoption of designer collections in upscale dining establishments, and growing demand for tableware with enhanced durability characteristics and aesthetic appeal. Restaurant operators are expanding their tableware sourcing capabilities to address the growing demand for themed collections, multi-functional designs, and high-volume commercial requirements.
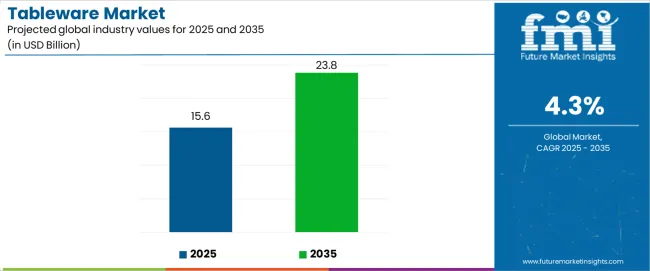
| Metric | Value |
|---|---|
| Estimated Value in (2025E) | USD 15.6 billion |
| Forecast Value in (2035F) | USD 23.8 billion |
| Forecast CAGR (2025 to 2035) | 4.3% |
From 2030 to 2035, the market is forecast to grow from USD 19.2 billion to USD 23.8 billion, adding another USD 4.6 billion, which constitutes 56.1% of the overall ten-year expansion. This period is expected to be characterized by the expansion of smart tableware integration for temperature control, the incorporation of antimicrobial coating technologies for hygiene enhancement, and the development of lightweight composite materials with improved break resistance. The growing adoption of hospitality technology solutions will drive demand for tableware with advanced functionality features and compatibility with automated dishwashing systems across commercial establishments.
Between 2020 and 2025, the tableware market experienced steady growth, driven by increasing demand for premium dining experiences in hospitality industries and growing recognition of tableware as essential equipment for brand differentiation across fine dining, casual dining, and quick-service restaurant applications. The market developed as operators recognized the potential for tableware to provide superior customer experience while maintaining operational efficiency and enabling cost-effective replacement programs. Technological advancement in ceramic manufacturing and glazing processes began emphasizing the critical importance of maintaining product quality and design consistency in diverse commercial environments.
Market expansion is being supported by the increasing global demand for dining experiences and the corresponding need for tableware systems that can provide superior aesthetic appeal and operational durability while enabling flexible design configurations and cost optimization across various foodservice and hospitality applications. Modern restaurant operators and hotel chains are increasingly focused on implementing tableware solutions that can optimize brand presentation, reduce replacement costs, and provide consistent quality throughout high-volume service operations. Tableware technology's proven ability to deliver exceptional design versatility, enable collection coordination, and support commercial kitchen integration make them essential equipment formats for contemporary foodservice and hospitality operations.
The growing emphasis on dining experience enhancement and brand differentiation is driving demand for tableware that can support premium presentation, improve customer satisfaction, and enable advanced design systems. Operators' preference for products that combine effective functionality with reduced maintenance requirements and aesthetic excellence is creating opportunities for innovative tableware implementations. The rising influence of social media marketing and experiential dining is also contributing to increased demand for tableware that can provide photogenic presentation, unique textures, and distinctive brand positioning across diverse restaurant categories.
The tableware market is poised for steady growth and transformation. As industries across foodservice, hospitality, catering services, and residential sectors seek products that deliver exceptional design quality, operational durability, and brand enhancement capabilities, tableware is gaining prominence not just as functional equipment but as strategic enablers of customer experience and operational efficiency.
Rising dining culture in Asia-Pacific and expanding premium foodservice markets globally amplify demand, while manufacturers are leveraging innovations in ceramic engineering, smart coating technologies, and modular collection architectures.
Pathways like antimicrobial surface treatments, temperature-responsive materials, and collection-specific design formats promise strong margin uplift, especially in high-value segments. Geographic expansion and design partnerships will capture volume, particularly where local manufacturing capabilities and hospitality industry proximity are critical. Regulatory pressures around food safety requirements, commercial dishwashing standards, hospitality hygiene guidelines, and material compliance specifications give structural support.
The market is segmented by material type, product category, distribution channel, application, end-use industry, price range, and region. By material type, the market is divided into ceramic tableware, glass tableware, and melamine tableware. By product category, it covers dinnerware, drinkware, and flatware. By distribution channel, it includes direct sales, retail distribution, and online sales. By application, it covers restaurant dining, hotel service, catering operations, institutional feeding, and others. By end-use industry, it is categorized into restaurants & cafes, hotels & resorts, healthcare facilities, educational institutions, and commercial catering. By price range, it covers economy (under USD 50 per set), mid-range (USD 50-150 per set), and premium (above USD 150 per set). Regionally, the market is divided into North America, Europe, East Asia, South Asia & Pacific, Latin America, and the Middle East & Africa.
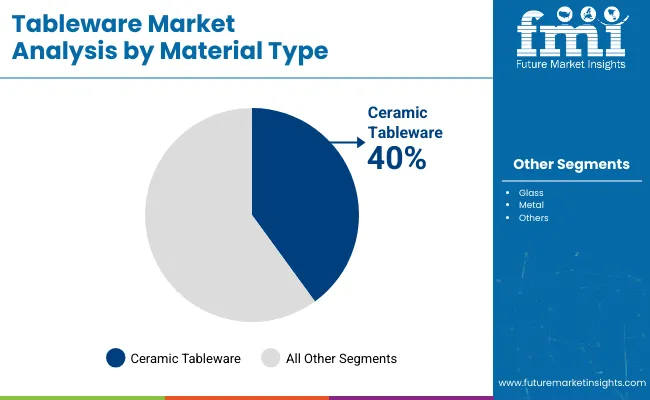
The ceramic tableware segment is projected to account for 52.7% of the tableware market in 2025, reaffirming its position as the leading material category. Restaurant operators and hospitality establishments increasingly utilize ceramic tableware for their optimal heat retention, excellent aesthetic versatility characteristics, and widespread adoption in fine dining, casual dining, and hotel service applications. The ceramic tableware technology's established industry standardization and consistent quality standards directly address the commercial requirements for reliable performance in high-volume foodservice environments.
This material segment forms the foundation of modern commercial dining operations, as it represents the tableware technology with the greatest market penetration and established demand across multiple hospitality categories and global markets. Manufacturer investments in enhanced glazing techniques and advanced ceramic formulations continue to strengthen adoption among restaurant operators and hotel chains. With companies prioritizing customer experience and operational efficiency, ceramic tableware aligns with both performance requirements and design flexibility objectives, making them the central component of comprehensive dining service strategies.
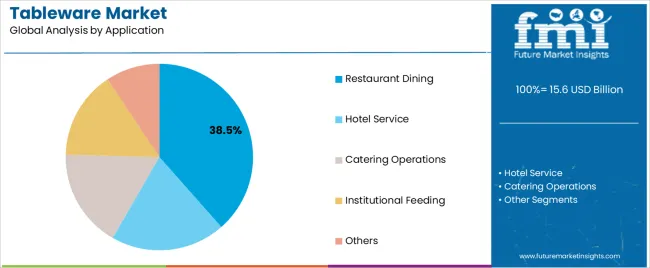
Restaurants & cafes applications are projected to represent 38.5% of tableware demand in 2025, underscoring their critical role as the primary commercial consumers of tableware equipment for dining service, beverage presentation, and food display operations. Restaurant and cafe operators prefer tableware for their exceptional design capabilities, superior durability characteristics, and ability to accommodate diverse menu formats while ensuring brand consistency with attractive presentation. Positioned as essential operational equipment for modern foodservice and hospitality operations, tableware offers both functional advantages and customer experience benefits.
The segment is supported by continuous innovation in ceramic technology and the growing availability of specialized design collections that enable brand differentiation with enhanced aesthetic appeal and operational durability. Additionally, restaurant and cafe operators are investing in comprehensive tableware programs to support high-volume tableware utilization and service efficiency. As dining experiences become more competitive and presentation quality increases, restaurants & cafes applications will continue to dominate the end-use market while supporting advanced design integration and customer satisfaction strategies.
The tableware market is advancing steadily due to increasing demand for enhanced dining experiences in foodservice industries and growing adoption of premium tableware solutions that provide superior aesthetic appeal and operational durability while enabling cost optimization across diverse restaurant and hospitality applications. However, the market faces challenges, including high replacement costs for premium collections, competition from disposable serving alternatives, and the need for specialized handling procedures for delicate materials. Innovation in antimicrobial coatings and smart material integration continues to influence product development and market expansion patterns.
The growing adoption of exclusive designs, branded collections, and personalized tableware is enabling manufacturers to produce tableware with superior brand differentiation, enhanced customer appeal, and multi-concept compatibility. Advanced design systems provide improved aesthetic versatility while allowing more efficient collection coordination and consistent brand presentation across various dining applications and service configurations. Manufacturers are increasingly recognizing the competitive advantages of design collaboration capabilities for market differentiation and premium positioning.
Modern tableware producers are incorporating silver ion treatments, bacterial resistance coatings, and validated sanitization systems to enhance food safety compliance, enable hygiene assurance, and deliver value-added health protection solutions to restaurant brands and hospitality customers. These technologies improve operational safety while enabling new functionality capabilities, including contamination prevention, sanitization verification, and health compliance documentation. Advanced antimicrobial integration also allows manufacturers to support food safety management and regulatory compliance beyond traditional tableware approaches.
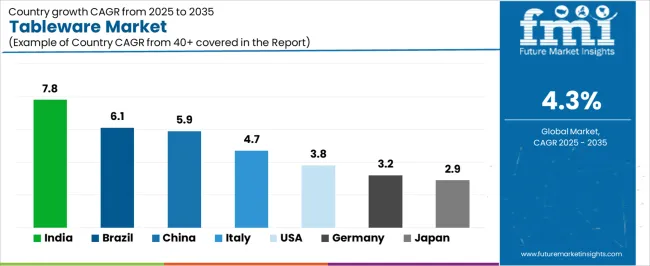
| Country | CAGR (2025-2035) |
|---|---|
| India | 7.8% |
| China | 5.9% |
| USA | 3.8% |
| Brazil | 6.1% |
| Germany | 3.2% |
| Japan | 2.9% |
| Italy | 4.7% |
The tableware market is experiencing strong growth globally, with India leading at a 7.8% CAGR through 2035, driven by the expanding hospitality industry, growing restaurant culture, and significant investment in foodservice infrastructure. China follows at 5.9%, supported by rapid dining industry growth, increasing premium restaurant development, and growing tourism-driven demand. The USA shows growth at 3.8%, emphasizing premium dining experiences and commercial kitchen modernization.
Brazil records 6.1%, focusing on hospitality industry expansion and growing restaurant consumption. Germany demonstrates 3.2% growth, prioritizing quality standards and advanced manufacturing excellence. Japan exhibits 2.9% growth, emphasizing precision craftsmanship and efficient commercial operations. Italy shows 4.7% growth, supported by culinary tradition modernization and tableware manufacturing innovation.
The report covers an in-depth analysis of 40+ countries top-performing countries are highlighted below.
Revenue from tableware in India is projected to exhibit exceptional growth with a CAGR of 7.8% through 2035, driven by expanding hospitality sector and rapidly growing restaurant culture supported by urbanization trends promoting dining out experiences and premium food service distribution. The country's strong position in hospitality development and increasing investment in commercial kitchen infrastructure are creating substantial demand for tableware solutions. Major restaurant chains and hotel operators are establishing comprehensive procurement capabilities to serve both domestic expansion demand and tourism service markets.
Revenue from tableware in China is expanding at a CAGR of 5.9%, supported by the country's massive dining market, expanding restaurant development activities, and increasing adoption of premium dining solutions. The country's government initiatives promoting hospitality modernization and growing middle-class dining consumption are driving requirements for sophisticated tableware capabilities. International suppliers and domestic manufacturers are establishing extensive production and distribution capabilities to address the growing demand for tableware products.
Revenue from tableware in the USA is expanding at a CAGR of 3.8%, supported by the country's mature foodservice sector, strong emphasis on dining experience enhancement, and robust demand for high-performance products in restaurant and hospitality applications. The nation's advanced hospitality sector and design-focused operations are driving sophisticated tableware systems throughout the supply chain. Leading manufacturers and design providers are investing extensively in customization capabilities and aesthetic features to serve both domestic and international markets.
Revenue from tableware in Brazil is growing at a CAGR of 6.1%, driven by the country's expanding hospitality industry, growing restaurant sector, and increasing investment in modern service facilities. Brazil's large domestic market and commitment to hospitality modernization are supporting demand for tableware solutions across multiple service segments. Manufacturers are establishing comprehensive production capabilities to serve the growing domestic market and regional tourism opportunities.
Revenue from tableware in Germany is expanding at a CAGR of 3.2%, supported by the country's precision manufacturing leadership, advanced quality capabilities, and strategic focus on high-performance commercial products. Germany's technical excellence and manufacturing focus are driving demand for tableware in restaurant service, hotel operations, and institutional applications. Manufacturers are investing in comprehensive quality capabilities to serve both domestic operators and international specialty markets.
Revenue from tableware in Japan is growing at a CAGR of 2.9%, driven by the country's expertise in precision manufacturing, emphasis on service excellence, and strong position in hospitality and restaurant service. Japan's established manufacturing technology capabilities and commitment to quality are supporting investment in advanced production technologies throughout major hospitality centers. Industry leaders are establishing comprehensive quality systems to serve domestic restaurant operators and hospitality establishments.
Revenue from tableware in Italy is expanding at a CAGR of 4.7%, supported by the country's culinary tradition, growing hospitality sector, and strategic position in European manufacturing markets. Italy's manufacturing capabilities and integrated culinary infrastructure are driving demand for high-quality tableware in restaurant service, hotel applications, and specialty dining operations. Leading manufacturers are investing in specialized capabilities to serve the requirements of diverse hospitality and restaurant industries.
The tableware market in Europe is projected to grow from USD 4.2 billion in 2025 to USD 6.1 billion by 2035, registering a CAGR of 3.8% over the forecast period. Germany is expected to maintain its leadership position with a 28.7% market share in 2025, declining slightly to 28.3% by 2035, supported by its strong manufacturing base, advanced quality production capabilities, and comprehensive hospitality and restaurant service sector serving diverse tableware applications across Europe.
Italy follows with a 22.1% share in 2025, projected to reach 22.8% by 2035, driven by robust demand for tableware in restaurant service, culinary applications, and tableware manufacturing, combined with established hospitality infrastructure and design-oriented production expertise. France holds a 18.9% share in 2025, expected to reach 19.4% by 2035, supported by strong hospitality tradition and growing dining culture adoption. The United Kingdom commands a 12.6% share in 2025, projected to reach 12.9% by 2035, while Spain accounts for 8.9% in 2025, expected to reach 9.2% by 2035.
Poland maintains a 4.7% share in 2025, growing to 4.8% by 2035. The Rest of Europe region, including Nordic countries, Eastern Europe, Netherlands, Switzerland, and other nations, is anticipated to maintain momentum, with its collective share moving from 4.1% to 2.6% by 2035, attributed to increasing hospitality development in Eastern Europe and growing restaurant culture in Nordic countries implementing advanced tableware programs.
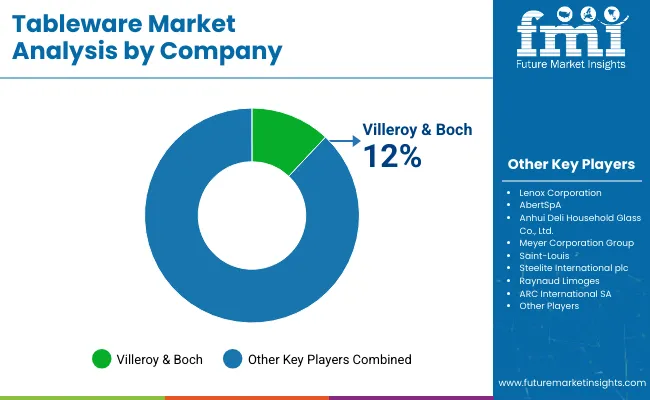
The tableware market is characterized by competition among established ceramic manufacturers, specialized hospitality suppliers, and integrated design solutions providers. Companies are investing in ceramic technology research, glazing optimization, design collaboration development, and comprehensive product portfolios to deliver consistent, high-performance, and application-specific tableware solutions. Innovation in material systems, aesthetic technologies, and customization capabilities is central to strengthening market position and competitive advantage.
Arc International leads the market with 13% share, offering comprehensive tableware solutions with a focus on restaurant and hospitality applications. Libbey Inc. provides specialized glassware capabilities with an emphasis on commercial service and high-volume production systems. Steelite International delivers innovative ceramic products with a focus on durable configuration technologies and operational efficiency. Churchill China specializes in ceramic tableware systems and design solutions for hospitality applications. Oneida Group focuses on flatware and serving equipment with integrated dining solutions. RAK Porcelain offers specialized ceramic tableware for commercial service and institutional applications with emphasis on Middle Eastern and international market requirements.
| Items | Values |
|---|---|
| Quantitative Units (2025) | USD 15.6 Billion |
| Material Type | Ceramic Tableware, Glass Tableware, Melamine Tableware |
| Product Category | Dinnerware, Drinkware, Flatware |
| Distribution Channel | Direct Sales, Retail Distribution, Online Sales |
| Application | Restaurant Dining, Hotel Service, Catering Operations, Institutional Feeding, Others |
| End-Use Industry | Restaurants & Cafes, Hotels & Resorts, Healthcare Facilities, Educational Institutions, Commercial Catering |
| Price Range | Economy (under USD 50 per set), Mid-Range (USD 50-150 per set), Premium (above USD 150 per set) |
| Regions Covered | North America, Europe, East Asia, South Asia & Pacific, Latin America, Middle East & Africa |
| Countries Covered | United States, Canada, United Kingdom, Germany, France, Italy, China, Japan, South Korea, India, Brazil, Australia and 40+ countries |
| Key Companies Profiled | Arc International, Libbey Inc., Steelite International, Churchill China, Oneida Group, and RAK Porcelain |
| Additional Attributes | Dollar sales by material type and application category, regional demand trends, competitive landscape, technological advancements in ceramic manufacturing systems, glazing development, design integration innovation, and commercial service connectivity |
The global tableware market is estimated to be valued at USD 15.6 billion in 2025.
The market size for the tableware market is projected to reach USD 23.8 billion by 2035.
The tableware market is expected to grow at a 4.3% CAGR between 2025 and 2035.
The key product types in tableware market are ceramic tableware, glass tableware and melamine tableware.
In terms of application, restaurant dining segment to command 38.5% share in the tableware market in 2025.


Full Research Suite comprises of:
Market outlook & trends analysis
Interviews & case studies
Strategic recommendations
Vendor profiles & capabilities analysis
5-year forecasts
8 regions and 60+ country-level data splits
Market segment data splits
12 months of continuous data updates
DELIVERED AS:
PDF EXCEL ONLINE
Competitive Landscape of Tableware Providers
Glass Tableware Market Trends - Size, Demand & Forecast to 2025 to 2035
Bagasse Tableware Products Market Size and Share Forecast Outlook 2025 to 2035
Ceramic Tableware Market Size and Share Forecast Outlook 2025 to 2035
Market Share Insights of Bagasse Tableware Product Providers
Porcelain Tableware Market Trends - Growth & Demand Forecast 2025 to 2035
Compostable Tableware Market Size and Share Forecast Outlook 2025 to 2035
USA Bagasse Tableware Products Market Outlook – Size, Trends & Forecast 2025-2035
Bamboo Fiber Tableware and Kitchenware Market Size and Share Forecast Outlook 2025 to 2035
Japan Bagasse Tableware Products Market Outlook – Size, Trends & Forecast 2025-2035
ASEAN Bagasse Tableware Products Market Insights – Growth, Demand & Forecast 2025-2035
Germany Bagasse Tableware Products Market Outlook – Size, Trends & Forecast 2025-2035
Ceramic and Porcelain Tableware Market Size and Share Forecast Outlook 2025 to 2035
Heat-Resistant Ceramic Tableware Market Analysis – Growth & Trends 2025 to 2035
Biodegradable Disposable Tableware Market Insights – Growth & Forecast 2024-2034
Demand and Trend Analysis of Bagasse Tableware Product in Japan Size and Share Forecast Outlook 2025 to 2035
Demand and Trend Analysis of Bagasse Tableware Product in Korea Size and Share Forecast Outlook 2025 to 2035
Western Europe Bagasse Tableware Market Analysis – Growth & Forecast 2023-2033

Thank you!
You will receive an email from our Business Development Manager. Please be sure to check your SPAM/JUNK folder too.
Chat With
MaRIA