Biodegradable Disposable Tableware Market
Market Insights on Biodegradable Disposable Tableware covering sales outlook, demand forecast & up-to-date key trends
Biodegradable Disposable Tableware Market By Product (Plates, Bowls, Cups, Trays, Cutlery), Material (Pulp & Paper, Bioplastics), Packaging Application (Food, Beverages) & Region - Forecast 2022-2030
Biodegradable Disposable Tableware Market Outlook (2022-2030)
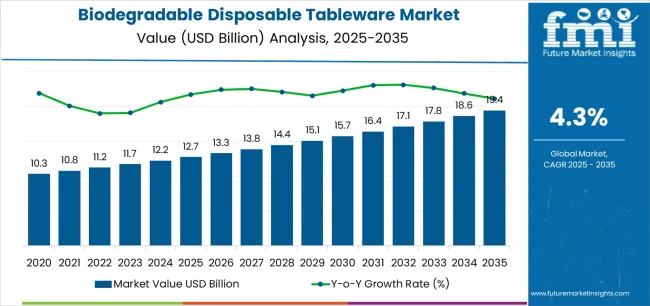
[174 Pages Report] The global biodegradable disposable tableware market is all set to make greater strides at a CAGR of 6.4% between 2022 and 2030, reaching US$ 18 Bn by the year 2030.
Biodegradable Disposable Tableware Market Size (2022) |
US$ 10.8 Bn |
Projected Market Value (2030) |
US$ 18 Bn |
Global Market Growth Rate (2022-2030) |
6.4% CAGR |
Collective Value Share: Top 5 Companies (2022E) |
16% |
The biodegradable disposable tableware market is likely to record 6.5% growth from 2022. Food service industry would be the key end user contributing to the market share due to convenience and hygiene offered by the biodegradable disposable tableware market.
Environmental awareness among the population is driving demand for sustainability and reducing impact of packaging on the environment. Consumers’ attitude towards sustainability has changed drastically in the last decade and is likely to continue in the years to come.
Biodegradable disposable tableware are lightweight, hygienic, and convenient. For foodservice industry, biodegradable disposable tableware is an apt solution as it is cost-effective as compared to tableware of glass, which can be difficult to handle. Consumers are recognizing that becoming more sustainable can have a positive impact on the environment and packaging made up of biodegradable material has a positive impact on the minds of the customers.
Furthermore, it allows the businesses to establish themselves as green brands and minimize ecological footprint. This is anticipated to create opportunities for companies to gain competitive advantage through adoption of green strategies without compromising on the product quality.
Let us know your requirement to get
100% FREE customization
How The Market Progressed Till June 2022?
Particulars |
Details |
H1 2021 |
6.3% |
H1 2022 Projected |
6.5% |
H1 2022 Expected |
7.0% |
BPS Change - H1, 2022 (O) – H1, 2022 (P) |
(+) 50 ↑ |
BPS Change – H1, 2022 (O) – H1, 2021 |
(+) 70 ↑ |
Future Market Insights predict a comparison and review analysis of the dynamics of the biodegradable disposable tableware market, which is principally subjected to an array of industry factors along with a few definite influences regarding slow adoption rate, especially in the developing economies will hamper the market growth rate.
Some new advances that have taken place in the market include the use of bagasse, leaf, and starch extracted from several natural raw materials for biodegradable disposable tableware products. In June 2022, Huhtamaki Oyj expanded its molded fiber manufacturing capacity in North America.
The market for biodegradable disposable tableware is expected to surge by 70 basis share points (BPS) in H1-2022 (O) against comparison with H1-2021, according to an FMI analysis. However, when comparing the H1-2022 projected and H1-2022 outlook period, a rise in BPS change by 50 BPS has been noticed. The key reason for this change in growth rate is due to light and eco-friendly disposable products which are 100% compostable.
Despite these outlooks, growing preference for eco-friendly tableware and growing concern about the negative effects of plastic tableware are driving the market for biodegradable disposable tableware.
Biodegradable Disposable Tableware Demand Analysis (2014 to 2021) Vs Market Outlook (2022 to 2030)
Biodegradable disposable tableware market is projected to reach over US$ 13,080.2 Mn in the next 5 years. Foodservice industry is expected to remain the top end-user and witness a growth of 1.8x by value, thereby attributing to consumer consciousness regarding the environment.
The biodegradable disposable tableware market is projected to clock a CAGR of 6.5% during the forecast period. Europe and Asia Pacific together are likely to dominate with a market value share of over 65% in the global biodegradable disposable tableware market by 2030. Adoption of biodegradable disposable tableware has witnessed a surge as it offers environment-friendly attributes without compromising on functionality.
What’s with e-Retail Channels?
“E-Retail Channels likely to augment the Biodegradable Disposable Tableware Market Growth”
One of the imperatives to expand consumer base is by supplying them with end-products at an ease. This is widely being done using the internet. The online channel business reduces players in the supply chain and enhances cost efficiency, resulting in increased margin for the end users.
There is cost reduction, which results into efficient supply of the products. Therefore, producers and suppliers of biodegradable disposable tableware are either using their own platform or via some other e-Commerce supply chain to sell their items by contributing in an enhancement in supply-side driver.
Promotion of brands on the web stores can allow the manufacturers to provide detailed information about the products. Customers have various requirements and giving information such as material types, size and shape of various products helps them take faster decisions for the purchase. e-Retail channels also attract new customers. With strong online presence and optimized search engines, biodegradable tableware manufacturers can expand their customer reach.
For instance, companies provide detailed information about their product range where the customer can go through the product catalogues and connect to the sales team of the company. It also provides information regarding the authentic sellers available online.
Eco-friendly Packaging Solutions to dominate?
“Eco-Friendly Packaging Solutions Gain Momentum”
The sustainable packaging solutions adopted by various industries are anticipated to provide growth opportunity to the biodegradable disposable tableware market to grow. With growth in various industries, the demand for sustainable packaging has hiked. Increasing consciousness about the environment and regulatory guidelines by various governments has led to inclination towards environment-friendly packaging materials.
The global consumption of the plastic continues to grow and the major challenge for government is ineffective waste management. New EU directive for single-use plastics by European government is likely to encourage the use of biodegradable materials.
This provides an opportunity for the biodegradable disposable tableware market to grow since products are made of bioplastics and paper & paperboard that are recyclable and do not have hazardous effects on the environment. The manufacturers have shifted their focus on manufacturing of biodegradable disposable tableware so that they can provide a substitute for the disposable plastic tableware.
Find your sweet spots for generating winning opportunities in this market.
Talk to AnalystMaking best from Waste?
“Turning Waste into Biodegradable Disposable Tableware to Boost Circular Economy”
Biodegradable disposable tableware is a green alternative to the other tableware products made up of plastic. Biodegradable disposable tableware produce no waste, which is harmful to the environment. Besides, biodegradable disposable tableware can be made from biodegradable waste.
Bagasse is the residue that remains after utilizing stalks to extract its juice, and similarly bran of rice, wheat, and maize can be used to make biodegradable disposable tableware. This will lead to effective utilization of resources. Tableware made from biodegradable products have zero waste and can be utilized most effectively by providing eco-friendly tableware solutions to customers.
The market has an opportunity to grow by developing products made from green waste such as fallen palm leaf and paper waste. This leads to manage the waste generation challenge and advancements in the biodegradable disposable tableware market. This gives manufacturers the opportunity to widen the horizon of their product line. Hence, recycling the waste is an opportunity for the biodegradable disposable tableware market and would impact the market positively.
COVID-19 Impact on Biodegradable Disposable Tableware Market
Food Service industry has been heavily impacted due to containment measures taken by government. Restaurants, café owners, and operators in the food service industry have turned to dining options with less risk options. Surge in take-aways and food delivery options has been witnessed. With many restaurants implementing stringent healthy and safe options, focus on packaging of food and beverages has increased.
Biodegradable disposable tableware with various options for frozen foods and microwaveable options have been continuously in demand by the business owners. Biodegradable disposable tableware are light in weight and can handle both - hot and cold food and beverages. This is likely to fuel the demand for biodegradable disposable market during the time of pandemic.

A unified Market Research Subscription Platform, built for today's disparate research needs.
What are the factors restraining the Biodegradable Disposable Tableware Market?
“Challenges Associated with Biodegradable Plastics to Limit the Use of Bioplastics”
Biodegradation of products is very much dependent on environment. There are various surroundings where decomposition takes place - such as industrial composting, soil, marine, and others. The most preferred way for biodegradation is composting, followed by soil, fresh water, marine water, and landfill.
Studies of one particular brand in the U.S., governed by Biodegradable Plastics Institute, found that breakdown of biodegradable plastics is very much dependent on humidity and temperature. The rate of decomposition goes slow in cold weather.
According to the European Plastics Recyclers Association, biodegradable plastics are not the right environmental choice. These plastics take lots of energy and oil to produce. There are issues with biodegradable disposable tableware. Being biodegradable does not mean they are safe for environment in all aspects. The above-mentioned factors might hamper growth of the biodegradable disposable tableware market over the forecast period.
Category-wise Insights
The variation in prices of biodegradable disposable tableware in different regions is on the basis of product type. Prices of biodegradable disposable tableware are relatively low in Asia-Pacific owing to low cost of raw material, less labour cost, and high number of manufacturers.
In regions such as North America, Latin America, and Europe, the cost of biodegradable disposable tableware is at the higher end due to the additional cost incurred for procurement of raw material and additional players in the supply chain, which add up to the cost of the product.
Region-wise Insights
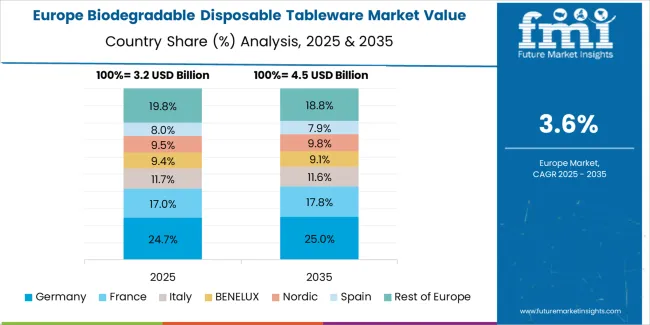
Demand for biodegradable disposable tableware in Europe is likely to be healthy in the long run owing to consumers’ awareness and inclination towards buying products that offer environmental benefit. Biodegradable disposable tableware market is significantly influenced by demand from food service industry.
The biodegradable disposable tableware market is likely to grow in North America driven by demand from cafes, restaurants, take-away, and on-the-go consumption. Furthermore, rising demand for packaged foods and online food deliveries is anticipated to increase demand for biodegradable disposable tableware in the Asia-Pacific.
Competitive Landscape
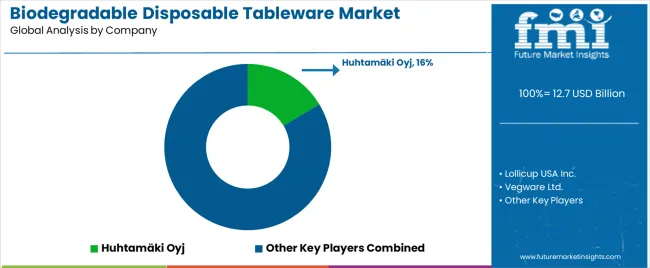
The Biodegradable disposable tableware market is a fragmented one with the top players accounting for 15-20% of the global production. The key players operating in the market are focusing on expanding their reach globally, diversifying their product portfolio, and rapid product development to gain competitive edge.
Biodegradable Disposable Tableware Industry Report Scope
Attribute |
Details |
Forecast Period |
2022-2030 |
Historical Data Available for |
2014-2021 |
Market Analysis |
US$ Mn/Bn for Value |
Key Regions Covered |
North America, Latin America, Europe, South Asia, East Asia, Oceania, and the Middle East & Africa |
Key Countries Covered |
U.S., Canada, Brazil, Mexico, Germany, U.K., France, Italy, Spain, Benelux, Russia, China, Japan, South Korea, India, Thailand, Indonesia, Malaysia, Singapore, China, Japan, South Korea, Australia, New Zealand, Turkey, Egypt, North Africa, South Africa, and GCC Countries |
Key Market Segments Covered |
Product, Material, Packaging Application, End-use, and Region |
Key Companies Profiled |
|
Pricing |
Available upon Request |
Key Segments Covered in Biodegradable Disposable Tableware Industry Research
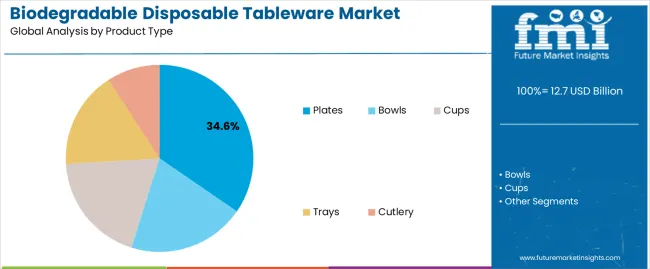
Biodegradable Disposable Tableware Market by Product
- Plates
- Bowls
- Cups
- Trays
- Cutlery
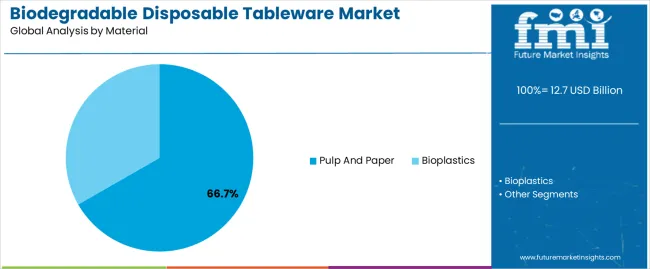
Biodegradable Disposable Tableware Market by Material
- Pulp & Paper
- Bioplastics
- Starch-based Bioplastic
- Polylactic Acid (PLA)
- Polybutylene Succinate (PBS)
- Polyhydroxybutyrate (PHB)
- Others (PHA, etc.)
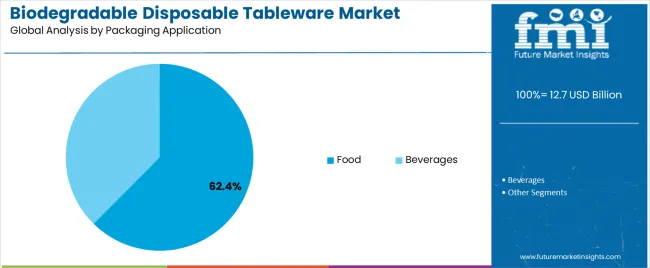
Biodegradable Disposable Tableware Market by Packaging Application
- Food
- Fresh-cut Fruits & Vegetables
- Processed Food Products
- Ready-to-Eat Meals
- Soups
- Other Foods
- Beverages
- Carbonated Beverages
- Non-carbonated Beverages
Biodegradable Disposable Tableware Market by End-use
- Commercial Use
- Full Service Restaurants
- Quick Service Restaurants
- Catering
- Others (cafes, Lounges, etc.)
- Institutional Use
- Household Use
Biodegradable Disposable Tableware Market by Region
- North America Biodegradable Disposable Tableware Market
- Latin America Biodegradable Disposable Tableware Market
- Europe Biodegradable Disposable Tableware Market
- East Asia Biodegradable Disposable Tableware Market
- South Asia Biodegradable Disposable Tableware Market
- Oceania Biodegradable Disposable Tableware Market
- Middle East & Africa (MEA) Biodegradable Disposable Tableware Market
Frequently Asked Questions
How much is the Biodegradable Disposable Tableware market currently worth?
The global Biodegradable Disposable Tableware market is expected to be worth US$ 10.8 Bn by the year 2022.
What is the sales forecast for Biodegradable Disposable Tableware through 2030?
The market for Biodegradable Disposable Tableware is expected to reach US$ 18 Bn by 2030, expanding at a CAGR of 6.4%.
What was last 7-year market CAGR for the sales of Biodegradable Disposable Tableware?
For 2014-2021, Biodegradable Disposable Tableware’ sales expanded at the rate of ~3.5%.
Who are the key manufacturing companies for Biodegradable Disposable Tableware?
Huhtamäki Oyj, Lollicup USA Inc., Vegware Ltd., Dart Container Corporation, Solia, Inc., Hefty, Dixie Consumer Products LLC, Duni AB, Graphic Packaging International, LLC, Pacovis AG, Papstar GmbH, Dispo International, Genpak LLC, Natural Tableware, and Eco-Products, Inc.
What’s with the Asia-Pacific?
The Asia-Pacific holds a noteworthy market share.
Table of Content
1. Executive Summary 1.1. Global Market Outlook 1.2. Market Analysis 1.3. Analysis and Recommendations 2. Market Overview 2.1. Market Coverage 2.2. Market Definition 3. Key Market Trends 3.1. Key Trends Impacting the Market 3.2. Product Innovation Trends 4. Impact of COVID-19 4.1. Current Statistics and Probable Future Impact 4.2. Current Economic Projection – GDP/GVA and Probable Impact 4.3. Comparison of SAARs and Market Recovery, for Key Countries 4.4. Comparison to 2008 Financial Crisis and Market Recovery, for Key Countries 4.5. Impact of COVID-19 on Market 5. Global Market Demand Analysis 2014–2021 and Forecast, 2022–2030 5.1. Historical Market Volume (Mn Units) Analysis, 2014–2021 5.2. Current and Future Market Volume (Mn Units) Projections, 2022–2030 5.3. Y-o-Y Growth Trend Analysis 6. Global Market - Pricing Analysis 6.1. Regional Pricing Analysis 6.2. Pricing Break-up 6.3. Global Average Pricing Analysis Benchmark 7. Global Market Demand (Value in US$ Mn) Analysis 2014–2021 and Forecast, 2022–2030 7.1. Historical Market Value (US$ Mn) Analysis, 2014–2021 7.2. Current and Future Market Value (US$ Mn) Projections, 2022–2030 7.2.1. Y-o-Y Growth Trend Analysis 7.2.2. Absolute $ Opportunity Analysis 8. Market Background 8.1. Global Packaging Market Outlook 8.2. Global Rigid Packaging Market Outlook 8.3. Global Plastic Packaging Market Outlook 8.4. Global Biodegradable Disposable Tableware: Costing Analysis 8.5. Global Biodegradable Disposable Tableware: Manufacturing Process 8.6. Specifications of used by Suppliers in Major Supermarkets 8.7. Key Industry Perspective: What Industry Leaders are saying? 8.8. Macro-Economic Factors 8.8.1. Global GDP Growth Outlook 8.8.2. GDP Per Capita 8.8.3. Manufacturing Value Added 8.8.4. GDP Growth Outlook 8.8.5. Manufacture Value Added (MVA) 8.8.6. Trade Analysis 8.8.7. Industrial Production 8.8.8. Domestic Demand 8.8.9. Import Duty on Raw Materials – Regional 8.9. Forecast Factors - Relevance & Impact 8.9.1. Global Rigid Packaging Market Growth 8.9.2. Regional Manufacturing Value Added Growth 8.9.3. Segmental Revenue Growth of Key Players 8.9.4. Top Companies Historical Revenue Growth 8.10. Value Chain Analysis 8.10.1. Key Participants 8.10.1.1. Raw Material Suppliers 8.10.1.2. Manufacturers 8.10.1.3. Distributors 8.10.2. Profitability Margin 8.11. Market Dynamics 8.11.1. Drivers 8.11.2. Restraints 8.11.3. Opportunity Analysis 9. Global Market Analysis 2014–2021 and Forecast 2022–2030, By Material 9.1. Introduction 9.2. Historical Market Size (US$ Mn) and Volume (Mn Units) Analysis, By Material, 2014–2021 9.3. Current and Future Market Size (US$ Mn) and Volume (Mn Units) Analysis and Forecast, By Material, 2022–2030 9.3.1. Plastic 9.3.1.1. Synthetic Biodegradable Plastic 9.3.1.1.1. PCL 9.3.1.1.2. PBS 9.3.1.2. Bio-Based Biodegradable Plastic 9.3.1.2.1. Starch based 9.3.1.2.2. PLA 9.3.1.2.3. PHB 9.3.2. Paper & Paperboard 9.3.2.1. Wood 9.3.2.2. Non-wood 9.3.2.2.1. Straw 9.3.2.2.2. Leaf 9.3.2.2.3. Bamboo 9.3.2.2.4. Bagasse/Sugarcane 9.3.2.2.5. Others (Seeds, Bast, etc.) 9.4. Market Attractiveness Analysis, By Material 10. Global Market Analysis 2014–2021 and Forecast 2022–2030, By Product Type 10.1. Introduction 10.2. Historical Market Size (US$ Mn) and Volume Analysis, By Product Type, 2014–2021 10.3. Current and Future Market Size (US$ Mn) and Volume Analysis and Forecast, By Product Type ,2022–2030 10.3.1. Cutlery 10.3.2. Plates 10.3.3. Bowls 10.3.4. Cups 10.3.5. Trays 10.3.6. Others 10.4. Market Attractiveness Analysis, By Product Type 11. Global Market Analysis 2014–2021 and Forecast 2022–2030, By End Use 11.1. Introduction 11.2. Historical Market Size (US$ Mn) and Volume (Mn Units) Analysis, By End Use, 2014–2021 11.3. Current and Future Market Size (US$ Mn) and Volume (Mn Units) Analysis and Forecast, By End Use, 2022–2030 11.3.1. Food Service 11.3.1.1. Hotels 11.3.1.2. Restaurants & Cafes 11.3.1.3. Quick Service Restaurants (QSR) 11.3.2. Institutional 11.3.2.1. Cinemas 11.3.2.2. Airline & Railway Catering 11.3.2.3. Schools & Offices 11.3.2.4. Hospitals 11.3.3. Household 11.4. Market Attractiveness Analysis, By End Use 12. Global Market Analysis 2014–2021 and Forecast 2022–2030, by Region 12.1. Introduction 12.2. Historical Market Size (US$ Mn) and Volume Analysis, by Region, 2014–2021 12.3. Current Market Size (US$ Mn) and Volume Analysis and Forecast, by Region, 2022–2030 12.3.1. North America 12.3.2. Latin America 12.3.3. Europe 12.3.4. Asia Pacific 12.3.5. Middle East and Africa (MEA) 12.4. Market Attractiveness Analysis, by Region 13. North America Market Analysis 2014–2021 and Forecast 2022–2030 13.1. Introduction 13.2. Pricing Analysis 13.3. Historical Market Size (US$ Mn) and Volume (Mn Units) Analysis, by Market Taxonomy, 2014–2021 13.4. Market Size (US$ Mn) and Volume (Mn Units) Forecast, by Market Taxonomy, 2022–2030 13.4.1. By Country 13.4.1.1. U.S. 13.4.1.2. Canada 13.4.2. By Material 13.4.3. By Product Type 13.4.4. By End Use 13.5. Market Attractiveness Analysis 13.5.1. By Country 13.5.2. By Material 13.5.3. By Product Type 13.5.4. By End Use 14. Latin America Market Analysis 2014–2021 and Forecast 2022–2030 14.1. Introduction 14.2. Pricing Analysis 14.3. Historical Market Size (US$ Mn) and Volume (Mn Units) Analysis, by Market Taxonomy, 2014–2021 14.4. Market Size (US$ Mn) and Volume (Mn Units) Forecast, by Market Taxonomy, 2022–2030 14.4.1. By Country 14.4.1.1. Brazil 14.4.1.2. Mexico 14.4.1.3. Argentina 14.4.1.4. Rest of Latin America 14.4.2. By Material 14.4.3. By Product Type 14.4.4. By End Use 14.5. Market Attractiveness Analysis 14.5.1. By Country 14.5.2. By Material 14.5.3. By Product Type 14.5.4. By End Use 15. Europe Market Analysis 2014–2021 and Forecast 2022–2030 15.1. Introduction 15.2. Pricing Analysis 15.3. Historical Market Size (US$ Mn) and Volume (Mn Units) Analysis, by Market Taxonomy, 2014–2021 15.4. Market Size (US$ Mn) and Volume (Mn Units) Forecast, by Market Taxonomy, 2022–2030 15.4.1. By Country 15.4.1.1. Germany 15.4.1.2. Italy 15.4.1.3. France 15.4.1.4. U.K. 15.4.1.5. Spain 15.4.1.6. BENELUX 15.4.1.7. Nordics 15.4.1.8. Russia 15.4.1.9. Poland 15.4.1.10. Rest of Europe 15.4.2. By Material 15.4.3. By Product Type 15.4.4. By End Use 15.5. Market Attractiveness Analysis 15.5.1. By Country 15.5.2. By Material 15.5.3. By Product Type 15.5.4. By End Use 16. Asia Pacific Market Analysis 2014–2021 and Forecast 2022–2030 16.1. Introduction 16.2. Pricing Analysis 16.3. Historical Market Size (US$ Mn) and Volume (Mn Units) Analysis, by Market Taxonomy, 2014–2021 16.4. Market Size (US$ Mn) and Volume (Mn Units) Forecast, by Market Taxonomy, 2022–2030 16.4.1. By Country 16.4.1.1. China 16.4.1.2. India 16.4.1.3. Japan 16.4.1.4. ASEAN Countries 16.4.1.5. Australia & New Zealand 16.4.1.6. Rest of APAC 16.4.2. By Material 16.4.3. By Product Type 16.4.4. By End Use 16.5. Market Attractiveness Analysis 16.5.1. By Country 16.5.2. By Material 16.5.3. By Product Type 16.5.4. By End Use 17. Middle East and Africa Market Analysis 2014–2021 and Forecast 2022–2030 17.1. Introduction 17.2. Pricing Analysis 17.3. Historical Market Size (US$ Mn) and Volume (Mn Units) Analysis, by Market Taxonomy, 2014–2021 17.4. Market Size (US$ Mn) and Volume (Mn Units) Forecast, by Market Taxonomy, 2022–2030 17.4.1. By Country 17.4.1.1. GCC Countries 17.4.1.2. Turkey 17.4.1.3. Northern Africa 17.4.1.4. South Africa 17.4.1.5. Rest of Middle East and Africa 17.4.2. By Material 17.4.3. By Product Type 17.4.4. By End Use 17.5. Market Attractiveness Analysis 17.5.1. By Country 17.5.2. By Material 17.5.3. By Product Type 17.5.4. By End Use 17.5.5. 18. Market Structure Analysis 18.1. Market Analysis, by Tier of Companies 18.2. Market Concentration 18.3. Market Share Analysis of Top Players 18.4. Market Presence Analysis 18.4.1. By Regional footprint of Players 18.4.2. Product foot print by Players 18.4.3. Channel Foot Print by Players 19. Competition Analysis 19.1. Competition Dashboard 19.2. Competition Benchmarking 19.3. Competition Deep Dive 19.3.1. Huhtamäki Oyj 19.3.1.1. Overview 19.3.1.2. Product Portfolio 19.3.1.3. Profitability by Market Segments 19.3.1.4. Sales Footprint 19.3.1.5. Strategy Overview 19.3.1.5.1. Marketing Strategy 19.3.1.5.2. Product Strategy 19.3.1.5.3. Channel Strategy 19.3.2. Lollicup USA Inc. 19.3.2.1. Overview 19.3.2.2. Product Portfolio 19.3.2.3. Profitability by Market Segments 19.3.2.4. Sales Footprint 19.3.2.5. Strategy Overview 19.3.2.5.1. Marketing Strategy 19.3.2.5.2. Product Strategy 19.3.2.5.3. Channel Strategy 19.3.3. Vegware Ltd. 19.3.3.1. Overview 19.3.3.2. Product Portfolio 19.3.3.3. Profitability by Market Segments 19.3.3.4. Sales Footprint 19.3.3.5. Strategy Overview 19.3.3.5.1. Marketing Strategy 19.3.3.5.2. Product Strategy 19.3.3.5.3. Channel Strategy 19.3.4. Dart Container Corporation 19.3.4.1. Overview 19.3.4.2. Product Portfolio 19.3.4.3. Profitability by Market Segments 19.3.4.4. Sales Footprint 19.3.4.5. Strategy Overview 19.3.4.5.1. Marketing Strategy 19.3.4.5.2. Product Strategy 19.3.4.5.3. Channel Strategy 19.3.5. Solia, Inc. 19.3.5.1. Overview 19.3.5.2. Product Portfolio 19.3.5.3. Profitability by Market Segments 19.3.5.4. Sales Footprint 19.3.5.5. Strategy Overview 19.3.5.5.1. Marketing Strategy 19.3.5.5.2. Product Strategy 19.3.5.5.3. Channel Strategy 19.3.6. Hefty 19.3.6.1. Overview 19.3.6.2. Product Portfolio 19.3.6.3. Profitability by Market Segments 19.3.6.4. Sales Footprint 19.3.6.5. Strategy Overview 19.3.6.5.1. Marketing Strategy 19.3.6.5.2. Product Strategy 19.3.6.5.3. Channel Strategy 19.3.7. Dixie Consumer Products LLC 19.3.7.1. Overview 19.3.7.2. Product Portfolio 19.3.7.3. Profitability by Market Segments 19.3.7.4. Sales Footprint 19.3.7.5. Strategy Overview 19.3.7.5.1. Marketing Strategy 19.3.7.5.2. Product Strategy 19.3.7.5.3. Channel Strategy 19.3.8. Duni AB 19.3.8.1. Overview 19.3.8.2. Product Portfolio 19.3.8.3. Profitability by Market Segments 19.3.8.4. Sales Footprint 19.3.8.5. Strategy Overview 19.3.8.5.1. Marketing Strategy 19.3.8.5.2. Product Strategy 19.3.8.5.3. Channel Strategy 19.3.9. Graphic Packaging International, LLC 19.3.9.1. Overview 19.3.9.2. Product Portfolio 19.3.9.3. Profitability by Market Segments 19.3.9.4. Sales Footprint 19.3.9.5. Strategy Overview 19.3.9.5.1. Marketing Strategy 19.3.9.5.2. Product Strategy 19.3.9.5.3. Channel Strategy 19.3.10. Pacovis AG 19.3.10.1. Overview 19.3.10.2. Product Portfolio 19.3.10.3. Profitability by Market Segments 19.3.10.4. Sales Footprint 19.3.10.5. Strategy Overview 19.3.10.5.1. Marketing Strategy 19.3.10.5.2. Product Strategy 19.3.10.5.3. Channel Strategy 19.3.11. Papstar GmbH 19.3.11.1. Overview 19.3.11.2. Product Portfolio 19.3.11.3. Profitability by Market Segments 19.3.11.4. Sales Footprint 19.3.11.5. Strategy Overview 19.3.11.5.1. Marketing Strategy 19.3.11.5.2. Product Strategy 19.3.11.5.3. Channel Strategy 19.3.12. Dispo International 19.3.12.1. Overview 19.3.12.2. Product Portfolio 19.3.12.3. Profitability by Market Segments 19.3.12.4. Sales Footprint 19.3.12.5. Strategy Overview 19.3.12.5.1. Marketing Strategy 19.3.12.5.2. Product Strategy 19.3.12.5.3. Channel Strategy 19.3.13. Genpak LLC 19.3.13.1. Overview 19.3.13.2. Product Portfolio 19.3.13.3. Profitability by Market Segments 19.3.13.4. Sales Footprint 19.3.13.5. Strategy Overview 19.3.13.5.1. Marketing Strategy 19.3.13.5.2. Product Strategy 19.3.13.5.3. Channel Strategy 19.3.14. Natural Tableware 19.3.14.1. Overview 19.3.14.2. Product Portfolio 19.3.14.3. Profitability by Market Segments 19.3.14.4. Sales Footprint 19.3.14.5. Strategy Overview 19.3.14.5.1. Marketing Strategy 19.3.14.5.2. Product Strategy 19.3.14.5.3. Channel Strategy 19.3.15. Eco-Products, Inc. 19.3.15.1. Overview 19.3.15.2. Product Portfolio 19.3.15.3. Profitability by Market Segments 19.3.15.4. Sales Footprint 19.3.15.5. Strategy Overview 19.3.15.5.1. Marketing Strategy 19.3.15.5.2. Product Strategy 19.3.15.5.3. Channel Strategy *The above list is indicative in nature and is subject to change during the course of research 20. Assumptions and Acronyms Used 21. Research Methodology
Let us know your requirement to get
100% FREE customization
List of Tables
Table 01: Global Market Value (US$ Mn) Analysis, by Material, 2014(H)-2030(F) Table 02: Global Market Value (US$ Mn) Analysis, by Material, 2014(H)-2030(F) Table 03: Global Market Volume (Mn Units) Analysis, by Material, 2014(H)-2030(F) Table 04: Global Market Volume (Mn Units) Analysis, by Material, 2014(H)-2030(F) Table 05: Global Market Value (US$ Mn) Analysis, by Product Type, 2014(H)-2030(F) Table 06: Global Market Volume (Mn Units) Analysis, by Product Type, 2014(H)-2030(F) Table 07: Global Market Value (US$ Mn) Analysis, by End Use, 2014(H)-2030(F) Table 08: Global Market Volume (Mn Units) Analysis, by End Use, 2014(H)-2030(F) Table 09: Global Market Value (US$ Mn) Analysis, by Region, 2014(H)-2030(F) Table 10: Global Market Volume (Mn Units) Analysis, by Region, 2014(H)-2030(F) Table 11: North America Market Value (US$ Mn) Analysis, by Material, 2014(H)-2030(F) Table 12: North America Market Value (US$ Mn) Analysis, by Material, 2014(H)-2030(F) Table 13: North America Market Volume (Mn Units) Analysis, by Material, 2014(H)-2030(F) Table 14: North America Market Volume (Mn Units) Analysis, by Material, 2014(H)-2030(F) Table 15: North America Market Value (US$ Mn) Analysis, by Product Type, 2014(H)-2030(F) Table 16: North America Market Volume (Mn Units) Analysis, by Product Type, 2014(H)-2030(F) Table 17: North America Market Value (US$ Mn) Analysis, by End Use, 2014(H)-2030(F) Table 18: North America Market Volume (Mn Units) Analysis, by End Use, 2014(H)-2030(F) Table 19: North America Market Value (US$ Mn) Analysis, by Region, 2014(H)-2030(F) Table 20: North America Market Volume (Mn Units) Analysis, by Region, 2014(H)-2030(F) Table 21: Latin America Market Value (US$ Mn) Analysis, by Material, 2014(H)-2030(F) Table 22: Latin America Market Value (US$ Mn) Analysis, by Material, 2014(H)-2030(F) Table 23: Latin America Market Volume (Mn Units) Analysis, by Material, 2014(H)-2030(F) Table 24: Latin America Market Volume (Mn Units) Analysis, by Material, 2014(H)-2030(F) Table 25: Latin America Market Value (US$ Mn) Analysis, by Product Type, 2014(H)-2030(F) Table 26: Latin America Market Volume (Mn Units) Analysis, by Product Type, 2014(H)-2030(F) Table 27: Latin America Market Value (US$ Mn) Analysis, by End Use, 2014(H)-2030(F) Table 28: Latin America Market Volume (Mn Units) Analysis, by End Use, 2014(H)-2027(F) Table 29: Latin America Market Value (US$ Mn) Analysis, by Region, 2014(H)-2030(F) Table 30: Latin America Market Volume (Mn Units) Analysis, by Region, 2014(H)-2030(F) Table 31: Europe Market Value (US$ Mn) Analysis, by Material, 2014(H)-2030(F) Table 32: Europe Market Value (US$ Mn) Analysis, by Material, 2014(H)-2030(F) Table 33: Europe Market Volume (Mn Units) Analysis, by Material, 2014(H)-2030(F) Table 34: Europe Market Volume (Mn Units) Analysis, by Material, 2014(H)-2030(F) Table 35: Europe Market Value (US$ Mn) Analysis, by Product Type, 2014(H)-2030(F) Table 36: Europe Market Volume (Mn Units) Analysis, by Product Type, 2014(H)-2030(F) Table 37: Europe Market Value (US$ Mn) Analysis, by End Use, 2014(H)-2030(F) Table 38: Europe Market Volume (Mn Units) Analysis, by End Use, 2014(H)-2030(F) Table 39: Europe Market Value (US$ Mn) Analysis, by Region, 2014(H)-2030(F) Table 40: Europe Market Volume (Mn Units) Analysis, by Region, 2014(H)-2030(F) Table 41: Asia Pacific Market Value (US$ Mn) Analysis, by Material, 2014(H)-2030(F) Table 42: Asia Pacific Market Value (US$ Mn) Analysis, by Material, 2014(H)-2030(F) Table 43: Asia Pacific Market Volume (Mn Units) Analysis, by Material, 2014(H)-2030(F) Table 44: Asia Pacific Market Volume (Mn Units) Analysis, by Material, 2014(H)-2030(F) Table 45: Asia Pacific Market Value (US$ Mn) Analysis, by Product Type, 2014(H)-2030(F) Table 46: Asia Pacific Market Volume (Mn Units) Analysis, by Product Type, 2014(H)-2030(F) Table 47: Asia Pacific Market Value (US$ Mn) Analysis, by End Use, 2014(H)-2030(F) Table 48: Asia Pacific Market Volume (Mn Units) Analysis, by End Use, 2014(H)-2030(F) Table 49: Asia Pacific Market Value (US$ Mn) Analysis, by Region, 2014(H)-2030(F) Table 50: Asia Pacific Market Volume (Mn Units) Analysis, by Region, 2014(H)-2030(F) Table 51: MEA Market Value (US$ Mn) Analysis, by Material, 2014(H)-2030(F) Table 52: MEA Market Value (US$ Mn) Analysis, by Material, 2014(H)-2030(F) Table 53: MEA Market Volume (Mn Units) Analysis, by Material, 2014(H)-2030(F) Table 54: MEA Market Volume (Mn Units) Analysis, by Material, 2014(H)-2030(F) Table 55: MEA Market Value (US$ Mn) Analysis, by Product Type, 2014(H)-2030(F) Table 56: MEA Market Volume (Mn Units) Analysis, by Product Type, 2014(H)-2030(F) Table 57: MEA Market Value (US$ Mn) Analysis, by End Use, 2014(H)-2030(F) Table 58: MEA Market Volume (Mn Units) Analysis, by End Use, 2014(H)-2030(F) Table 59: MEA Market Value (US$ Mn) Analysis, by Region, 2014(H)-2030(F) Table 60: MEA Market Volume (Mn Units) Analysis, by Region, 2014(H)-2030(F)
Find your sweet spots for generating winning opportunities in this market.
Talk to AnalystList of Charts
Figure 01: Global Market Share Analysis, By Material, 2022(E) & 2030(F) Figure 02: Global Market Attractiveness Analysis, By Material, 2022(E)-2030(F) Figure 03: Global Market Share Analysis, By Product Type, 2022(E) & 2030(F) Figure 04: Global Market Attractiveness Analysis, By Product Type, 2022(E)-2030(F) Figure 05: Global Market Share Analysis, By End Use, 2022(E) & 2030(F) Figure 06: Global Market Attractiveness Analysis, By End Use, 2022(E)-2030(F) Figure 07: Global Market Share Analysis, By Region, 2022(E) & 2030(F) Figure 08: Global Market Attractiveness Analysis, By Region, 2022(E)-2030(F) Figure 09: Global Regional Analysis, North America, 2022(E) Figure 10: Global Regional Analysis, Asia Pacific, 2022(E) Figure 11: Global Regional Analysis, Latin America 2022(E) – 2030(F) Figure 12: Global Regional Analysis, Latin America 2022(E) Figure 13 : North America Market Share Analysis by Material 2014H, 2022(E) & 2030(F) Figure 14: North America Market Value Analysis by Material, 2022(E) Figure 15: North America Market Attractiveness by Material 2022(E)-2030(F) Figure 16: North America Market Attractiveness by Product Type 2022(E)-2030(F) Figure 17: North America Market Share Analysis by Product Type 2014H, 2022(E) & 2030(F) Figure 18: North America Market Value Share by End Use 2022(E) Figure 19: North America Market Attractiveness by End Use 2022(E)-2030(F) Figure 20: North America Market Value Analysis by Country, 2022(E) Figure 21: North America Market Attractiveness by Country 2022(E)-2030(F) Figure 22: North America Market Revenue, Y-o-Y Growth by Country 2022 ( E)-2030(F) Figure 23 : Latin America Market Share Analysis by Material 2014H, 2022(E) & 2030(F) Figure 24: Latin America Market Value Analysis by Material, 2022(E) Figure 25: Latin America Market Attractiveness by Material 2022(E)-2030(F) Figure 26: Latin America Market Attractiveness by Product Type 2022(E)-2030(F) Figure 27: Latin America Market Share Analysis by Product Type 2014H, 2022(E) & 2030(F) Figure 28: Latin America Market Value Share by End Use 2022(E) Figure 29: Latin America Market Attractiveness by End Use 2022(E)-2030(F) Figure 30: Latin America Market Value Analysis by Country, 2022(E) Figure 31: Latin America Market Attractiveness by Country 2022(E)-2030(F) Figure 32: Latin America Market Revenue, Y-o-Y Growth by Country 2022 ( E)-2030(F) Figure 33 : Europe Market Share Analysis by Material 2014H, 2022(E) & 2030(F) Figure 34: Europe Market Value Analysis by Material, 2022(E) Figure 35: Europe Market Attractiveness by Material 2022(E)-2030(F) Figure 36: Europe Market Attractiveness by Product Type 2022(E)-2030(F) Figure 37: Europe Market Share Analysis by Product Type 2014H, 2022(E) & 2030(F) Figure 38: Europe Market Value Share by End Use 2022(E) Figure 39: Europe Market Attractiveness by End Use 2022(E)-2030(F) Figure 40: Europe Market Value Analysis by Country, 2022(E) Figure 41: Europe Market Attractiveness by Country 2022(E)-2030(F) Figure 42: Europe Market Revenue, Y-o-Y Growth by Country 2022 ( E)-2030(F) Figure 43 : Asia Pacific Market Share Analysis by Material 2014H, 2022(E) & 2030(F) Figure 44: Asia Pacific Market Value Analysis by Material, 2022(E) Figure 45: Asia Pacific Market Attractiveness by Material 2022(E)-2030(F) Figure 46: Asia Pacific Market Attractiveness by Product Type 2022(E)-2030(F) Figure 47: Asia Pacific Market Share Analysis by Product Type 2014H, 2022(E) & 2030(F) Figure 48: Asia Pacific Market Value Share by End Use 2022(E) Figure 49: Asia Pacific Market Attractiveness by End Use 2022(E)-2030(F) Figure 50: Asia Pacific Market Value Analysis by Country, 2022(E) Figure 51: Asia Pacific Market Attractiveness by Country 2022(E)-2030(F) Figure 52: Asia Pacific Market Revenue, Y-o-Y Growth by Country 2022 ( E)-2030(F) Figure 53 : MEA Market Share Analysis by Material 2014H, 2022(E) & 2030(F) Figure 54: MEA Market Value Analysis by Material, 2022(E) Figure 55: MEA Market Attractiveness by Material 2022(E)-2030(F) Figure 56: MEA Market Attractiveness by Product Type 2022(E)-2030(F) Figure 57: MEA Market Share Analysis by Product Type 2014H, 2022(E) & 2030(F) Figure 58: MEA Market Value Share by End Use 2022(E) Figure 59: MEA Market Attractiveness by End Use 2022(E)-2030(F) Figure 60: MEA Market Value Analysis by Country, 2022(E) Figure 61: MEA Market Attractiveness by Country 2022(E)-2030(F) Figure 62: MEA Market Revenue, Y-o-Y Growth by Country 2022 ( E)-2030(F)
Need specific information?
Request CustomizationExplore Packaging Insights
View Reports