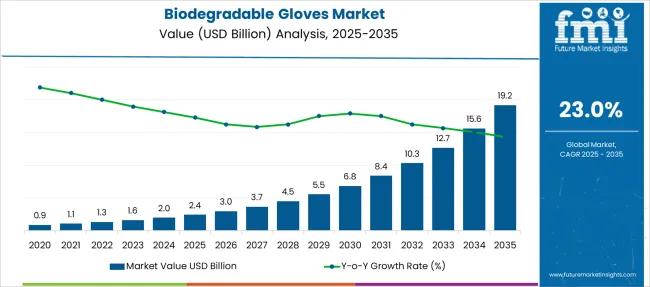
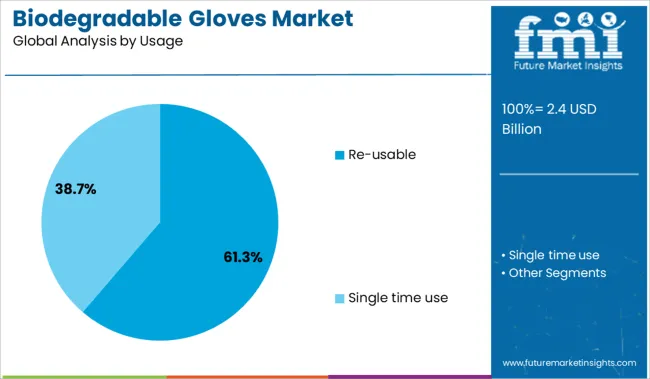
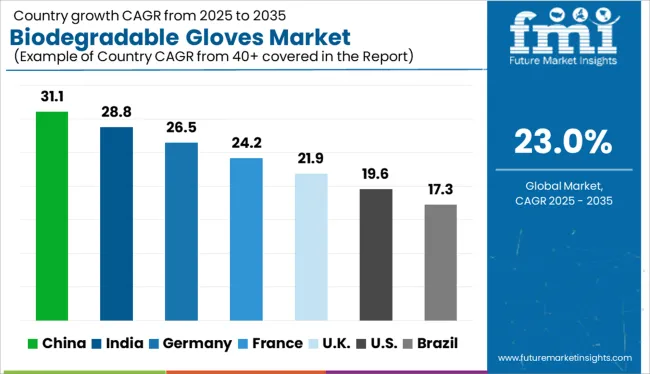
The global Biodegradable Gloves Market is expected to reach USD 1.3 Billion in 2022, expanding at a CAGR of 23.0% over the forecast period. By 2032, the total biodegradable gloves market size will reach USD 10.2 Billion. According to a recent study by Future Market Insights (FMI), single-time use gloves are leading the market with a share of about 93.3% in 2021.
Market Outlook:
Data Points | Market Insights |
---|---|
Biodegradable Gloves Market Value (2021) | USD 1.1 Billion |
Estimated Market Size (2022) | USD 1.3 Billion |
Projected Market Valuation (2032) | USD 10.2 Billion |
Value-based CAGR (2022 to 2032) | 23.0% |
Market Share of Top 5 Countries | 54.7% |
Rubber gloves are among the most widely manufactured disposable products worldwide. Because latex products are designed as single-use products, mass production of these products results in increased volumes of rubber solid waste disposal every year.
This is related to the complexity of decomposing rubber/latex-based products in the natural environment. As a result, combining a rubber system with biomaterials is an alternative. Bio-Add and other novel green additives are thus used in the composition of non-rubber latex gloves to speed up the process of biodegradation.
The market value for biodegradable gloves represented approximately 7.8% of the overall USD 14.1 Billion global medical gloves market in 2021.
The sales of biodegradable gloves grew at a CAGR of 20.5% from 2017 to 2021, owing to the advent of the COVID-19 pandemic.
The demand for nitrile gloves is expected to grow as these gloves do not affect human health, and are environment friendly. This is a key factor driving the production of biodegradable nitrile gloves.
Several healthcare facilities utilize latex-free gloves, owing to their affordability. The use of nitrile disposable gloves across the medical sector will grow in the forthcoming years owing to minimal drawbacks and positive features of the nitrile material.
The development of novel technologies to cater to the demand for high-quality gloves at low prices will drive the overall biodegradable gloves market.
Individuals may choose to continue wearing gloves even after the COVID-19 outbreak due to increased understanding of the necessity of gloves as a consequence of the pandemic.
This scenario exacerbated the issue of rubber solid waste management; consequently, the development of biodegradable gloves may be a viable solution. However, before commercialisation, it is critical to investigate the shelf life of biodegradable gloves.
Malaysia is the world's largest maker for rubber gloves, producing volumes of over 200 billion each year. Malaysia exported roughly 182 billion gloves in 2019, with the Malaysian Rubber Glove Manufacturers Association (MARGMA) estimating 240 billion pieces in 2020 due to the ongoing COVID-19 global pandemic.
It will substantially contribute to waste disposal issues, which is expected to boost the supply of single-use personal protective equipment. Biodegradation is thus a sustainable alternative which will aid in the waste disposal of these consumable products.
Demand for infection prevention and control utilities is projected remain high demand over the forecast period as the prevalence of epidemic diseases rises. Nitrile gloves are largely utilised in the medical field to protect caregivers and patients against infections. Nitrile gloves have higher strength and durability, and provide protection against blood borne diseases.
Thus, owing to the aforementioned factors, the global biodegradable gloves market is expected to grow at a CAGR of 23.0% during the forecast period.
Increasing demand for nitrile material gloves is expected to create opportunities for growth in the market over the forecast period amid growing concerns regarding the prevalence of latex allergy across the globe.
With stringent regulations imposed by the FDA and certain European regulatory authorities on powdered gloves, the demand for alternatives, such as biodegradable gloves and powder-free nitrile gloves is increasing worldwide.
Strict worker safety rules, as well as a high focus on hygiene across various end-use industries, are also driving up demand for nitrile gloves worldwide. These gloves have a stronger chemical and puncture resistance than latex gloves, which is driving demand in a wide range of industries.
During the forecast period, this is expected to provide lucrative opportunities for growth in the global biodegradable gloves market.
Medical gloves play an important role in keeping health care personnel, patients, and anyone in proximity safe.
However, the US Food and Drug Administration's Centre for Devices and Radiological Health has issued a ban on absorbable powder gloves, powdered surgeon gloves, and powdered patient examination gloves, citing a significant risk of injury and illness that cannot be eliminated or corrected by changing the label.
Granulomas, inflammation, and respiratory allergic reactions are some of the risks linked with using powdered gloves. This factor acts as a major impeding factor in the growth of the biodegradable gloves market.
Moreover, growth in the market is likely to be affected by the production costs and shelf-life assessment of biodegradable gloves. Numerous investigations have been published, with most studies focusing on different types of biodegradable fillers and distinct strategies towards enhancing non-rubber latex film compatibility, mechanical strength, and biodegradability.
However, little research has been done on the shelf life of biodegradable products. This is because of the high cost of measures employed for the assessment of the material integrity of biodegradable gloves. These factors are expected to limit sales in the market over the forecast period.
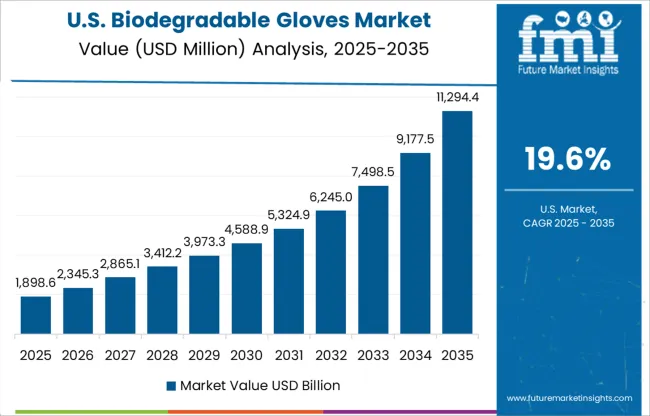
Surging Demand for Biodegradable Nitrile Gloves in the USA Will Boost Sales
The USA dominated the North America market, holding about 89.1% of the total market share in 2021. As per the report, the trend is expected to continue over the forecast period.
Expansion of the pharmaceutical sector and government laws prohibiting powdered and latex gloves in the USA will boost the market. Furthermore, the market is likely to benefit from growth in the food processing industry as well as the hygiene and personal care sectors.
Furthermore, the FDA recently imposed a ban on powdered medical gloves due to their negative side effects. Due to the powder, powdered medical gloves are easier to wear, however instead of aiding people with allergies, they have a negative impact. This is a prime driver for the design and production of biodegradable gloves within the country.
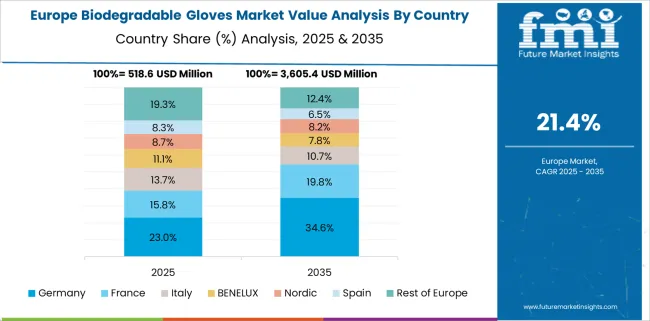
Rising Adoption of Biodegradable Disposable Gloves in Germany Will Spur Demand
Germany is set to exhibit grow at a CAGR of 18.3% in the European biodegradable gloves market during the forecast period. Germany is becoming an increasingly popular medical tourist hotspot. The country's attractiveness for healthcare stems from its high-quality care, strict ethical requirements, and quick access to specialists.
Additionally, in Germany, the cost-to-quality ratio of medical care is apparently low. It is not the cheapest medical destination in the world, but it is far less expensive than other industrialised nations such as the USA
Contributions fund the country's healthcare industry, guaranteeing that all residents have access to free healthcare. As a result of these advances in the medical industry, demand for disposable medical gloves is increasing, thereby fueling the growth in the market.
Expansion of the Healthcare Sector in Malaysia Will Drive Sales of Eco-friendly Disposable Gloves
Malaysia held approximately 17.8% of the South Asia share in 2021, and sales are projected to grow at a 18.5% CAGR during the forecast period. Malaysian rubber glove makers committed to contributing 18 million gloves to Wuhan city in early February 2020. The healthcare industry has been generating steady demand for protective medical supplies.
Medical gloves from China are now on the USD 200 billion list for Chinese goods, subjected to a 10% import tariff, which will hamstring rubber glove makers in China. To meet rising global demand, Malaysia's biggest producers have either boosted capacity or are gradually raising capacity over the next 1 to 3 years.
Top Glove, Hartalega, Kossan, CarePlus, and Riverstone are among Malaysia's top five companies, with a top growth streak in line with expanding global demand for gloves.
Demand for Plain Gloves to Remain High
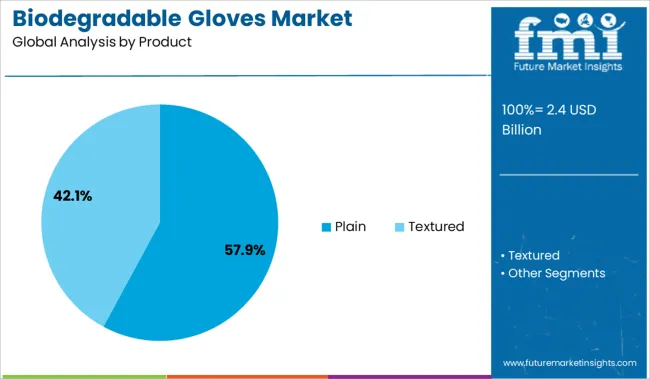
Based on product type, sales of plain gloves are expected to increase at a 22% CAGR over the forecast period, accounting for about 75.1% of the total market share in 2032. Plain gloves, such as biodegradable nitrile gloves are enhanced for higher affinity to biodegradability with smooth and enhanced grip, as well as durability.
Adoption of Single Time Use Biodegradable Gloves Will Gain Traction
In terms of usage, the single time use gloves segment is projected to account for 93.1% of the total market share in 2032. With high demand for protective medical equipment, as well as rising cases of infectious diseases, the cost associated with the bulk purchase of single-use gloves is relatively lower than the reusable gloves, and are durable and cost-friendly.
Sales of Biodegradable Gloves Across Hospitals Will Continue Rising
By end use, the hospitals segment held 52.3% of the total market share in 2021. The growing prevalence of chronic and infectious diseases, as well as the associated increasing volumes of surgical procedures are expected to drive sales in this segment over the forecast period.
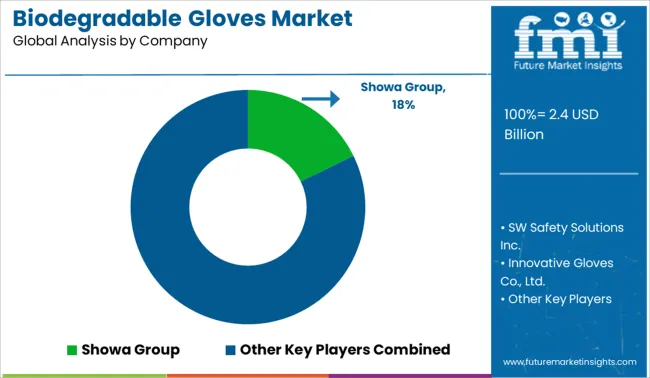
With various competitors in the biodegradable gloves market, the overall market is highly fragmented. To meet consumer demand and expand their customer base, leading companies are implementing methods such as mergers and acquisitions, partnerships and collaborations, and new product launches. For instance:
Attributes | Details |
---|---|
Estimated Market Size (2022) | USD 1.3 Billion |
Projected Market Valuation (2032) | USD 10.2 Billion |
Value-based CAGR (2022 to 2032) | 23% |
Forecast Period | 2017 to 2021 |
Historical Data Available for | 2022 to 2032 |
Market Analysis | USD Billion for Value |
Key Regions Covered | North America; Latin America; Europe; South Asia; East Asia; Oceania; and Middle East & Africa |
Key Countries Covered | The USA, Canada, Brazil, Mexico, Argentina, The UK, Germany, Italy, Russia, Spain, France, BENELUX, India, Thailand, Indonesia, Malaysia, Japan, China, South Korea, Australia, New Zealand, Turkey, GCC, and South Africa |
Key Market Segments Covered | Product, Usage, Size, End User, and Region |
Key Companies Profiled | SHOWA GROUP; SW Safety Solutions Inc.; Innovative Gloves Co., Ltd.; Top Glove Corporation Bhd; Hourglass International, Inc.; Biogone; Worldchamp (Huizhou) Plastics Products Co., Ltd; SunEco Tech Ventures Private Limited; Traffi | Hand Protection Specialists; St. Marys Rubbers Pvt. Ltd.; INSINC Products Ltd |
Table 1: Global Biodegradable Gloves Market Value (US$ Mn) Forecast by Region, 2017-2032
Table 2: Global Biodegradable Gloves Market Value (US$ Mn) Forecast by Product, 2017-2032
Table 3: Global Biodegradable Gloves Market Value (US$ Mn) Forecast by Size, 2017-2032
Table 4: Global Biodegradable Gloves Market Value (US$ Mn) Forecast by Usage, 2017-2032
Table 5: Global Biodegradable Gloves Market Value (US$ Mn) Forecast by End User, 2017-2032
Table 6: North America Biodegradable Gloves Market Value (US$ Mn) Forecast by Country, 2017-2032
Table 7: North America Biodegradable Gloves Market Value (US$ Mn) Forecast by Product, 2017-2032
Table 8: North America Biodegradable Gloves Market Value (US$ Mn) Forecast by Size, 2017-2032
Table 9: North America Biodegradable Gloves Market Value (US$ Mn) Forecast by Usage, 2017-2032
Table 10: North America Biodegradable Gloves Market Value (US$ Mn) Forecast by End User, 2017-2032
Table 11: Latin America Biodegradable Gloves Market Value (US$ Mn) Forecast by Country, 2017-2032
Table 12: Latin America Biodegradable Gloves Market Value (US$ Mn) Forecast by Product, 2017-2032
Table 13: Latin America Biodegradable Gloves Market Value (US$ Mn) Forecast by Size, 2017-2032
Table 14: Latin America Biodegradable Gloves Market Value (US$ Mn) Forecast by Usage, 2017-2032
Table 15: Latin America Biodegradable Gloves Market Value (US$ Mn) Forecast by End User, 2017-2032
Table 16: Europe Biodegradable Gloves Market Value (US$ Mn) Forecast by Country, 2017-2032
Table 17: Europe Biodegradable Gloves Market Value (US$ Mn) Forecast by Product, 2017-2032
Table 18: Europe Biodegradable Gloves Market Value (US$ Mn) Forecast by Size, 2017-2032
Table 19: Europe Biodegradable Gloves Market Value (US$ Mn) Forecast by Usage, 2017-2032
Table 20: Europe Biodegradable Gloves Market Value (US$ Mn) Forecast by End User, 2017-2032
Table 21: East Asia Biodegradable Gloves Market Value (US$ Mn) Forecast by Country, 2017-2032
Table 22: East Asia Biodegradable Gloves Market Value (US$ Mn) Forecast by Product, 2017-2032
Table 23: East Asia Biodegradable Gloves Market Value (US$ Mn) Forecast by Size, 2017-2032
Table 24: East Asia Biodegradable Gloves Market Value (US$ Mn) Forecast by Usage, 2017-2032
Table 25: East Asia Biodegradable Gloves Market Value (US$ Mn) Forecast by End User, 2017-2032
Table 26: South Asia Biodegradable Gloves Market Value (US$ Mn) Forecast by Country, 2017-2032
Table 27: South Asia Biodegradable Gloves Market Value (US$ Mn) Forecast by Product, 2017-2032
Table 28: South Asia Biodegradable Gloves Market Value (US$ Mn) Forecast by Size, 2017-2032
Table 29: South Asia Biodegradable Gloves Market Value (US$ Mn) Forecast by Usage, 2017-2032
Table 30: South Asia Biodegradable Gloves Market Value (US$ Mn) Forecast by End User, 2017-2032
Table 31: Oceania Biodegradable Gloves Market Value (US$ Mn) Forecast by Country, 2017-2032
Table 32: Oceania Biodegradable Gloves Market Value (US$ Mn) Forecast by Product, 2017-2032
Table 33: Oceania Biodegradable Gloves Market Value (US$ Mn) Forecast by Size, 2017-2032
Table 34: Oceania Biodegradable Gloves Market Value (US$ Mn) Forecast by Usage, 2017-2032
Table 35: Oceania Biodegradable Gloves Market Value (US$ Mn) Forecast by End User, 2017-2032
Table 36: MEA Biodegradable Gloves Market Value (US$ Mn) Forecast by Country, 2017-2032
Table 37: MEA Biodegradable Gloves Market Value (US$ Mn) Forecast by Product, 2017-2032
Table 38: MEA Biodegradable Gloves Market Value (US$ Mn) Forecast by Size, 2017-2032
Table 39: MEA Biodegradable Gloves Market Value (US$ Mn) Forecast by Usage, 2017-2032
Table 40: MEA Biodegradable Gloves Market Value (US$ Mn) Forecast by End User, 2017-2032
Figure 1: Global Biodegradable Gloves Market Value (US$ Mn) by Product, 2022-2032
Figure 2: Global Biodegradable Gloves Market Value (US$ Mn) by Size, 2022-2032
Figure 3: Global Biodegradable Gloves Market Value (US$ Mn) by Usage, 2022-2032
Figure 4: Global Biodegradable Gloves Market Value (US$ Mn) by End User, 2022-2032
Figure 5: Global Biodegradable Gloves Market Value (US$ Mn) by Region, 2022-2032
Figure 6: Global Biodegradable Gloves Market Value (US$ Mn) Analysis by Region, 2017-2032
Figure 7: Global Biodegradable Gloves Market Value Share (%) and BPS Analysis by Region, 2022-2032
Figure 8: Global Biodegradable Gloves Market Y-o-Y Growth (%) Projections by Region, 2022-2032
Figure 9: Global Biodegradable Gloves Market Value (US$ Mn) Analysis by Product, 2017-2032
Figure 10: Global Biodegradable Gloves Market Value Share (%) and BPS Analysis by Product, 2022-2032
Figure 11: Global Biodegradable Gloves Market Y-o-Y Growth (%) Projections by Product, 2022-2032
Figure 12: Global Biodegradable Gloves Market Value (US$ Mn) Analysis by Size, 2017-2032
Figure 13: Global Biodegradable Gloves Market Value Share (%) and BPS Analysis by Size, 2022-2032
Figure 14: Global Biodegradable Gloves Market Y-o-Y Growth (%) Projections by Size, 2022-2032
Figure 15: Global Biodegradable Gloves Market Value (US$ Mn) Analysis by Usage, 2017-2032
Figure 16: Global Biodegradable Gloves Market Value Share (%) and BPS Analysis by Usage, 2022-2032
Figure 17: Global Biodegradable Gloves Market Y-o-Y Growth (%) Projections by Usage, 2022-2032
Figure 18: Global Biodegradable Gloves Market Value (US$ Mn) Analysis by End User, 2017-2032
Figure 19: Global Biodegradable Gloves Market Value Share (%) and BPS Analysis by End User, 2022-2032
Figure 20: Global Biodegradable Gloves Market Y-o-Y Growth (%) Projections by End User, 2022-2032
Figure 21: Global Biodegradable Gloves Market Attractiveness by Product, 2022-2032
Figure 22: Global Biodegradable Gloves Market Attractiveness by Size, 2022-2032
Figure 23: Global Biodegradable Gloves Market Attractiveness by Usage, 2022-2032
Figure 24: Global Biodegradable Gloves Market Attractiveness by End User, 2022-2032
Figure 25: Global Biodegradable Gloves Market Attractiveness by Region, 2022-2032
Figure 26: North America Biodegradable Gloves Market Value (US$ Mn) by Product, 2022-2032
Figure 27: North America Biodegradable Gloves Market Value (US$ Mn) by Size, 2022-2032
Figure 28: North America Biodegradable Gloves Market Value (US$ Mn) by Usage, 2022-2032
Figure 29: North America Biodegradable Gloves Market Value (US$ Mn) by End User, 2022-2032
Figure 30: North America Biodegradable Gloves Market Value (US$ Mn) by Country, 2022-2032
Figure 31: North America Biodegradable Gloves Market Value (US$ Mn) Analysis by Country, 2017-2032
Figure 32: North America Biodegradable Gloves Market Value Share (%) and BPS Analysis by Country, 2022-2032
Figure 33: North America Biodegradable Gloves Market Y-o-Y Growth (%) Projections by Country, 2022-2032
Figure 34: North America Biodegradable Gloves Market Value (US$ Mn) Analysis by Product, 2017-2032
Figure 35: North America Biodegradable Gloves Market Value Share (%) and BPS Analysis by Product, 2022-2032
Figure 36: North America Biodegradable Gloves Market Y-o-Y Growth (%) Projections by Product, 2022-2032
Figure 37: North America Biodegradable Gloves Market Value (US$ Mn) Analysis by Size, 2017-2032
Figure 38: North America Biodegradable Gloves Market Value Share (%) and BPS Analysis by Size, 2022-2032
Figure 39: North America Biodegradable Gloves Market Y-o-Y Growth (%) Projections by Size, 2022-2032
Figure 40: North America Biodegradable Gloves Market Value (US$ Mn) Analysis by Usage, 2017-2032
Figure 41: North America Biodegradable Gloves Market Value Share (%) and BPS Analysis by Usage, 2022-2032
Figure 42: North America Biodegradable Gloves Market Y-o-Y Growth (%) Projections by End User, 2022-2032
Figure 43: North America Biodegradable Gloves Market Value (US$ Mn) Analysis by End User, 2017-2032
Figure 44: North America Biodegradable Gloves Market Value Share (%) and BPS Analysis by End User, 2022-2032
Figure 45: North America Biodegradable Gloves Market Y-o-Y Growth (%) Projections by End User, 2022-2032
Figure 46: North America Biodegradable Gloves Market Attractiveness by Product, 2022-2032
Figure 47: North America Biodegradable Gloves Market Attractiveness by Size, 2022-2032
Figure 48: North America Biodegradable Gloves Market Attractiveness by Usage, 2022-2032
Figure 49: North America Biodegradable Gloves Market Attractiveness by End User, 2022-2032
Figure 50: North America Biodegradable Gloves Market Attractiveness by Country, 2022-2032
Figure 51: Latin America Biodegradable Gloves Market Value (US$ Mn) by Product, 2022-2032
Figure 52: Latin America Biodegradable Gloves Market Value (US$ Mn) by Size, 2022-2032
Figure 53: Latin America Biodegradable Gloves Market Value (US$ Mn) by Usage, 2022-2032
Figure 54: Latin America Biodegradable Gloves Market Value (US$ Mn) by End User, 2022-2032
Figure 55: Latin America Biodegradable Gloves Market Value (US$ Mn) by Country, 2022-2032
Figure 56: Latin America Biodegradable Gloves Market Value (US$ Mn) Analysis by Country, 2017-2032
Figure 57: Latin America Biodegradable Gloves Market Value Share (%) and BPS Analysis by Country, 2022-2032
Figure 58: Latin America Biodegradable Gloves Market Y-o-Y Growth (%) Projections by Country, 2022-2032
Figure 59: Latin America Biodegradable Gloves Market Value (US$ Mn) Analysis by Product, 2017-2032
Figure 60: Latin America Biodegradable Gloves Market Value Share (%) and BPS Analysis by Product, 2022-2032
Figure 61: Latin America Biodegradable Gloves Market Y-o-Y Growth (%) Projections by Product, 2022-2032
Figure 62: Latin America Biodegradable Gloves Market Value (US$ Mn) Analysis by Size, 2017-2032
Figure 63: Latin America Biodegradable Gloves Market Value Share (%) and BPS Analysis by Size, 2022-2032
Figure 64: Latin America Biodegradable Gloves Market Y-o-Y Growth (%) Projections by Size, 2022-2032
Figure 65: Latin America Biodegradable Gloves Market Value (US$ Mn) Analysis by Usage, 2017-2032
Figure 66: Latin America Biodegradable Gloves Market Value Share (%) and BPS Analysis by Usage, 2022-2032
Figure 67: Latin America Biodegradable Gloves Market Y-o-Y Growth (%) Projections by Usage, 2022-2032
Figure 68: Latin America Biodegradable Gloves Market Value (US$ Mn) Analysis by End User, 2017-2032
Figure 69: Latin America Biodegradable Gloves Market Value Share (%) and BPS Analysis by End User, 2022-2032
Figure 70: Latin America Biodegradable Gloves Market Y-o-Y Growth (%) Projections by End User, 2022-2032
Figure 71: Latin America Biodegradable Gloves Market Attractiveness by Product, 2022-2032
Figure 72: Latin America Biodegradable Gloves Market Attractiveness by Size, 2022-2032
Figure 73: Latin America Biodegradable Gloves Market Attractiveness by Usage, 2022-2032
Figure 74: Latin America Biodegradable Gloves Market Attractiveness by End User, 2022-2032
Figure 75: Latin America Biodegradable Gloves Market Attractiveness by Country, 2022-2032
Figure 76: Europe Biodegradable Gloves Market Value (US$ Mn) by Product, 2022-2032
Figure 77: Europe Biodegradable Gloves Market Value (US$ Mn) by Size, 2022-2032
Figure 78: Europe Biodegradable Gloves Market Value (US$ Mn) by Usage, 2022-2032
Figure 79: Europe Biodegradable Gloves Market Value (US$ Mn) by End User, 2022-2032
Figure 80: Europe Biodegradable Gloves Market Value (US$ Mn) by Country, 2022-2032
Figure 81: Europe Biodegradable Gloves Market Value (US$ Mn) Analysis by Country, 2017-2032
Figure 82: Europe Biodegradable Gloves Market Value Share (%) and BPS Analysis by Country, 2022-2032
Figure 83: Europe Biodegradable Gloves Market Y-o-Y Growth (%) Projections by Country, 2022-2032
Figure 84: Europe Biodegradable Gloves Market Value (US$ Mn) Analysis by Product, 2017-2032
Figure 85: Europe Biodegradable Gloves Market Value Share (%) and BPS Analysis by Product, 2022-2032
Figure 86: Europe Biodegradable Gloves Market Y-o-Y Growth (%) Projections by Product, 2022-2032
Figure 87: Europe Biodegradable Gloves Market Value (US$ Mn) Analysis by Size, 2017-2032
Figure 88: Europe Biodegradable Gloves Market Value Share (%) and BPS Analysis by Size, 2022-2032
Figure 89: Europe Biodegradable Gloves Market Y-o-Y Growth (%) Projections by Size, 2022-2032
Figure 90: Europe Biodegradable Gloves Market Value (US$ Mn) Analysis by Usage, 2017-2032
Figure 91: Europe Biodegradable Gloves Market Value Share (%) and BPS Analysis by Usage, 2022-2032
Figure 92: Europe Biodegradable Gloves Market Y-o-Y Growth (%) Projections by Usage, 2022-2032
Figure 93: Europe Biodegradable Gloves Market Value (US$ Mn) Analysis by End User, 2017-2032
Figure 94: Europe Biodegradable Gloves Market Value Share (%) and BPS Analysis by End User, 2022-2032
Figure 95: Europe Biodegradable Gloves Market Y-o-Y Growth (%) Projections by End User, 2022-2032
Figure 96: Europe Biodegradable Gloves Market Attractiveness by Product, 2022-2032
Figure 97: Europe Biodegradable Gloves Market Attractiveness by Size, 2022-2032
Figure 98: Europe Biodegradable Gloves Market Attractiveness by Usage, 2022-2032
Figure 99: Europe Biodegradable Gloves Market Attractiveness by End User, 2022-2032
Figure 100: Europe Biodegradable Gloves Market Attractiveness by Country, 2022-2032
Figure 101: East Asia Biodegradable Gloves Market Value (US$ Mn) by Product, 2022-2032
Figure 102: East Asia Biodegradable Gloves Market Value (US$ Mn) by Size, 2022-2032
Figure 103: East Asia Biodegradable Gloves Market Value (US$ Mn) by Usage, 2022-2032
Figure 104: East Asia Biodegradable Gloves Market Value (US$ Mn) by End User, 2022-2032
Figure 105: East Asia Biodegradable Gloves Market Value (US$ Mn) by Country, 2022-2032
Figure 106: East Asia Biodegradable Gloves Market Value (US$ Mn) Analysis by Country, 2017-2032
Figure 107: East Asia Biodegradable Gloves Market Value Share (%) and BPS Analysis by Country, 2022-2032
Figure 108: East Asia Biodegradable Gloves Market Y-o-Y Growth (%) Projections by Country, 2022-2032
Figure 109: East Asia Biodegradable Gloves Market Value (US$ Mn) Analysis by Product, 2017-2032
Figure 110: East Asia Biodegradable Gloves Market Value Share (%) and BPS Analysis by Product, 2022-2032
Figure 111: East Asia Biodegradable Gloves Market Y-o-Y Growth (%) Projections by Product, 2022-2032
Figure 112: East Asia Biodegradable Gloves Market Value (US$ Mn) Analysis by Size, 2017-2032
Figure 113: East Asia Biodegradable Gloves Market Value Share (%) and BPS Analysis by Size, 2022-2032
Figure 114: East Asia Biodegradable Gloves Market Y-o-Y Growth (%) Projections by Size, 2022-2032
Figure 115: East Asia Biodegradable Gloves Market Value (US$ Mn) Analysis by Usage, 2017-2032
Figure 116: East Asia Biodegradable Gloves Market Value Share (%) and BPS Analysis by Usage, 2022-2032
Figure 117: East Asia Biodegradable Gloves Market Y-o-Y Growth (%) Projections by Usage, 2022-2032
Figure 118: East Asia Biodegradable Gloves Market Value (US$ Mn) Analysis by End User, 2017-2032
Figure 119: East Asia Biodegradable Gloves Market Value Share (%) and BPS Analysis by End User, 2022-2032
Figure 120: East Asia Biodegradable Gloves Market Y-o-Y Growth (%) Projections by End User, 2022-2032
Figure 121: East Asia Biodegradable Gloves Market Attractiveness by Product, 2022-2032
Figure 122: East Asia Biodegradable Gloves Market Attractiveness by Size, 2022-2032
Figure 123: East Asia Biodegradable Gloves Market Attractiveness by Usage, 2022-2032
Figure 124: East Asia Biodegradable Gloves Market Attractiveness by End user, 2022-2032
Figure 125: East Asia Biodegradable Gloves Market Attractiveness by Country, 2022-2032
Figure 126: South Asia Biodegradable Gloves Market Value (US$ Mn) by Product, 2022-2032
Figure 127: South Asia Biodegradable Gloves Market Value (US$ Mn) by Size, 2022-2032
Figure 128: South Asia Biodegradable Gloves Market Value (US$ Mn) by Usage, 2022-2032
Figure 129: South Asia Biodegradable Gloves Market Value (US$ Mn) by End User, 2022-2032
Figure 130: South Asia Biodegradable Gloves Market Value (US$ Mn) by Country, 2022-2032
Figure 131: South Asia Biodegradable Gloves Market Value (US$ Mn) Analysis by Country, 2017-2032
Figure 132: South Asia Biodegradable Gloves Market Value Share (%) and BPS Analysis by Country, 2022-2032
Figure 133: South Asia Biodegradable Gloves Market Y-o-Y Growth (%) Projections by Country, 2022-2032
Figure 134: South Asia Biodegradable Gloves Market Value (US$ Mn) Analysis by Product, 2017-2032
Figure 135: South Asia Biodegradable Gloves Market Value Share (%) and BPS Analysis by Product, 2022-2032
Figure 136: South Asia Biodegradable Gloves Market Y-o-Y Growth (%) Projections by Product, 2022-2032
Figure 137: South Asia Biodegradable Gloves Market Value (US$ Mn) Analysis by Size, 2017-2032
Figure 138: South Asia Biodegradable Gloves Market Value Share (%) and BPS Analysis by Size, 2022-2032
Figure 139: South Asia Biodegradable Gloves Market Y-o-Y Growth (%) Projections by Size, 2022-2032
Figure 140: South Asia Biodegradable Gloves Market Value (US$ Mn) Analysis by Usage, 2017-2032
Figure 141: South Asia Biodegradable Gloves Market Value Share (%) and BPS Analysis by Usage, 2022-2032
Figure 142: South Asia Biodegradable Gloves Market Y-o-Y Growth (%) Projections by Usage, 2022-2032
Figure 143: South Asia Biodegradable Gloves Market Value (US$ Mn) Analysis by End User, 2017-2032
Figure 144: South Asia Biodegradable Gloves Market Value Share (%) and BPS Analysis by End User, 2022-2032
Figure 145: South Asia Biodegradable Gloves Market Y-o-Y Growth (%) Projections by End User, 2022-2032
Figure 146: South Asia Biodegradable Gloves Market Attractiveness by Product, 2022-2032
Figure 147: South Asia Biodegradable Gloves Market Attractiveness by Size, 2022-2032
Figure 148: South Asia Biodegradable Gloves Market Attractiveness by Usage, 2022-2032
Figure 149: South Asia Biodegradable Gloves Market Attractiveness by End User, 2022-2032
Figure 150: South Asia Biodegradable Gloves Market Attractiveness by Country, 2022-2032
Figure 151: Oceania Biodegradable Gloves Market Value (US$ Mn) by Product, 2022-2032
Figure 152: Oceania Biodegradable Gloves Market Value (US$ Mn) by Size, 2022-2032
Figure 153: Oceania Biodegradable Gloves Market Value (US$ Mn) by Usage, 2022-2032
Figure 154: Oceania Biodegradable Gloves Market Value (US$ Mn) by End User, 2022-2032
Figure 155: Oceania Biodegradable Gloves Market Value (US$ Mn) by Country, 2022-2032
Figure 156: Oceania Biodegradable Gloves Market Value (US$ Mn) Analysis by Country, 2017-2032
Figure 157: Oceania Biodegradable Gloves Market Value Share (%) and BPS Analysis by Country, 2022-2032
Figure 158: Oceania Biodegradable Gloves Market Y-o-Y Growth (%) Projections by Country, 2022-2032
Figure 159: Oceania Biodegradable Gloves Market Value (US$ Mn) Analysis by Product, 2017-2032
Figure 160: Oceania Biodegradable Gloves Market Value Share (%) and BPS Analysis by Product, 2022-2032
Figure 161: Oceania Biodegradable Gloves Market Y-o-Y Growth (%) Projections by Product, 2022-2032
Figure 162: Oceania Biodegradable Gloves Market Value (US$ Mn) Analysis by Size, 2017-2032
Figure 163: Oceania Biodegradable Gloves Market Value Share (%) and BPS Analysis by Size, 2022-2032
Figure 164: Oceania Biodegradable Gloves Market Y-o-Y Growth (%) Projections by Size, 2022-2032
Figure 165: Oceania Biodegradable Gloves Market Value (US$ Mn) Analysis by Usage, 2017-2032
Figure 166: Oceania Biodegradable Gloves Market Value Share (%) and BPS Analysis by Usage, 2022-2032
Figure 167: Oceania Biodegradable Gloves Market Y-o-Y Growth (%) Projections by Usage, 2022-2032
Figure 168: Oceania Biodegradable Gloves Market Value (US$ Mn) Analysis by End User, 2017-2032
Figure 169: Oceania Biodegradable Gloves Market Value Share (%) and BPS Analysis by End User, 2022-2032
Figure 170: Oceania Biodegradable Gloves Market Y-o-Y Growth (%) Projections by End User, 2022-2032
Figure 171: Oceania Biodegradable Gloves Market Attractiveness by Product, 2022-2032
Figure 172: Oceania Biodegradable Gloves Market Attractiveness by Size, 2022-2032
Figure 173: Oceania Biodegradable Gloves Market Attractiveness by Usage, 2022-2032
Figure 174: Oceania Biodegradable Gloves Market Attractiveness by End User, 2022-2032
Figure 175: Oceania Biodegradable Gloves Market Attractiveness by Country, 2022-2032
Figure 176: MEA Biodegradable Gloves Market Value (US$ Mn) by Product, 2022-2032
Figure 177: MEA Biodegradable Gloves Market Value (US$ Mn) by Size, 2022-2032
Figure 178: MEA Biodegradable Gloves Market Value (US$ Mn) by Usage, 2022-2032
Figure 179: MEA Biodegradable Gloves Market Value (US$ Mn) by End User, 2022-2032
Figure 180: MEA Biodegradable Gloves Market Value (US$ Mn) by Country, 2022-2032
Figure 181: MEA Biodegradable Gloves Market Value (US$ Mn) Analysis by Country, 2017-2032
Figure 182: MEA Biodegradable Gloves Market Value Share (%) and BPS Analysis by Country, 2022-2032
Figure 183: MEA Biodegradable Gloves Market Y-o-Y Growth (%) Projections by Country, 2022-2032
Figure 184: MEA Biodegradable Gloves Market Value (US$ Mn) Analysis by Product, 2017-2032
Figure 185: MEA Biodegradable Gloves Market Value Share (%) and BPS Analysis by Product, 2022-2032
Figure 186: MEA Biodegradable Gloves Market Y-o-Y Growth (%) Projections by Product, 2022-2032
Figure 187: MEA Biodegradable Gloves Market Value (US$ Mn) Analysis by Size, 2017-2032
Figure 188: MEA Biodegradable Gloves Market Value Share (%) and BPS Analysis by Size, 2022-2032
Figure 189: MEA Biodegradable Gloves Market Y-o-Y Growth (%) Projections by Size, 2022-2032
Figure 190: MEA Biodegradable Gloves Market Value (US$ Mn) Analysis by Usage, 2017-2032
Figure 191: MEA Biodegradable Gloves Market Value Share (%) and BPS Analysis by Usage, 2022-2032
Figure 192: MEA Biodegradable Gloves Market Y-o-Y Growth (%) Projections by Usage, 2022-2032
Figure 193: MEA Biodegradable Gloves Market Value (US$ Mn) Analysis by End User, 2017-2032
Figure 194: MEA Biodegradable Gloves Market Value Share (%) and BPS Analysis by End User, 2022-2032
Figure 195: MEA Biodegradable Gloves Market Y-o-Y Growth (%) Projections by End User, 2022-2032
Figure 196: MEA Biodegradable Gloves Market Attractiveness by Product, 2022-2032
Figure 197: MEA Biodegradable Gloves Market Attractiveness by Size, 2022-2032
Figure 198: MEA Biodegradable Gloves Market Attractiveness by Usage, 2022-2032
Figure 199: MEA Biodegradable Gloves Market Attractiveness by End User, 2022-2032
Figure 200: MEA Biodegradable Gloves Market Attractiveness by Country, 2022-2032
The global biodegradable gloves market is worth USD 1.1 Billion in 2021 and is set to expand 7.9X over the next ten years.
The biodegradable gloves market is expected to reach USD 10.2 Billion by the end of 2032, with sales revenue expected to register a 23.0% CAGR.
The growing burden of medical waste, rising awareness regarding green initiatives and sustainable production methods, and adoption of biodegradable nitrile gloves are some of the key trends in this market.
India, USA, China, Malaysia, and Thailand are expected to drive demand for the biodegradable gloves industry.
North America is one of the key markets for biodegradable gloves, with the USA accounting for about 89.1% of the North American biodegradable gloves market in the year 2021.
Demand for biodegradable gloves in Europe is expected to register a growth of 21.8% over the next ten years.
Malaysia, the USA, and India are the key producers of biodegradable gloves.
SHOWA GROUP, SW Safety Solutions Inc., Innovative Gloves Co., Ltd., Top Glove Corporation Bhd, Hourglass International, Inc., Biogone, Worldchamp (Huizhou) Plastics Products Co., Ltd, SunEco Tech Ventures Private Limited, Traffi Hand Protection Specialists, St. Marys Rubbers Pvt. Ltd., and INSINC Products Ltd. are some of the key players in the biodegradable gloves industry.
Explore Similar Insights
Thank you!
You will receive an email from our Business Development Manager. Please be sure to check your SPAM/JUNK folder too.