Biodegradable Stretch Films Market Size and Share Forecast Outlook 2025 to 2035

In 2025, the global biodegradable stretch films market is valued at USD 4.1 billion and is likely to reach USD 6.7 billion by 2035, growing at a CAGR of 5.0%.
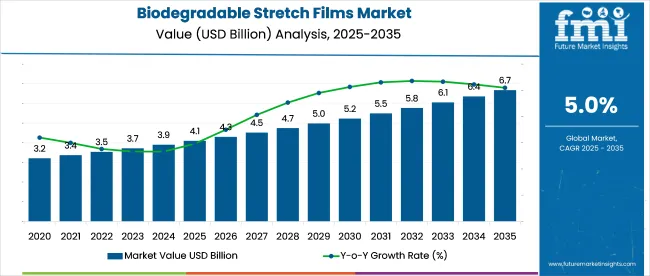
Quick Stats of the Biodegradable Stretch Films Market

  • Market Value (2025): USD 4.1 Billion
  • Forecast Value (2035): USD 6.7 Billion
  • Forecast CAGR: 5.0%
  • Product Leader in 2025: PLA-Blend Stretch Films
  • Top Distribution Channel: Industrial Packaging Distributors
  • Key Growth Region: Canada (13.1% CAGR)
  • Leading Player: Sigma Stretch Film

Biodegradable Stretch Films Market

Attribute Value
Market Size (2025) USD 4.1 billion
Market Size (2035) USD 6.7 billion
CAGR (2025 to 2035) 5.0%

Improved film strength, composting compatibility, and wider certification availability are helping expand adoption. Producers are scaling capacity and refining resin processing. Policy restrictions on conventional plastics and investment in composting infrastructure are encouraging uptake across both established and emerging markets.

Phil Stolz, Executive Vice President and General Manager for Flexibles at Berry Global Inc., stated that the transition to biodegradable stretch films extends beyond regulatory compliance, describing it as a fundamental redesign of supply chains aimed at reducing waste. He emphasized the company’s focus on material science innovations that maintain the performance standards of conventional films while enabling certified biodegradation, aligning with the environmental goals of their clients.

As of 2025, the biodegradable stretch films market accounts for approximately 1.8% of the global flexible packaging market, 3.9% of the bioplastics market, 4.6% of the stretch and shrink films market, 13.2% of the compostable packaging films market, and 2.7% of the food packaging materials market. These shares show the limited yet growing use of compostable stretch films within larger packaging segments dominated by conventional plastics.

Adoption remains concentrated in niche applications, especially food-grade and logistics wraps in regulated regions such as Western Europe and Canada. The highest integration is within compostable packaging, were regulatory alignment and substrate compatibility support deployment. Broader substitution in mainstream packaging remains constrained by pricing, film strength limitations, and composting infrastructure gaps across many high-volume markets

Analyzing Biodegradable Stretch Films by Top Investment Segments

The market reflects material consolidation around PLA blends, end-use clustering in food-grade applications, and functional adaptation for manual and automated wrapping systems. Demand patterns are anchored in thickness precision, composability compliance, and shelf-life predictability across industries.
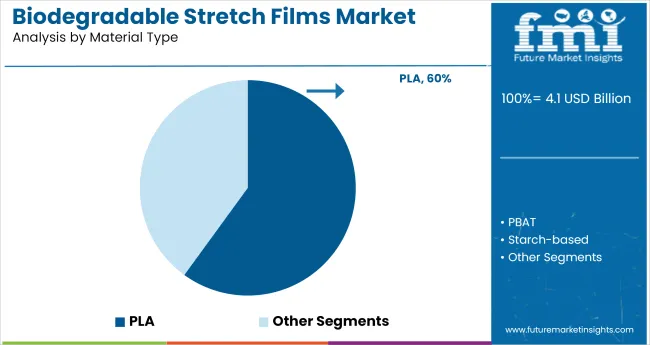
PLA Blend Films Drive Material Demand at 60% Share in 2025

Biodegradable Stretch Films Market Analysis By Material Type

PLA-based blends hold a 60% share in material usage due to their adaptability in co-extrusion systems and compatibility with existing stretch film converters. Typical PLA content ranges from 45-70%, often combined with PBAT to balance tensile strength and elasticity.

Firms such as BASF, Futamura, and TIPA Corp produce PLA blend films targeting load retention values of 12-17 N/mm², which meet standard pallet unitization needs. These films can maintain elongation at break levels above 250%, enabling reliable stretch under both hand and machine wrap conditions. Optical clarity is another advantage, with haze values under 5%, supporting applications in retail-facing packaging.
  • Runs on commercial cast film lines with outputs of 300-450 kg/hr
  • Decomposition initiated under 58°C conditions in 90-120 days (industrial compost)
  • Acceptable gauge tolerance within ±3 microns for food-grade compliance

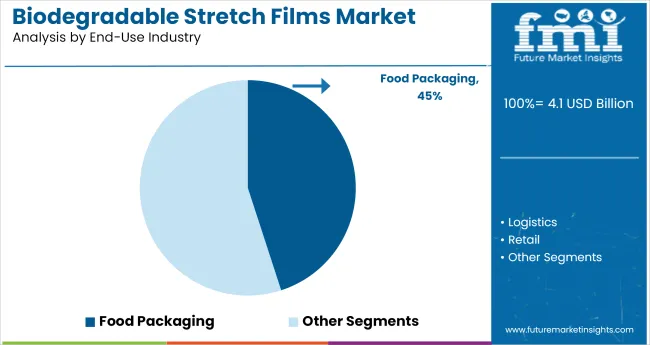
Food Packaging Accounts for 45% of End-Use in 2025

Biodegradable Stretch Films Market Analysis By End Use Industry

Food packaging represents 45% of end-use volume, favored for its compatibility with fresh produce, dairy, and meat categories. Key requirements include oxygen transmission rates (OTR) below 100 cc/m²/day and moisture vapor transmission rates (MVTR) under 20 g/m²/day, both achievable with PLA or PHA layers.

Players like NatureWorks, FKuR, and Novamont support chilled storage wrap solutions requiring high barrier retention and film uniformity. Common film widths range from 300-500 mm, with machine wrap films processed at speeds of 120-150 m/min. Biofilm variants also show good performance under intermittent temperature cycling (5°C to 25°C), required for cold chain logistics.
  • Food contact safety certified under EU 10/2011 and FDA 21 CFR
  • Anti-fog coating retention maintained up to 20 wash cycles in reuse settings
  • Films designed for single-use and semi-reuse scenarios within 7-day shelf cycles

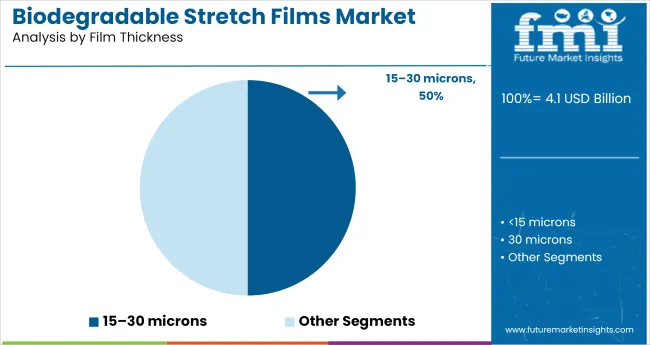
15-30 Micron Films Dominate with Balanced Load Stability

Biodegradable Stretch Films Market Analysis By Film Thickness

Films within the 15-30-micron range form the most commercially relevant segment, offering an optimal mix of strength, flexibility, and process economy. Average usage across pallet loads falls between 150-250 grams per pallet, translating to low material-to-load ratios.

Manufacturers such as Biogone, EcoCortec, and Polynova produce cast and blown variants tailored to meet puncture resistance thresholds above 1.5 N/mm for retail logistics. These films demonstrate minimal snapback and consistent unwind force of 0.5-1.2 kgf, making them adaptable for manual and semi-automatic wrappers. Gauge variability control and downgauging potential remain strategic levers for reducing operational costs.
  • Optimal tension retention over 72-hour load tests for stacked cartons
  • Maintains cling properties across polyethylene, paperboard, and metal substrates
  • Reels supplied in lengths of 800-1,500 meters depending on wrapping frequency

Hand Wrap Films Outpace Other Functional Types in 2025

Biodegradable Stretch Films Market Analysis By Functionality

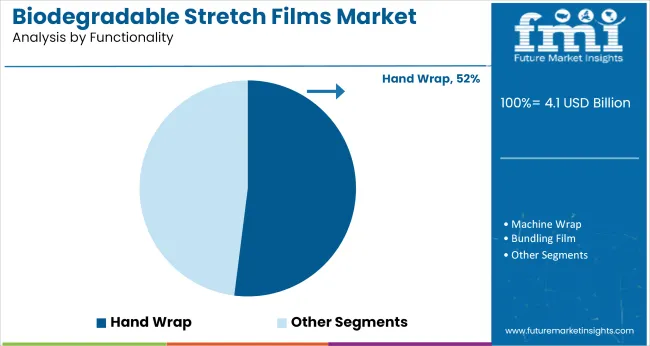
Hand wrap films are widely adopted across SME packaging units, accounting for an estimated 52% of total functional consumption. These films typically offer lower unwind noise (<80 dB) and better control over wrapping pressure, which is essential in uneven or fragile load configurations.

Players like Cortec Corporation, Bio4Pack, and Pack Natur supply rolls in coreless and extended core formats, with thicknesses usually between 17-23 microns. Load holding force of 9-12 N/mm² is sufficient for pallet weights under 400 kg. Color additives and printable surfaces are commonly integrated to aid in traceability and branding.
  • Coreless variants reduce plastic accessory waste by >85%
  • Allows stretchability of 180-220% under ambient conditions
  • Roll weights designed under 2.5 kg for ergonomic handling during extended use

Industrial Compostable Films Hold Majority at 62% Share in 2025

Biodegradable Stretch Films Market Analysis By Degradability

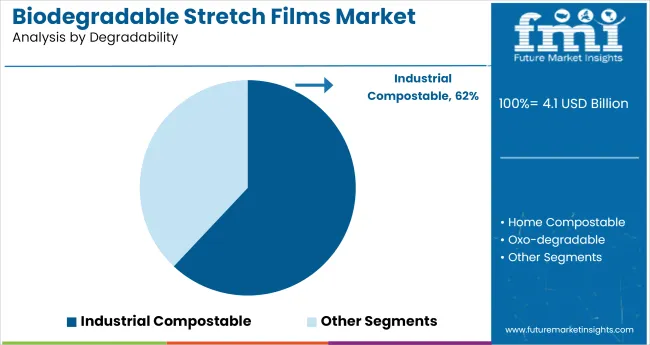
Films labeled as industrial compostable make up 62% of the degradability segment, preferred due to standardized degradation environments and broader certification acceptance. These films pass EN 13432 and ASTM D6400 testing with compost-to-carbon conversion rates exceeding 85% within 90 days.

Large-scale film processors such as Kingfa, Natur-Tec, and Green Dot Bioplastics prioritize this category for logistic scalability and minimal compliance overhead. Typical film densities range from 1.2-1.4 g/cm³, contributing to tighter wrapping with fewer passes. Resins can be pelletized for reuse or co-extruded with minor PBAT additions for enhanced mechanical flexibility.

  • Retains tensile performance through 5-7 winding cycles in automatic dispensers
  • Compatible with UV-sensitive inventory zones due to low light absorption indices
  • Suitable for centralized composting facilities with heat activation over 55°C

Top Biodegradable Stretch Films Market Dynamics

Biodegradable stretch film suppliers adjusted inventory cycles, optimized machinery compatibility, and introduced compostable formats to meet evolving packaging demands. Retail trials boosted sales in premium produce, while resin and freight price fluctuations compressed converter margins.

Inventory Realignment & Machinery Compatibility Gains

Distributors in Germany and Italy shortened biodegradable stretch film inventory cycles from 73 to 49 days during Q1 2025 by calibrating roll dimensions with automated pallet wrappers. Retrofit kits allowed older equipment to handle PLA and PBAT blends with fewer tears, reducing unplanned stoppages by 27%.

Exporters across Southeast Asia introduced roll-width standards that cut average customs delays by 3.2 days. In Brazil, banana cooperatives moved to thinner 12 μm films from traditional 17 μm formats, lowering material use by 11% while maintaining required durability. These shifts enabled warehouse operators to trim buffer stock levels by 13%, improving turnover without raising supply risk.

Compostable Formats Gain Market Access in Premium Fresh Produce

Aldi Süd introduced home-compostable wraps for organic avocados across 180 locations in Q2 2025 and saw a 9% improvement in weekly sell-through compared to conventional formats. Film blends certified under EN 13432 with 62% renewable input were linked to stronger shelf appeal based on panel tests in France and Belgium.

Moroccan exporters of heirloom tomatoes adopted QR-coded film for tracking and disposal guidance, aligning with EU buyer preferences. Australian mango growers recorded a 23% rise in acceptance of certified compostable wraps among European importers, driven by packaging-linked emissions reporting.

Feedstock and Freight Volatility Weigh on Conversion Margins Fluctuations in input pricing pressured margins across the stretch film supply chain. Starch and PLA resin prices rose between 6-9% year-over-year by May 2025 due to supply issues in the US and ethanol constraints in Brazil.

PBAT cargoes entering China faced a 5.8% tariff adjustment, adding USD 180 per tonne to landed costs. Rising freight charges from Qingdao to EU ports, up 12%, added further strain. Gross margins for converters declined from 18.5% to 13.2% within six months. To absorb costs, some producers extended roll length by 15% through tighter core dimensions, reducing packaging waste per unit.
Top Countries Manufacturing, Synthesizing, Distributing, and Generating Demand for Biodegradable Stretch Films

Country Wise Analysis Of Biodegradable Stretch Films Market

Countries CAGR (2025 to 2035)
Canada 13.1%
China 12.2%
India 11.0%
USA 6.2%
Germany 5.0%

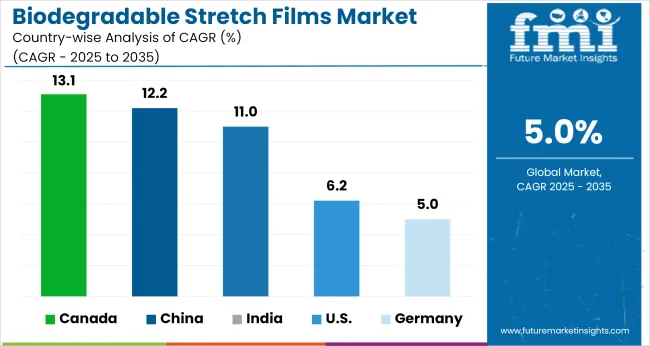
Global demand for biodegradable stretch films is projected to grow at a 5.0% CAGR from 2025 to 2035. Among the five profiled countries out of 40 covered, Canada (OECD) leads with 13.1%, followed by China (BRICS) at 12.2%, India (BRICS) at 11.0%, the United States (OECD) at 6.2%, and Germany (OECD) at 5.0%. These translate to a performance premium of +162% for Canada, +144% for China, +120% for India, and +24% for the USA, while Germany matches the global baseline.

Demand in BRICS countries is driven by scaled packaging rollouts for food distribution and local initiatives to shift away from conventional polyethylene wraps. Among OECD members, Canada’s steep growth reflects strong alignment with national packaging reforms and public procurement shifts. The USA shows consistent industrial uptake, while Germany’s expansion is paced by selective use cases and manufacturing transitions within its industrial packaging sector.

The report covers detailed analysis of 40+ countries, with the top five countries shared as a reference

Demand Forecast for Biodegradable Stretch Films in the United States

The USA market is projected to expand at a 6.2% CAGR, reaching 157,000 MT by 2035 from an estimated 86,000 MT in 2025. Demand is anchored in commercial freight operations, particularly across food and consumer packaged goods sectors. More than 12,000 logistics centers are expected to shift to biodegradable variants, and certified compostable film formats now account for over 7% of pallet-wrapping solutions in California and New York.

  • Over 2.8 billion ft² of warehousing space reclassified under state green packaging mandates.
  • More than 18% of food processors moving away from polyethylene stretch film by 2028.
  • PLA and PBAT blend films exhibiting 20% higher puncture resistance in cold-chain simulations.

Market Expansion of Biodegradable Stretch Films in Canada

With a projected 13.1% CAGR, Canada’s biodegradable stretch film demand is expected to rise from 21,000 MT in 2025 to 72,000 MT by 2035. Growth is driven by zero-plastic directives adopted by seven provinces, covering over 75% of retail packaging operations. Adoption has surged in agricultural cold chains and eco-label retail formats, which now account for nearly 40% of total biofilm use.

  • Western greenhouse operations to double stretch film consumption to 12,000 MT by 2030.
  • 60+ local vendors producing starch-PBAT hybrids registered under the CCME packaging registry.
  • Flexible film imports from the USA and Europe increased by 42% YoY as of 2024.

Production and Logistics Demand for Biodegradable Stretch Films in Germany

The market in Germany is anticipated to rise at a 5.0% CAGR, with demand growing from 41,000 MT in 2025 to 67,000 MT in 2035. Over 110 logistics zones, including Hamburg and North Rhine-Westphalia, are seeing deployment of DIN-CERTCO certified stretch films. Over 150 SMEs are integrating biodegradable options into packaging lines, many of which now prefer multi-layer PBS-based films offering better cling properties under variable humidity.

  • Biodegradable films are likely to grow over 38% of domestic produce exports by 2027.
  • Average film gauge dropped by 17 microns without loss in holding force in trial applications.
  • Certified compostable film output by German converters surpassed 24,000 MT in 2024.

Industry Uptake of Biodegradable Stretch Films in China

The biodegradable stretch films market in China is set to grow at a 12.2% CAGR, from 59,000 MT in 2025 to 186,000 MT in 2035. More than 70 industrial parks across Jiangsu, Zhejiang, and Guangdong have introduced pilot mandates on biodegradable packaging. In 2024, over 23,000 MT of PBAT-based film was produced domestically. Volume buyers include cross-border fulfillment hubs, which are shifting toward PLA-PBAT hybrids rated for 6-month compost cycles.

  • Over 40% of national e-commerce volume is now shipped via alternative wrap formats.
  • Film thickness dropped by 25% across 11 trials, reducing total material consumption by 19%.
  • Nearly 3,200 SMEs now use in-house wrapping machines optimized for biodegradable film rolls.

Distribution-Specific Adoption of Biodegradable Stretch Films in India

The market in India is poised for an 11.0% CAGR, expanding from 38,000 MT in 2025 to 108,000 MT by 2035. Central Warehousing Corporation and state-run mandis account for 14,000 MT of projected 2030 demand. Bio-based film trials have been initiated in logistics corridors between Delhi, Mumbai, and Chennai. The market is also driven by an uptake in floriculture and agri-export packaging, where water-resistant biodegradable films are favored.
  • Over 210 logistics firms transitioned at least one warehouse into biodegradable-only packaging.
  • Indian starch-based films outperform standard PBAT wraps in load retention by 9-11%.
  • Annual state tenders for certified biodegradable stretch films crossed INR 110 crore in 2024.

Leading Biodegradable Stretch Films Suppliers Manufacturers, Suppliers, Distributors

Biodegradable Stretch Films Market Analysis By Company

Leading Player - Sigma Stretch Film holding 12% Industry Share

Sigma Stretch Film, Alliance Plastics, and Rolls Stretch Film Ltd. are among the established producers expanding their reach through in-house film development and application-specific blends. Sigma’s PLA-PBAT wrap launched in 2024 targets temperature-sensitive freight, while Alliance Plastics invested in certified testing to improve buyer trust across Europe. These players focus on process refinement and reliable sourcing to maintain output consistency.

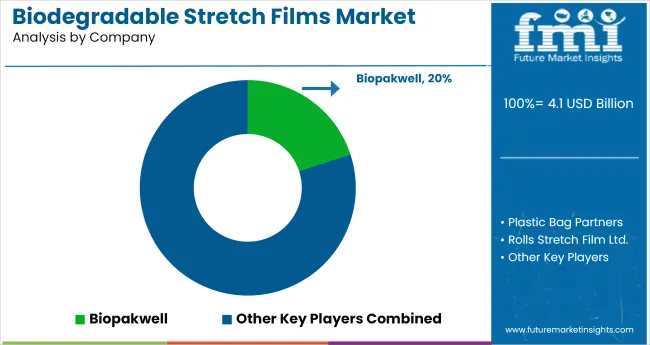
Emerging suppliers such as YITO ECO, Biopakwell, and Eternal Packaging Ltd. are gaining attention through regional partnerships and feedstock tie-ups. Biopakwell’s agreement with a starch supplier in Indonesia stabilized input costs, while Simply Polybags introduced smaller roll formats for independent packers. New entrants face barriers tied to raw material volatility, certification delays, and performance constraints in mechanized packing environments.

Recent Industry News

  • In May 2024, Rolls Stretch Film Ltd. launched the first marine-degradable stretch film, certified to break down in aquatic environments within 24 months, addressing global plastic pollution concerns.
  • In March 2025, Simply Polybags disrupted the market with a cost-competitive biodegradable stretch film, closing the price gap with conventional plastics and accelerating mass adoption.

Leading Players

  • Biopakwell
  • Plastic Bag Partners
  • Rolls stretch film Ltd.
  • Alliance Plastics
  • Soaraway Packaging
  • YITO ECO
  • Fibers of Kalamazoo
  • Simply Polybags
  • Sigma Stretch Film
  • Eternal Packaging Ltd

Report Scope

Report Attributes Details
Market Size (2025) USD 4.1 billion
Projected Market Size (2035) USD 6.7 billion
CAGR (2025 to 2035) 5.0%
Base Year for Estimation 2024
Historical Period 2020 to 2024
Projection Period 2025 to 2035
Quantitative Units USD billion for value
Material Types Analyzed (Segment 1) PLA, PBAT, Starch-based, PHA, Cellulose-based
Film Thickness Range (Segment 2) <15 microns, 15 - 30 microns, >30 microns
Functionality Categories (Segment 3) Hand Wrap, Machine Wrap, Bundling Film
Degradability Types (Segment 4) Industrial Compostable, Home Compostable, Oxo-degradable
End-Use Industries (Segment 5) Food Packaging, Logistics, Retail, Agriculture
Regions Covered North America, Latin America, Western Europe, Eastern Europe, East Asia, South Asia & Pacific, Middle East & Africa
Countries Covered United States, Canada, Germany, France, China, Japan, South Korea, India, Brazil, Australia
Key Companies Profiled Biopakwell, Plastic Bag Partners, Rolls Stretch Film Ltd., Alliance Plastics, Soaraway Packaging, YITO ECO, Fibers of Kalamazoo, Simply Polybags, Sigma Stretch Film, Eternal Packaging Ltd
Additional Attributes Dollar sales tracked across degradability type and film thickness, share by end-use sectors including logistics and agriculture, increasing demand from food packaging and bundling applications, adoption in zero-waste retail, produce wrap, and e-commerce shipping, regional production hubs in China and Western Europe fostering export volumes, film design evolution to meet composting norms across North America and EU markets.

Biodegradable Stretch Films Market Analyzed by Key Investment Segments

By Material Type:

  • PLA
  • PBAT
  • Starch-based
  • PHA
  • Cellulose-based

By Film Thickness:

  • <15 microns
  • 15-30 microns
  • 30 microns

By Functionality:

  • Hand Wrap
  • Machine Wrap
  • Bundling Film

By Degradability:

  • Industrial Compostable
  • Home Compostable
  • Oxo-degradable

By End-Use Industry:

  • Food Packaging
  • Logistics
  • Retail
  • Agriculture

By Region:

  • North America
  • Europe
  • Asia-Pacific
  • Latin America
  • Middle East & Africa

Table of Content

  1. Executive Summary
    • Global Market Outlook
    • Demand-side Trends
    • Supply-side Trends
    • Technology Roadmap Analysis
    • Analysis and Recommendations
  2. Market Overview
    • Market Coverage / Taxonomy
    • Market Definition / Scope / Limitations
  3. Market Background
    • Market Dynamics
      • Drivers
      • Restraints
      • Opportunity
      • Trends
    • Scenario Forecast
      • Demand in Optimistic Scenario
      • Demand in Likely Scenario
      • Demand in Conservative Scenario
    • Opportunity Map Analysis
    • Product Life Cycle Analysis
    • Supply Chain Analysis
      • Supply Side Participants and their Roles
        • Producers
        • Mid-Level Participants (Traders/ Agents/ Brokers)
        • Wholesalers and Distributors
      • Value Added and Value Created at Node in the Supply Chain
      • List of Raw Material Suppliers
      • List of Existing and Potential Buyer’s
    • Investment Feasibility Matrix
    • Value Chain Analysis
      • Profit Margin Analysis
      • Wholesalers and Distributors
      • Retailers
    • PESTLE and Porter’s Analysis
    • Regulatory Landscape
      • By Key Regions
      • By Key Countries
    • Regional Parent Market Outlook
    • Production and Consumption Statistics
    • Import and Export Statistics
  4. Global Market Analysis 2020 to 2024 and Forecast, 2025 to 2035
    • Historical Market Size Value (USD Billion) & Volume (MT) Analysis, 2020 to 2024
    • Current and Future Market Size Value (USD Billion) & Volume (MT) Projections, 2025 to 2035
      • Y-o-Y Growth Trend Analysis
      • Absolute $ Opportunity Analysis
  5. Global Market Pricing Analysis 2020 to 2024 and Forecast 2025 to 2035
  6. Global Market Analysis 2020 to 2024 and Forecast 2025 to 2035, By Material Type
    • Introduction / Key Findings
    • Historical Market Size Value (USD Billion) & Volume (MT) Analysis By Material Type, 2020 to 2024
    • Current and Future Market Size Value (USD Billion) & Volume (MT) Analysis and Forecast By Material Type, 2025 to 2035
      • PLA
      • PBAT
      • Starch-based
      • PHA
      • Cellulose-based
    • Y-o-Y Growth Trend Analysis By Material Type, 2020 to 2024
    • Absolute $ Opportunity Analysis By Material Type, 2025 to 2035
  7. Global Market Analysis 2020 to 2024 and Forecast 2025 to 2035, By Film Thickness
    • Introduction / Key Findings
    • Historical Market Size Value (USD Billion) & Volume (MT) Analysis By Film Thickness, 2020 to 2024
    • Current and Future Market Size Value (USD Billion) & Volume (MT) Analysis and Forecast By Film Thickness, 2025 to 2035
      • <15 microns
      • 15-30 microns
      • 30 microns
    • Y-o-Y Growth Trend Analysis By Film Thickness, 2020 to 2024
    • Absolute $ Opportunity Analysis By Film Thickness, 2025 to 2035
  8. Global Market Analysis 2020 to 2024 and Forecast 2025 to 2035, By Functionality
    • Introduction / Key Findings
    • Historical Market Size Value (USD Billion) & Volume (MT) Analysis By Functionality, 2020 to 2024
    • Current and Future Market Size Value (USD Billion) & Volume (MT) Analysis and Forecast By Functionality, 2025 to 2035
      • Hand Wrap
      • Machine Wrap
      • Bundling Film
    • Y-o-Y Growth Trend Analysis By Functionality, 2020 to 2024
    • Absolute $ Opportunity Analysis By Functionality, 2025 to 2035
  9. Global Market Analysis 2020 to 2024 and Forecast 2025 to 2035, By Degradability
    • Introduction / Key Findings
    • Historical Market Size Value (USD Billion) & Volume (MT) Analysis By Degradability, 2020 to 2024
    • Current and Future Market Size Value (USD Billion) & Volume (MT) Analysis and Forecast By Degradability, 2025 to 2035
      • Industrial Compostable
      • Home Compostable
      • Oxo-degradable
    • Y-o-Y Growth Trend Analysis By Degradability, 2020 to 2024
    • Absolute $ Opportunity Analysis By Degradability, 2025 to 2035
  10. Global Market Analysis 2020 to 2024 and Forecast 2025 to 2035, By End-Use Industry
    • Introduction / Key Findings
    • Historical Market Size Value (USD Billion) & Volume (MT) Analysis By End-Use Industry, 2020 to 2024
    • Current and Future Market Size Value (USD Billion) & Volume (MT) Analysis and Forecast By End-Use Industry, 2025 to 2035
      • Food Packaging
      • Logistics
      • Retail
      • Agriculture
    • Y-o-Y Growth Trend Analysis By End-Use Industry, 2020 to 2024
    • Absolute $ Opportunity Analysis By End-Use Industry, 2025 to 2035
  11. Global Market Analysis 2020 to 2024 and Forecast 2025 to 2035, By Region
    • Introduction
    • Historical Market Size Value (USD Billion) & Volume (MT) Analysis By Region, 2020 to 2024
    • Current Market Size Value (USD Billion) & Volume (MT) Analysis and Forecast By Region, 2025 to 2035
      • North America
      • Latin America
      • Western Europe
      • Eastern Europe
      • East Asia
      • South Asia & Pacific
      • Middle East and Africa
    • Market Attractiveness Analysis By Region
  12. North America Market Analysis 2020 to 2024 and Forecast 2025 to 2035, By Country
    • Historical Market Size Value (USD Billion) & Volume (MT) Trend Analysis By Market Taxonomy, 2020 to 2024
    • Market Size Value (USD Billion) & Volume (MT) Forecast By Market Taxonomy, 2025 to 2035
      • By Country
        • USA
        • Canada
        • Mexico
      • By Material Type
      • By Film Thickness
      • By Functionality
      • By Degradability
      • By End-Use Industry
    • Market Attractiveness Analysis
      • By Country
      • By Material Type
      • By Film Thickness
      • By Functionality
      • By Degradability
      • By End-Use Industry
    • Key Takeaways
  13. Latin America Market Analysis 2020 to 2024 and Forecast 2025 to 2035, By Country
    • Historical Market Size Value (USD Billion) & Volume (MT) Trend Analysis By Market Taxonomy, 2020 to 2024
    • Market Size Value (USD Billion) & Volume (MT) Forecast By Market Taxonomy, 2025 to 2035
      • By Country
        • Brazil
        • Argentina
        • Rest of LATAM
      • By Material Type
      • By Film Thickness
      • By Functionality
      • By Degradability
      • By End-Use Industry
    • Market Attractiveness Analysis
      • By Country
      • By Material Type
      • By Film Thickness
      • By Functionality
      • By Degradability
      • By End-Use Industry
    • Key Takeaways
  14. Western Europe Market Analysis 2020 to 2024 and Forecast 2025 to 2035, By Country
    • Historical Market Size Value (USD Billion) & Volume (MT) Trend Analysis By Market Taxonomy, 2020 to 2024
    • Market Size Value (USD Billion) & Volume (MT) Forecast By Market Taxonomy, 2025 to 2035
      • By Country
        • Germany
        • Italy
        • France
        • UK
        • Spain
        • BENELUX
        • Nordic
        • Rest of W.Europe
      • By Material Type
      • By Film Thickness
      • By Functionality
      • By Degradability
      • By End-Use Industry
    • Market Attractiveness Analysis
      • By Country
      • By Material Type
      • By Film Thickness
      • By Functionality
      • By Degradability
      • By End-Use Industry
    • Key Takeaways
  15. Eastern Europe Market Analysis 2020 to 2024 and Forecast 2025 to 2035, By Country
    • Historical Market Size Value (USD Billion) & Volume (MT) Trend Analysis By Market Taxonomy, 2020 to 2024
    • Market Size Value (USD Billion) & Volume (MT) Forecast By Market Taxonomy, 2025 to 2035
      • By Country
        • Russia
        • Hungary
        • Poland
        • Balkan & Baltics
        • Rest of E. Europe
      • By Material Type
      • By Film Thickness
      • By Functionality
      • By Degradability
      • By End-Use Industry
    • Market Attractiveness Analysis
      • By Country
      • By Material Type
      • By Film Thickness
      • By Functionality
      • By Degradability
      • By End-Use Industry
    • Key Takeaways
  16. East Asia Market Analysis 2020 to 2024 and Forecast 2025 to 2035, By Country
    • Historical Market Size Value (USD Billion) & Volume (MT) Trend Analysis By Market Taxonomy, 2020 to 2024
    • Market Size Value (USD Billion) & Volume (MT) Forecast By Market Taxonomy, 2025 to 2035
      • By Country
        • China
        • Japan
        • South Korea
      • By Material Type
      • By Film Thickness
      • By Functionality
      • By Degradability
      • By End-Use Industry
    • Market Attractiveness Analysis
      • By Country
      • By Material Type
      • By Film Thickness
      • By Functionality
      • By Degradability
      • By End-Use Industry
    • Key Takeaways
  17. South Asia & Pacific Market Analysis 2020 to 2024 and Forecast 2025 to 2035, By Country
    • Historical Market Size Value (USD Billion) & Volume (MT) Trend Analysis By Market Taxonomy, 2020 to 2024
    • Market Size Value (USD Billion) & Volume (MT) Forecast By Market Taxonomy, 2025 to 2035
      • By Country
        • India
        • Australia & New Zealand
        • ASEAN
        • Rest of SAP
      • By Material Type
      • By Film Thickness
      • By Functionality
      • By Degradability
      • By End-Use Industry
    • Market Attractiveness Analysis
      • By Country
      • By Material Type
      • By Film Thickness
      • By Functionality
      • By Degradability
      • By End-Use Industry
    • Key Takeaways
  18. Middle East and Africa Market Analysis 2020 to 2024 and Forecast 2025 to 2035, By Country
    • Historical Market Size Value (USD Billion) & Volume (MT) Trend Analysis By Market Taxonomy, 2020 to 2024
    • Market Size Value (USD Billion) & Volume (MT) Forecast By Market Taxonomy, 2025 to 2035
      • By Country
        • GCC Countries
        • Northern Africa
        • South Africa
        • Turkiye
        • Rest of MEA
      • By Material Type
      • By Film Thickness
      • By Functionality
      • By Degradability
      • By End-Use Industry
    • Market Attractiveness Analysis
      • By Country
      • By Material Type
      • By Film Thickness
      • By Functionality
      • By Degradability
      • By End-Use Industry
    • Key Takeaways
  19. Key Countries Market Analysis
    • USA
      • Pricing Analysis
      • Market Share Analysis, 2024
        • By Material Type
        • By Film Thickness
        • By Functionality
        • By Degradability
        • By End-Use Industry
    • Canada
      • Pricing Analysis
      • Market Share Analysis, 2024
        • By Material Type
        • By Film Thickness
        • By Functionality
        • By Degradability
        • By End-Use Industry
    • Brazil
      • Pricing Analysis
      • Market Share Analysis, 2024
        • By Material Type
        • By Film Thickness
        • By Functionality
        • By Degradability
        • By End-Use Industry
    • Mexico
      • Pricing Analysis
      • Market Share Analysis, 2024
        • By Material Type
        • By Film Thickness
        • By Functionality
        • By Degradability
        • By End-Use Industry
    • Argentina
      • Pricing Analysis
      • Market Share Analysis, 2024
        • By Material Type
        • By Film Thickness
        • By Functionality
        • By Degradability
        • By End-Use Industry
  20. Market Structure Analysis
    • Competition Dashboard
    • Competition Benchmarking
    • Market Share Analysis of Top Players
      • By Regional
      • By Material Type
      • By Film Thickness
      • By Functionality
      • By Degradability
      • By End-Use Industry
  21. Competition Analysis
    • Competition Deep Dive
      • Biopakwell
        • Overview
        • Product Portfolio
        • Profitability by Market Segments (Product/Age /Sales Channel/Region)
        • Sales Footprint
        • Strategy Overview
          • Marketing Strategy
          • Product Strategy
          • Channel Strategy
      • Plastic Bag Partners
        • Overview
        • Product Portfolio
        • Profitability by Market Segments (Product/Age /Sales Channel/Region)
        • Sales Footprint
        • Strategy Overview
          • Marketing Strategy
          • Product Strategy
          • Channel Strategy
      • Rolls stretch film Ltd.
        • Overview
        • Product Portfolio
        • Profitability by Market Segments (Product/Age /Sales Channel/Region)
        • Sales Footprint
        • Strategy Overview
          • Marketing Strategy
          • Product Strategy
          • Channel Strategy
      • Alliance Plastics
        • Overview
        • Product Portfolio
        • Profitability by Market Segments (Product/Age /Sales Channel/Region)
        • Sales Footprint
        • Strategy Overview
          • Marketing Strategy
          • Product Strategy
          • Channel Strategy
      • Soaraway Packaging
        • Overview
        • Product Portfolio
        • Profitability by Market Segments (Product/Age /Sales Channel/Region)
        • Sales Footprint
        • Strategy Overview
          • Marketing Strategy
          • Product Strategy
          • Channel Strategy
      • YITO ECO
        • Overview
        • Product Portfolio
        • Profitability by Market Segments (Product/Age /Sales Channel/Region)
        • Sales Footprint
        • Strategy Overview
          • Marketing Strategy
          • Product Strategy
          • Channel Strategy
      • Fibers of Kalamazoo
        • Overview
        • Product Portfolio
        • Profitability by Market Segments (Product/Age /Sales Channel/Region)
        • Sales Footprint
        • Strategy Overview
          • Marketing Strategy
          • Product Strategy
          • Channel Strategy
      • Simply Polybags
        • Overview
        • Product Portfolio
        • Profitability by Market Segments (Product/Age /Sales Channel/Region)
        • Sales Footprint
        • Strategy Overview
          • Marketing Strategy
          • Product Strategy
          • Channel Strategy
      • Sigma Stretch Film
        • Overview
        • Product Portfolio
        • Profitability by Market Segments (Product/Age /Sales Channel/Region)
        • Sales Footprint
        • Strategy Overview
          • Marketing Strategy
          • Product Strategy
          • Channel Strategy
      • Eternal Packaging Ltd
        • Overview
        • Product Portfolio
        • Profitability by Market Segments (Product/Age /Sales Channel/Region)
        • Sales Footprint
        • Strategy Overview
          • Marketing Strategy
          • Product Strategy
          • Channel Strategy
  22. Assumptions & Acronyms Used
  23. Research Methodology

List of Tables

  • Table 1: Global Market Value (USD Billion) Forecast by Region, 2020 to 2035
  • Table 2: Global Market Volume (MT) Forecast by Region, 2020 to 2035
  • Table 3: Global Market Value (USD Billion) Forecast by Material Type, 2020 to 2035
  • Table 4: Global Market Volume (MT) Forecast by Material Type, 2020 to 2035
  • Table 5: Global Market Value (USD Billion) Forecast by Film Thickness, 2020 to 2035
  • Table 6: Global Market Volume (MT) Forecast by Film Thickness, 2020 to 2035
  • Table 7: Global Market Value (USD Billion) Forecast by Functionality, 2020 to 2035
  • Table 8: Global Market Volume (MT) Forecast by Functionality, 2020 to 2035
  • Table 9: Global Market Value (USD Billion) Forecast by Degradability, 2020 to 2035
  • Table 10: Global Market Volume (MT) Forecast by Degradability, 2020 to 2035
  • Table 11: Global Market Value (USD Billion) Forecast by End-Use Industry, 2020 to 2035
  • Table 12: Global Market Volume (MT) Forecast by End-Use Industry, 2020 to 2035
  • Table 13: North America Market Value (USD Billion) Forecast by Country, 2020 to 2035
  • Table 14: North America Market Volume (MT) Forecast by Country, 2020 to 2035
  • Table 15: North America Market Value (USD Billion) Forecast by Material Type, 2020 to 2035
  • Table 16: North America Market Volume (MT) Forecast by Material Type, 2020 to 2035
  • Table 17: North America Market Value (USD Billion) Forecast by Film Thickness, 2020 to 2035
  • Table 18: North America Market Volume (MT) Forecast by Film Thickness, 2020 to 2035
  • Table 19: North America Market Value (USD Billion) Forecast by Functionality, 2020 to 2035
  • Table 20: North America Market Volume (MT) Forecast by Functionality, 2020 to 2035
  • Table 21: North America Market Value (USD Billion) Forecast by Degradability, 2020 to 2035
  • Table 22: North America Market Volume (MT) Forecast by Degradability, 2020 to 2035
  • Table 23: North America Market Value (USD Billion) Forecast by End-Use Industry, 2020 to 2035
  • Table 24: North America Market Volume (MT) Forecast by End-Use Industry, 2020 to 2035
  • Table 25: Latin America Market Value (USD Billion) Forecast by Country, 2020 to 2035
  • Table 26: Latin America Market Volume (MT) Forecast by Country, 2020 to 2035
  • Table 27: Latin America Market Value (USD Billion) Forecast by Material Type, 2020 to 2035
  • Table 28: Latin America Market Volume (MT) Forecast by Material Type, 2020 to 2035
  • Table 29: Latin America Market Value (USD Billion) Forecast by Film Thickness, 2020 to 2035
  • Table 30: Latin America Market Volume (MT) Forecast by Film Thickness, 2020 to 2035
  • Table 31: Latin America Market Value (USD Billion) Forecast by Functionality, 2020 to 2035
  • Table 32: Latin America Market Volume (MT) Forecast by Functionality, 2020 to 2035
  • Table 33: Latin America Market Value (USD Billion) Forecast by Degradability, 2020 to 2035
  • Table 34: Latin America Market Volume (MT) Forecast by Degradability, 2020 to 2035
  • Table 35: Latin America Market Value (USD Billion) Forecast by End-Use Industry, 2020 to 2035
  • Table 36: Latin America Market Volume (MT) Forecast by End-Use Industry, 2020 to 2035
  • Table 37: Western Europe Market Value (USD Billion) Forecast by Country, 2020 to 2035
  • Table 38: Western Europe Market Volume (MT) Forecast by Country, 2020 to 2035
  • Table 39: Western Europe Market Value (USD Billion) Forecast by Material Type, 2020 to 2035
  • Table 40: Western Europe Market Volume (MT) Forecast by Material Type, 2020 to 2035
  • Table 41: Western Europe Market Value (USD Billion) Forecast by Film Thickness, 2020 to 2035
  • Table 42: Western Europe Market Volume (MT) Forecast by Film Thickness, 2020 to 2035
  • Table 43: Western Europe Market Value (USD Billion) Forecast by Functionality, 2020 to 2035
  • Table 44: Western Europe Market Volume (MT) Forecast by Functionality, 2020 to 2035
  • Table 45: Western Europe Market Value (USD Billion) Forecast by Degradability, 2020 to 2035
  • Table 46: Western Europe Market Volume (MT) Forecast by Degradability, 2020 to 2035
  • Table 47: Western Europe Market Value (USD Billion) Forecast by End-Use Industry, 2020 to 2035
  • Table 48: Western Europe Market Volume (MT) Forecast by End-Use Industry, 2020 to 2035
  • Table 49: Eastern Europe Market Value (USD Billion) Forecast by Country, 2020 to 2035
  • Table 50: Eastern Europe Market Volume (MT) Forecast by Country, 2020 to 2035
  • Table 51: Eastern Europe Market Value (USD Billion) Forecast by Material Type, 2020 to 2035
  • Table 52: Eastern Europe Market Volume (MT) Forecast by Material Type, 2020 to 2035
  • Table 53: Eastern Europe Market Value (USD Billion) Forecast by Film Thickness, 2020 to 2035
  • Table 54: Eastern Europe Market Volume (MT) Forecast by Film Thickness, 2020 to 2035
  • Table 55: Eastern Europe Market Value (USD Billion) Forecast by Functionality, 2020 to 2035
  • Table 56: Eastern Europe Market Volume (MT) Forecast by Functionality, 2020 to 2035
  • Table 57: Eastern Europe Market Value (USD Billion) Forecast by Degradability, 2020 to 2035
  • Table 58: Eastern Europe Market Volume (MT) Forecast by Degradability, 2020 to 2035
  • Table 59: Eastern Europe Market Value (USD Billion) Forecast by End-Use Industry, 2020 to 2035
  • Table 60: Eastern Europe Market Volume (MT) Forecast by End-Use Industry, 2020 to 2035
  • Table 61: East Asia Market Value (USD Billion) Forecast by Country, 2020 to 2035
  • Table 62: East Asia Market Volume (MT) Forecast by Country, 2020 to 2035
  • Table 63: East Asia Market Value (USD Billion) Forecast by Material Type, 2020 to 2035
  • Table 64: East Asia Market Volume (MT) Forecast by Material Type, 2020 to 2035
  • Table 65: East Asia Market Value (USD Billion) Forecast by Film Thickness, 2020 to 2035
  • Table 66: East Asia Market Volume (MT) Forecast by Film Thickness, 2020 to 2035
  • Table 67: East Asia Market Value (USD Billion) Forecast by Functionality, 2020 to 2035
  • Table 68: East Asia Market Volume (MT) Forecast by Functionality, 2020 to 2035
  • Table 69: East Asia Market Value (USD Billion) Forecast by Degradability, 2020 to 2035
  • Table 70: East Asia Market Volume (MT) Forecast by Degradability, 2020 to 2035
  • Table 71: East Asia Market Value (USD Billion) Forecast by End-Use Industry, 2020 to 2035
  • Table 72: East Asia Market Volume (MT) Forecast by End-Use Industry, 2020 to 2035
  • Table 73: South Asia & Pacific Market Value (USD Billion) Forecast by Country, 2020 to 2035
  • Table 74: South Asia & Pacific Market Volume (MT) Forecast by Country, 2020 to 2035
  • Table 75: South Asia & Pacific Market Value (USD Billion) Forecast by Material Type, 2020 to 2035
  • Table 76: South Asia & Pacific Market Volume (MT) Forecast by Material Type, 2020 to 2035
  • Table 77: South Asia & Pacific Market Value (USD Billion) Forecast by Film Thickness, 2020 to 2035
  • Table 78: South Asia & Pacific Market Volume (MT) Forecast by Film Thickness, 2020 to 2035
  • Table 79: South Asia & Pacific Market Value (USD Billion) Forecast by Functionality, 2020 to 2035
  • Table 80: South Asia & Pacific Market Volume (MT) Forecast by Functionality, 2020 to 2035
  • Table 81: South Asia & Pacific Market Value (USD Billion) Forecast by Degradability, 2020 to 2035
  • Table 82: South Asia & Pacific Market Volume (MT) Forecast by Degradability, 2020 to 2035
  • Table 83: South Asia & Pacific Market Value (USD Billion) Forecast by End-Use Industry, 2020 to 2035
  • Table 84: South Asia & Pacific Market Volume (MT) Forecast by End-Use Industry, 2020 to 2035
  • Table 85: Middle East and Africa Market Value (USD Billion) Forecast by Country, 2020 to 2035
  • Table 86: Middle East and Africa Market Volume (MT) Forecast by Country, 2020 to 2035
  • Table 87: Middle East and Africa Market Value (USD Billion) Forecast by Material Type, 2020 to 2035
  • Table 88: Middle East and Africa Market Volume (MT) Forecast by Material Type, 2020 to 2035
  • Table 89: Middle East and Africa Market Value (USD Billion) Forecast by Film Thickness, 2020 to 2035
  • Table 90: Middle East and Africa Market Volume (MT) Forecast by Film Thickness, 2020 to 2035
  • Table 91: Middle East and Africa Market Value (USD Billion) Forecast by Functionality, 2020 to 2035
  • Table 92: Middle East and Africa Market Volume (MT) Forecast by Functionality, 2020 to 2035
  • Table 93: Middle East and Africa Market Value (USD Billion) Forecast by Degradability, 2020 to 2035
  • Table 94: Middle East and Africa Market Volume (MT) Forecast by Degradability, 2020 to 2035
  • Table 95: Middle East and Africa Market Value (USD Billion) Forecast by End-Use Industry, 2020 to 2035
  • Table 96: Middle East and Africa Market Volume (MT) Forecast by End-Use Industry, 2020 to 2035

List of Figures

  • Figure 1: Global Market Volume (MT) Forecast 2020 to 2035
  • Figure 2: Global Market Pricing Analysis
  • Figure 3: Global Market Value (USD Billion) Forecast 2020 to 2035
  • Figure 4: Global Market Value Share and BPS Analysis by Material Type, 2025 and 2035
  • Figure 5: Global Market Y-o-Y Growth Comparison by Material Type, 2025 to 2035
  • Figure 6: Global Market Attractiveness Analysis by Material Type
  • Figure 7: Global Market Value Share and BPS Analysis by Film Thickness, 2025 and 2035
  • Figure 8: Global Market Y-o-Y Growth Comparison by Film Thickness, 2025 to 2035
  • Figure 9: Global Market Attractiveness Analysis by Film Thickness
  • Figure 10: Global Market Value Share and BPS Analysis by Functionality, 2025 and 2035
  • Figure 11: Global Market Y-o-Y Growth Comparison by Functionality, 2025 to 2035
  • Figure 12: Global Market Attractiveness Analysis by Functionality
  • Figure 13: Global Market Value Share and BPS Analysis by Degradability, 2025 and 2035
  • Figure 14: Global Market Y-o-Y Growth Comparison by Degradability, 2025 to 2035
  • Figure 15: Global Market Attractiveness Analysis by Degradability
  • Figure 16: Global Market Value Share and BPS Analysis by End-Use Industry, 2025 and 2035
  • Figure 17: Global Market Y-o-Y Growth Comparison by End-Use Industry, 2025 to 2035
  • Figure 18: Global Market Attractiveness Analysis by End-Use Industry
  • Figure 19: Global Market Value (USD Billion) Share and BPS Analysis by Region, 2025 and 2035
  • Figure 20: Global Market Y-o-Y Growth Comparison by Region, 2025 to 2035
  • Figure 21: Global Market Attractiveness Analysis by Region
  • Figure 22: North America Market Incremental $ Opportunity, 2025 to 2035
  • Figure 23: Latin America Market Incremental $ Opportunity, 2025 to 2035
  • Figure 24: Western Europe Market Incremental $ Opportunity, 2025 to 2035
  • Figure 25: Eastern Europe Market Incremental $ Opportunity, 2025 to 2035
  • Figure 26: East Asia Market Incremental $ Opportunity, 2025 to 2035
  • Figure 27: South Asia & Pacific Market Incremental $ Opportunity, 2025 to 2035
  • Figure 28: Middle East and Africa Market Incremental $ Opportunity, 2025 to 2035
  • Figure 29: North America Market Value Share and BPS Analysis by Country, 2025 and 2035
  • Figure 30: North America Market Value Share and BPS Analysis by Material Type, 2025 and 2035
  • Figure 31: North America Market Y-o-Y Growth Comparison by Material Type, 2025 to 2035
  • Figure 32: North America Market Attractiveness Analysis by Material Type
  • Figure 33: North America Market Value Share and BPS Analysis by Film Thickness, 2025 and 2035
  • Figure 34: North America Market Y-o-Y Growth Comparison by Film Thickness, 2025 to 2035
  • Figure 35: North America Market Attractiveness Analysis by Film Thickness
  • Figure 36: North America Market Value Share and BPS Analysis by Functionality, 2025 and 2035
  • Figure 37: North America Market Y-o-Y Growth Comparison by Functionality, 2025 to 2035
  • Figure 38: North America Market Attractiveness Analysis by Functionality
  • Figure 39: North America Market Value Share and BPS Analysis by Degradability, 2025 and 2035
  • Figure 40: North America Market Y-o-Y Growth Comparison by Degradability, 2025 to 2035
  • Figure 41: North America Market Attractiveness Analysis by Degradability
  • Figure 42: North America Market Value Share and BPS Analysis by End-Use Industry, 2025 and 2035
  • Figure 43: North America Market Y-o-Y Growth Comparison by End-Use Industry, 2025 to 2035
  • Figure 44: North America Market Attractiveness Analysis by End-Use Industry
  • Figure 45: Latin America Market Value Share and BPS Analysis by Country, 2025 and 2035
  • Figure 46: Latin America Market Value Share and BPS Analysis by Material Type, 2025 and 2035
  • Figure 47: Latin America Market Y-o-Y Growth Comparison by Material Type, 2025 to 2035
  • Figure 48: Latin America Market Attractiveness Analysis by Material Type
  • Figure 49: Latin America Market Value Share and BPS Analysis by Film Thickness, 2025 and 2035
  • Figure 50: Latin America Market Y-o-Y Growth Comparison by Film Thickness, 2025 to 2035
  • Figure 51: Latin America Market Attractiveness Analysis by Film Thickness
  • Figure 52: Latin America Market Value Share and BPS Analysis by Functionality, 2025 and 2035
  • Figure 53: Latin America Market Y-o-Y Growth Comparison by Functionality, 2025 to 2035
  • Figure 54: Latin America Market Attractiveness Analysis by Functionality
  • Figure 55: Latin America Market Value Share and BPS Analysis by Degradability, 2025 and 2035
  • Figure 56: Latin America Market Y-o-Y Growth Comparison by Degradability, 2025 to 2035
  • Figure 57: Latin America Market Attractiveness Analysis by Degradability
  • Figure 58: Latin America Market Value Share and BPS Analysis by End-Use Industry, 2025 and 2035
  • Figure 59: Latin America Market Y-o-Y Growth Comparison by End-Use Industry, 2025 to 2035
  • Figure 60: Latin America Market Attractiveness Analysis by End-Use Industry
  • Figure 61: Western Europe Market Value Share and BPS Analysis by Country, 2025 and 2035
  • Figure 62: Western Europe Market Value Share and BPS Analysis by Material Type, 2025 and 2035
  • Figure 63: Western Europe Market Y-o-Y Growth Comparison by Material Type, 2025 to 2035
  • Figure 64: Western Europe Market Attractiveness Analysis by Material Type
  • Figure 65: Western Europe Market Value Share and BPS Analysis by Film Thickness, 2025 and 2035
  • Figure 66: Western Europe Market Y-o-Y Growth Comparison by Film Thickness, 2025 to 2035
  • Figure 67: Western Europe Market Attractiveness Analysis by Film Thickness
  • Figure 68: Western Europe Market Value Share and BPS Analysis by Functionality, 2025 and 2035
  • Figure 69: Western Europe Market Y-o-Y Growth Comparison by Functionality, 2025 to 2035
  • Figure 70: Western Europe Market Attractiveness Analysis by Functionality
  • Figure 71: Western Europe Market Value Share and BPS Analysis by Degradability, 2025 and 2035
  • Figure 72: Western Europe Market Y-o-Y Growth Comparison by Degradability, 2025 to 2035
  • Figure 73: Western Europe Market Attractiveness Analysis by Degradability
  • Figure 74: Western Europe Market Value Share and BPS Analysis by End-Use Industry, 2025 and 2035
  • Figure 75: Western Europe Market Y-o-Y Growth Comparison by End-Use Industry, 2025 to 2035
  • Figure 76: Western Europe Market Attractiveness Analysis by End-Use Industry
  • Figure 77: Eastern Europe Market Value Share and BPS Analysis by Country, 2025 and 2035
  • Figure 78: Eastern Europe Market Value Share and BPS Analysis by Material Type, 2025 and 2035
  • Figure 79: Eastern Europe Market Y-o-Y Growth Comparison by Material Type, 2025 to 2035
  • Figure 80: Eastern Europe Market Attractiveness Analysis by Material Type
  • Figure 81: Eastern Europe Market Value Share and BPS Analysis by Film Thickness, 2025 and 2035
  • Figure 82: Eastern Europe Market Y-o-Y Growth Comparison by Film Thickness, 2025 to 2035
  • Figure 83: Eastern Europe Market Attractiveness Analysis by Film Thickness
  • Figure 84: Eastern Europe Market Value Share and BPS Analysis by Functionality, 2025 and 2035
  • Figure 85: Eastern Europe Market Y-o-Y Growth Comparison by Functionality, 2025 to 2035
  • Figure 86: Eastern Europe Market Attractiveness Analysis by Functionality
  • Figure 87: Eastern Europe Market Value Share and BPS Analysis by Degradability, 2025 and 2035
  • Figure 88: Eastern Europe Market Y-o-Y Growth Comparison by Degradability, 2025 to 2035
  • Figure 89: Eastern Europe Market Attractiveness Analysis by Degradability
  • Figure 90: Eastern Europe Market Value Share and BPS Analysis by End-Use Industry, 2025 and 2035
  • Figure 91: Eastern Europe Market Y-o-Y Growth Comparison by End-Use Industry, 2025 to 2035
  • Figure 92: Eastern Europe Market Attractiveness Analysis by End-Use Industry
  • Figure 93: East Asia Market Value Share and BPS Analysis by Country, 2025 and 2035
  • Figure 94: East Asia Market Value Share and BPS Analysis by Material Type, 2025 and 2035
  • Figure 95: East Asia Market Y-o-Y Growth Comparison by Material Type, 2025 to 2035
  • Figure 96: East Asia Market Attractiveness Analysis by Material Type
  • Figure 97: East Asia Market Value Share and BPS Analysis by Film Thickness, 2025 and 2035
  • Figure 98: East Asia Market Y-o-Y Growth Comparison by Film Thickness, 2025 to 2035
  • Figure 99: East Asia Market Attractiveness Analysis by Film Thickness
  • Figure 100: East Asia Market Value Share and BPS Analysis by Functionality, 2025 and 2035
  • Figure 101: East Asia Market Y-o-Y Growth Comparison by Functionality, 2025 to 2035
  • Figure 102: East Asia Market Attractiveness Analysis by Functionality
  • Figure 103: East Asia Market Value Share and BPS Analysis by Degradability, 2025 and 2035
  • Figure 104: East Asia Market Y-o-Y Growth Comparison by Degradability, 2025 to 2035
  • Figure 105: East Asia Market Attractiveness Analysis by Degradability
  • Figure 106: East Asia Market Value Share and BPS Analysis by End-Use Industry, 2025 and 2035
  • Figure 107: East Asia Market Y-o-Y Growth Comparison by End-Use Industry, 2025 to 2035
  • Figure 108: East Asia Market Attractiveness Analysis by End-Use Industry
  • Figure 109: South Asia & Pacific Market Value Share and BPS Analysis by Country, 2025 and 2035
  • Figure 110: South Asia & Pacific Market Value Share and BPS Analysis by Material Type, 2025 and 2035
  • Figure 111: South Asia & Pacific Market Y-o-Y Growth Comparison by Material Type, 2025 to 2035
  • Figure 112: South Asia & Pacific Market Attractiveness Analysis by Material Type
  • Figure 113: South Asia & Pacific Market Value Share and BPS Analysis by Film Thickness, 2025 and 2035
  • Figure 114: South Asia & Pacific Market Y-o-Y Growth Comparison by Film Thickness, 2025 to 2035
  • Figure 115: South Asia & Pacific Market Attractiveness Analysis by Film Thickness
  • Figure 116: South Asia & Pacific Market Value Share and BPS Analysis by Functionality, 2025 and 2035
  • Figure 117: South Asia & Pacific Market Y-o-Y Growth Comparison by Functionality, 2025 to 2035
  • Figure 118: South Asia & Pacific Market Attractiveness Analysis by Functionality
  • Figure 119: South Asia & Pacific Market Value Share and BPS Analysis by Degradability, 2025 and 2035
  • Figure 120: South Asia & Pacific Market Y-o-Y Growth Comparison by Degradability, 2025 to 2035
  • Figure 121: South Asia & Pacific Market Attractiveness Analysis by Degradability
  • Figure 122: South Asia & Pacific Market Value Share and BPS Analysis by End-Use Industry, 2025 and 2035
  • Figure 123: South Asia & Pacific Market Y-o-Y Growth Comparison by End-Use Industry, 2025 to 2035
  • Figure 124: South Asia & Pacific Market Attractiveness Analysis by End-Use Industry
  • Figure 125: Middle East and Africa Market Value Share and BPS Analysis by Country, 2025 and 2035
  • Figure 126: Middle East and Africa Market Value Share and BPS Analysis by Material Type, 2025 and 2035
  • Figure 127: Middle East and Africa Market Y-o-Y Growth Comparison by Material Type, 2025 to 2035
  • Figure 128: Middle East and Africa Market Attractiveness Analysis by Material Type
  • Figure 129: Middle East and Africa Market Value Share and BPS Analysis by Film Thickness, 2025 and 2035
  • Figure 130: Middle East and Africa Market Y-o-Y Growth Comparison by Film Thickness, 2025 to 2035
  • Figure 131: Middle East and Africa Market Attractiveness Analysis by Film Thickness
  • Figure 132: Middle East and Africa Market Value Share and BPS Analysis by Functionality, 2025 and 2035
  • Figure 133: Middle East and Africa Market Y-o-Y Growth Comparison by Functionality, 2025 to 2035
  • Figure 134: Middle East and Africa Market Attractiveness Analysis by Functionality
  • Figure 135: Middle East and Africa Market Value Share and BPS Analysis by Degradability, 2025 and 2035
  • Figure 136: Middle East and Africa Market Y-o-Y Growth Comparison by Degradability, 2025 to 2035
  • Figure 137: Middle East and Africa Market Attractiveness Analysis by Degradability
  • Figure 138: Middle East and Africa Market Value Share and BPS Analysis by End-Use Industry, 2025 and 2035
  • Figure 139: Middle East and Africa Market Y-o-Y Growth Comparison by End-Use Industry, 2025 to 2035
  • Figure 140: Middle East and Africa Market Attractiveness Analysis by End-Use Industry
  • Figure 141: Global Market - Tier Structure Analysis
  • Figure 142: Global Market - Company Share Analysis

Frequently Asked Questions

What is the projected size of the biodegradable stretch films market by 2035?

The industry is forecasted to reach USD 6.7 billion by 2035, growing from USD 4.1 billion in 2025.

What is the expected CAGR of the biodegradable stretch films market during 2025 to 2035?

The industry is expected to grow at a compound annual growth rate (CAGR) of 5.0% during the forecast period.

Which material segment leads the biodegradable stretch films market in 2025?

PLA blend films dominate with a 60% material share in 2025.

Which application dominates biodegradable stretch films usage in 2025?

Food packaging accounts for approximately 45% of the total application share in 2025.

Who are the leading players in the biodegradable stretch films market?

Sigma Stretch Film leads with a 12% industry share in 2025.

Explore Similar Insights

Future Market Insights

Biodegradable Stretch Films Market