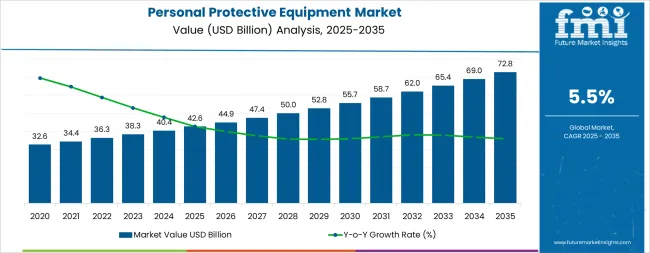
The global personal protective equipment market is projected to reach USD 72.8 billion by 2035, recording an absolute increase of USD 30.3 billion over the forecast period. The market is valued at USD 42.6 billion in 2025 and is set to rise at a CAGR of 5.5% during the assessment period. The overall market size is expected to grow by nearly 1.7 times during the same period, supported by increasing demand for workplace safety equipment and regulatory compliance requirements worldwide, driving demand for efficient protection systems and increasing investments in worker safety modernization and industrial safety projects globally. However, cost sensitivity challenges and complex fit requirements may pose challenges to market expansion.
| Metric | Value |
|---|---|
| Market Value (2025) | USD 42.6 billion |
| Market Forecast Value (2035) | USD 72.8 billion |
| Forecast CAGR (2025-2035) | 5.5% |
Between 2025 and 2030, the personal protective equipment market is projected to expand from USD 42.6 billion to USD 56.8 billion, resulting in a value increase of USD 14.2 billion, which represents 46.9% of the total forecast growth for the decade. This phase of development will be shaped by rising demand for workplace safety and regulatory compliance, product innovation in protection technologies and high-performance safety systems, as well as expanding integration with occupational health and safety initiatives. Companies are establishing competitive positions through investment in advanced protection technologies, ergonomic design solutions, and strategic market expansion across manufacturing, construction, and healthcare applications.
From 2030 to 2035, the market is forecast to grow from USD 56.8 billion to USD 72.8 billion, adding another USD 16.1 billion, which constitutes 53.1% of the overall ten-year expansion. This period is expected to be characterized by the expansion of specialized protection systems, including advanced smart PPE formulations and integrated safety solutions tailored for specific industry requirements, strategic collaborations between equipment manufacturers and end-user industries, and an enhanced focus on production efficiency and regulatory compliance. The growing emphasis on worker safety optimization and advanced protection processes will drive demand for comprehensive, high-performance protective equipment solutions across diverse industrial applications.
The personal protective equipment market grows by enabling employers to achieve superior worker safety and regulatory compliance across industrial facilities, ranging from small-scale manufacturing operations to mega industrial complexes. Industrial operators face mounting pressure to improve workplace safety and regulatory compliance, with personal protective equipment solutions typically providing 30-40% improvement in incident prevention compared to conventional safety measures, making advanced protective equipment essential for competitive industrial operations. The manufacturing industry's need for maximum worker protection creates demand for advanced protection solutions that can minimize workplace injuries, enhance durability, and ensure consistent performance across diverse operational conditions. Government initiatives promoting occupational safety and worker protection drive adoption in manufacturing, construction, and industrial applications, where safety performance has a direct impact on operational efficiency and regulatory compliance. However, raw material price volatility and the complexity of achieving proper fit across different worker populations may limit adoption rates among cost-sensitive employers and developing regions with limited safety expertise.
The market is segmented by product type, end-use industry, and region. By product type, the market is divided into head protection, eye and face protection, hearing protection, hand and arm protection, fall protection, protective clothing, professional footwear, foot & leg protection, and respiratory protection. Based on end-use industry, the market is categorized into healthcare, pharmaceutical manufacturing, food manufacturing, construction, petrochemicals, power & energy, oil & gas, transportation, firefighting, and others. Regionally, the market is divided into North America, Latin America, Western Europe, Eastern Europe, East Asia, South Asia Pacific, and Middle East & Africa.
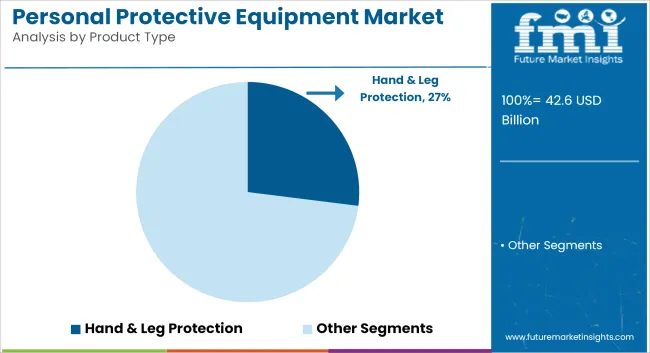
The hand & arm protection segment represents the dominant force in the personal protective equipment market, capturing approximately 27.0% of total market share in 2025. This advanced protection category encompasses formulations featuring superior safety characteristics, including enhanced durability and optimized performance combinations that enable superior operational protection and enhanced resistance characteristics. The hand & leg protection segment's market leadership stems from its exceptional performance capabilities in high-risk work environments, with equipment capable of withstanding hazardous conditions while maintaining consistent performance and safety reliability across diverse operational conditions.
The eye and face protection segment maintains a substantial market share, serving workers who require cost-effective safety solutions for standard applications. These products offer reliable performance for general-purpose industrial applications while providing sufficient protection to meet basic safety requirements in manufacturing and processing applications.
Key technological advantages driving the hand & leg protection segment include:
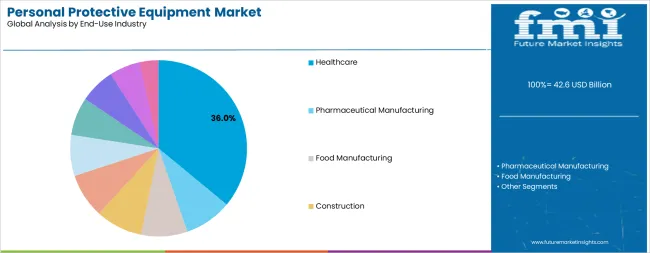
Healthcare applications dominate the personal protective equipment market with approximately 36% market share in 2025, reflecting the critical role of medical safety in serving workplace protection demand and supporting regulatory compliance initiatives. The healthcare segment's market leadership is reinforced by increasing infection control requirements, standardized protection protocols, and rising demand for cost-effective safety solutions that directly correlate with operational efficiency, patient safety, and regulatory adherence in hospitals, clinics, and other healthcare facilities.
The manufacturing and industrial segment represents the second-largest end-use category, capturing significant market share through specialized requirements for factories, production plants, and high-risk industrial procedures. This segment benefits from growing demand for workplace safety systems that meet stringent protection, performance, and compliance requirements in demanding industrial and manufacturing applications.
The construction segment accounts for substantial market share, serving workers requiring specialized protection solutions. The oil & gas segment captures market share through high-risk industrial applications, while other end-use ranges represent specialized market segments, including transportation, firefighting, and other sectors with specific PPE requirements.
Key market dynamics supporting end-use growth include:
The market is driven by three concrete demand factors tied to workplace and safety optimization outcomes. First, global regulatory compliance growth and workplace modernization create increasing demand for high-performance protective equipment solutions, with workplace injuries projected to remain a significant concern, requiring specialized safety solutions for maximum worker protection. Second, modernization of legacy safety systems and regulatory compliance drive the adoption of superior protection technologies, with employers seeking 30-40% improvement in safety performance and regulatory compliance enhancement. Third, technological advancements in materials science and ergonomic technologies enable more effective and comfortable protection systems that reduce compliance barriers while improving long-term performance and cost-effectiveness.
Market restraints include raw material price volatility that can impact production costs and profitability margins, particularly during periods of supply chain disruption or commodity price fluctuations affecting key polymer and textile components. Regulatory complexity in safety compliance poses another significant challenge, as achieving consistent performance standards across different workplace environments and regulatory frameworks requires specialized expertise and quality control systems, potentially causing project delays and increased manufacturing costs. Technical complexity in fit requirements and customization needs create additional challenges for manufacturers, demanding ongoing investment in ergonomic capabilities and compliance with varying regional safety standards.
Key trends indicate accelerated adoption in emerging markets, particularly China, India, and Southeast Asia, where rapid industrial development and workplace safety capacity expansion drive comprehensive protective equipment system development. Technology advancement trends toward smart PPE integration with enhanced monitoring capabilities, real-time safety tracking, and multi-functional equipment capabilities enable next-generation product development that addresses multiple protection requirements simultaneously. However, the market thesis could face disruption if alternative safety technologies or significant changes in workplace practices minimize reliance on traditional personal protective equipment solutions.
| Country | CAGR (2025-2035) |
|---|---|
| United States | 4.8% |
| Japan | 4.7% |
| France | 4.5% |
| Germany | 4.4% |
| United Kingdom | 3.6% |
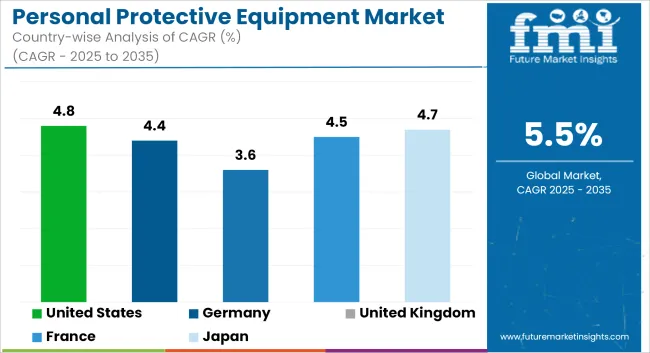
The personal protective equipment market is gaining momentum worldwide, with United States taking the lead thanks to comprehensive occupational safety regulations and government-backed worker protection programs. Close behind, Japan benefits from growing industrial modernization and advanced safety technology initiatives, positioning itself as a strategic growth hub in the Asian region. France shows steady advancement, where integration of advanced safety technologies strengthens its role in the European industrial safety supply chain. Germany is focusing on industrial development and workplace modernization, signaling an ambition to capitalize on growing opportunities in European manufacturing markets. Meanwhile, United Kingdom stands out for its advanced safety technology development in existing industrial applications, recording consistent progress in workplace safety advancement. Together, United States and Japan anchor the global expansion story, while the rest build stability and diversity into the market's growth path.
The report covers an in-depth analysis of 40+ countries top-performing countries are highlighted below.
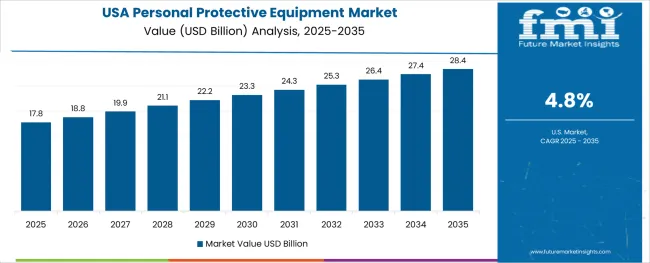
United States demonstrates the strongest growth potential in the Personal Protective Equipment Market with a CAGR of 4.8% through 2035. The country's leadership position stems from comprehensive occupational safety regulations, government-backed worker protection programs, and aggressive workplace safety targets, driving the adoption of high-performance protective equipment systems. Growth is concentrated in major industrial regions, including Texas, California, Illinois, and Ohio, where manufacturing companies and industrial operators are implementing advanced protection solutions for enhanced safety performance and regulatory competitiveness. Distribution channels through established safety suppliers and direct manufacturer relationships expand deployment across manufacturing facilities and industrial processing centers. The country's safety leadership strategy provides policy support for advanced protection development, including high-performance equipment system adoption.
Key market factors:
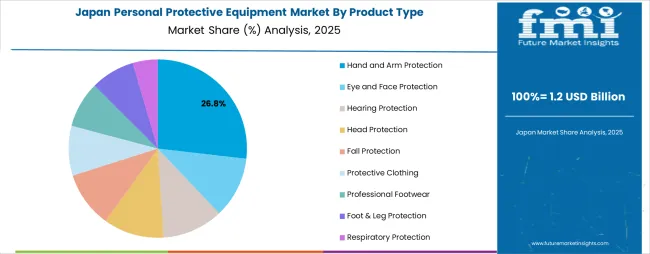
In Tokyo, Osaka, Yokohama, and Nagoya, the adoption of personal protective equipment systems is accelerating across industrial facilities and manufacturing centers, driven by workplace safety targets and government industrial modernization initiatives. The market demonstrates strong growth momentum with a CAGR of 4.7% through 2035, linked to comprehensive industrial capacity expansion and increasing focus on operational safety solutions. Japanese manufacturers are implementing advanced protection systems and quality control platforms to enhance worker safety while meeting growing demand for industrial products in domestic and export markets. The country's industrial development programs create continued demand for high-performance protection solutions, while increasing emphasis on local manufacturing drives adoption of advanced technologies and safety systems.
France's advanced industrial sector demonstrates sophisticated implementation of personal protective equipment systems, with documented case studies showing safety improvements in manufacturing applications through optimized protection solutions. The country's industrial infrastructure in major manufacturing centers, including Île-de-France, Rhône-Alpes, Nord-Pas-de-Calais, and Provence-Alpes-Côte d'Azur, showcases integration of advanced safety technologies with existing operational systems, leveraging expertise in industrial processing and precision manufacturing. French manufacturers emphasize quality standards and regulatory compliance, creating demand for high-performance safety solutions that support efficiency initiatives and regulatory requirements. The market maintains steady growth through focus on industrial innovation and safety competitiveness, with a CAGR of 4.5% through 2035.
Key development areas:
Germany's market expansion is driven by diverse industrial demand, including safety equipment in Munich and Frankfurt regions, manufacturing development in Stuttgart and Düsseldorf, and comprehensive industrial modernization across multiple manufacturing areas. The country demonstrates promising growth potential with a CAGR of 4.4% through 2035, supported by national industrial programs and regional safety development initiatives. German manufacturers face implementation challenges related to technology integration and worker compliance requirements, requiring safety upgrade approaches and international partnership support. However, growing industrial targets and safety competitiveness requirements create compelling business cases for protective equipment system adoption, particularly in manufacturing regions where safety performance has a direct impact on operational competitiveness.
Market characteristics:
United Kingdom's market leads in advanced safety innovation based on integration with next-generation industrial technologies and sophisticated protection applications for enhanced safety characteristics. The country shows solid potential with a CAGR of 3.6% through 2035, driven by industrial modernization programs and advanced safety initiatives across major manufacturing regions, including England, Scotland, Wales, and Northern Ireland. British manufacturers are adopting advanced protection systems for safety optimization and regulatory compliance, particularly in regions with industrial mandates and advanced processing facilities requiring superior safety differentiation. Technology deployment channels through established safety distributors and direct manufacturer relationships expand coverage across manufacturing facilities and industrial processing operations.
Leading market segments:
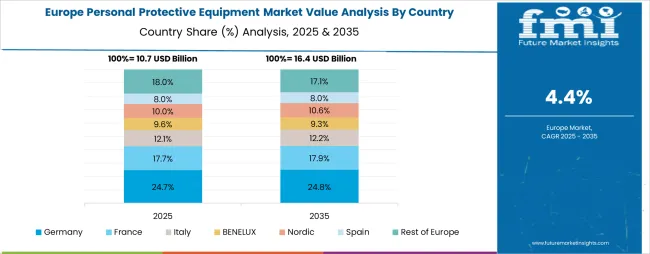
The personal protective equipment market in Europe is projected to grow from USD 9.8 billion in 2025 to USD 15.2 billion by 2035, registering a CAGR of 4.5% over the forecast period. Germany is expected to maintain its leadership position with a 24.8% market share in 2025, declining slightly to 24.4% by 2035, supported by its extensive industrial infrastructure and major manufacturing centers, including Bavaria, North Rhine-Westphalia, and Baden-Württemberg production facilities.
France follows with a 21.2% share in 2025, projected to reach 21.6% by 2035, driven by comprehensive industrial development programs and advanced safety initiatives implementing protection technologies. United Kingdom holds a 18.9% share in 2025, expected to maintain 18.5% by 2035 through ongoing industrial facility upgrades and safety technology development. Italy commands a 16.3% share, while Spain accounts for 12.1% in 2025. The Rest of Europe region is anticipated to gain momentum, expanding its collective share from 6.7% to 7.8% by 2035, attributed to increasing personal protective equipment adoption in Nordic countries and emerging Eastern European manufacturing facilities implementing advanced safety programs.
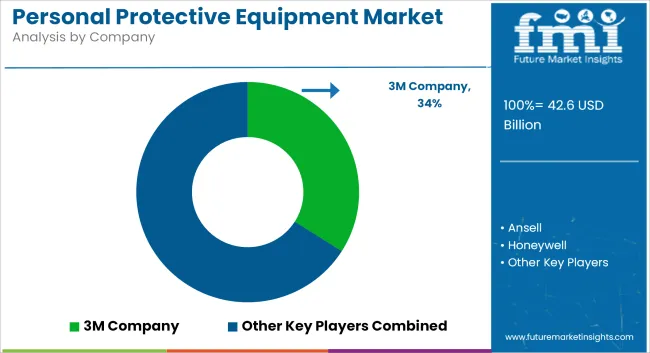
The personal protective equipment market features approximately 20-25 meaningful players with moderate concentration, where the top three companies control roughly 28-35% of global market share through established safety platforms and extensive industrial equipment relationships. Competition centers on product quality, regulatory compliance, and technical innovation rather than price competition alone.
Market leaders include 3M Company, Honeywell Life Safety, and Ansell Healthcare Products LLC, which maintain competitive advantages through comprehensive safety solution portfolios, global manufacturing networks, and deep expertise in the industrial safety and worker protection sectors, creating high switching costs for customers. These companies leverage research and development capabilities and ongoing technical support relationships to defend market positions while expanding into adjacent industrial and commercial applications.
Challengers encompass Rahman Group and JSP Limited, which compete through specialized safety solutions and strong regional presence in key manufacturing markets. Technology specialists, including Oftenrich Holdings Co. Ltd., Golden Chang, and Gateway Safety Inc., focus on specific product configurations or vertical applications, offering differentiated capabilities in materials technology, customization services, and specialized performance characteristics.
Regional players and emerging safety providers create competitive pressure through cost-effective solutions and rapid customization capabilities, particularly in high-growth markets including India, China, and Southeast Asia, where local presence provides advantages in customer service and regulatory compliance. Market dynamics favor companies that combine advanced safety technologies with comprehensive technical support offerings that address the complete equipment lifecycle from design development through ongoing performance optimization.
Personal protective equipment represents specialized safety systems that enable employers to achieve 30-40% improvement in workplace safety compared to conventional protection systems, delivering superior worker protection and injury reduction with enhanced compliance capabilities in demanding industrial applications. With the market projected to grow from USD 42.6 billion in 2025 to USD 72.8 billion by 2035 at a 5.5% CAGR, these safety systems offer compelling advantages - enhanced worker protection, customizable safety configurations, and operational durability - making them essential for manufacturing applications, construction operations, and industrial facilities seeking alternatives to inefficient safety systems that compromise protection through inadequate performance. Scaling market adoption and technological advancement requires coordinated action across safety policy, industrial standards development, equipment manufacturers, processing industries, and safety technology investment capital.
How Governments Could Spur Local Production and Adoption?
How Industry Bodies Could Support Market Development?
How OEMs and Technology Players Could Strengthen the Ecosystem?
How Suppliers Could Navigate the Shift?
How Investors and Financial Enablers Could Unlock Value?
| Items | Values |
|---|---|
| Quantitative Units | USD 42.6 billion |
| Product Type | Head Protection, Eye and Face Protection, Hearing Protection, Hand and Arm Protection, Fall Protection, Protective Clothing, Professional Footwear, Foot & Leg Protection, Respiratory Protection |
| End-Use Industry | Healthcare, Pharmaceutical Manufacturing, Food Manufacturing, Construction, Petrochemicals, Power & Energy, Oil & Gas, Transportation, Firefighting, Others |
| Regions Covered | North America, Latin America, Western Europe, Eastern Europe, East Asia, South Asia Pacific, Middle East & Africa |
| Country Covered | United States, Japan, France, Germany, United Kingdom, and 40+ countries |
| Key Companies Profiled | 3M Company, Rahman Group, Oftenrich Holdings Co. Ltd., Golden Chang, JSP Limited, Jallatte Group, Honeywell Life Safety, Gateway Safety Inc., Ansell Healthcare Products LLC |
| Additional Attributes | Dollar sales by product type and end-use industry categories, regional adoption trends across North America, East Asia, and South Asia Pacific, competitive landscape with safety providers and technology integrators, industrial facility requirements and specifications, integration with workplace safety initiatives and protection systems, innovations in safety technology and protection systems, and development of specialized configurations with performance and durability capabilities. |
The global personal protective equipment market is estimated to be valued at USD 42.6 billion in 2025.
The market size for the personal protective equipment market is projected to reach USD 72.8 billion by 2035.
The personal protective equipment market is expected to grow at a 5.5% CAGR between 2025 and 2035.
The key product types in personal protective equipment market are hand and arm protection, eye and face protection, hearing protection, head protection, fall protection, protective clothing, professional footwear, foot & leg protection and respiratory protection.
In terms of end-use industry, healthcare segment to command 36.0% share in the personal protective equipment market in 2025.


Full Research Suite comprises of:
Market outlook & trends analysis
Interviews & case studies
Strategic recommendations
Vendor profiles & capabilities analysis
5-year forecasts
8 regions and 60+ country-level data splits
Market segment data splits
12 months of continuous data updates
DELIVERED AS:
PDF EXCEL ONLINE
Personal Protective Equipment Packaging Market
Personal Care Ingredient Market Size and Share Forecast Outlook 2025 to 2035
Personality Assessment Solution Market Size and Share Forecast Outlook 2025 to 2035
Personalized Immunotherapy Market Size and Share Forecast Outlook 2025 to 2035
Personal Care Appliances Market Size and Share Forecast Outlook 2025 to 2035
Personal Navigation Devices Market Size and Share Forecast Outlook 2025 to 2035
Personal Genome Testing Market Size and Share Forecast Outlook 2025 to 2035
Personal Watercraft Jet Ski Market Size and Share Forecast Outlook 2025 to 2035
Personalized Packaging Market Size and Share Forecast Outlook 2025 to 2035
Personalized Toys Market Size and Share Forecast Outlook 2025 to 2035
Personal Care Wipes Market Size and Share Forecast Outlook 2025 to 2035
Personalized Nutrition Market - Size, Share, and Forecast Outlook 2025 to 2035
Personal Watercraft Market Growth - Trends & Forecast 2025 to 2035
Personal Mobility Devices Market Analysis - Trends, Growth & Forecast 2025 to 2035
Personalized Beauty Devices Market Trends - Growth & Forecast 2025 to 2035
Personalized Bakery Products Market Analysis by Product Type, Price Range, Sales Channel, End-User and Region 2025 to 2035
Personal CRM Market Report - Growth & Forecast 2025 to 2035
Personal Care and Cosmetics Microalgae Market - Beauty & Skincare Trends 2025 to 2035
Personalized Medicine Market is segmented by Personalized Medicine Diagnostics, Medicine Therapeutics, and Medical Care from 2025 to 2035
Personal Fitness Trainer Market - Trends, Growth & Forecast 2025 to 2035

Thank you!
You will receive an email from our Business Development Manager. Please be sure to check your SPAM/JUNK folder too.
Chat With
MaRIA