Reports

- Global Locations -

Headquarters

Future Market Insights, Inc.

Christiana Corporate, 200
Continental Drive, Suite 401,
Newark, Delaware - 19713,
United States

T: +1-845-579-5705

Americas

Future Market Insights, Inc.

616 Corporate Way, Suite 2-9018,
Valley Cottage, NY 10989, United States

T: +1-347-918-3531

MEA

Future Market Insights

1602-6 Jumeirah Bay X2 Tower, Plot No: JLT-PH2-X2A,
Jumeirah Lakes Towers, Dubai,
United Arab Emirates

Europe

Future Market Insights

3rd Floor, 207 Regent Street,
W1B 3HH London
United Kingdom

T: + 44 (0) 20 8123 9659
D: +44 (0) 20 3287 4268

Asia Pacific

Future Market Insights

IndiaLand Global Tech Park, Unit UG-1, Behind Grand HighStreet, Phase 1, Hinjawadi, MH, Pune – 411057, India

Personal Genome Testing Market Outlook (2022-2032)

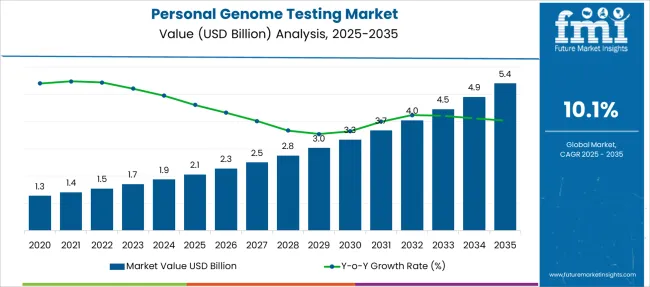
[323 Pages Report] The global personal genome testing market is forecast to be appraised at US$ 4,468 Million by 2032, up from US$ 1,545.5 Million in 2022, advancing at a CAGR of 10.1% during the forecast period.

Attributes Details
Personal Genome Testing Market Size (2022) US$ 1,545.5 Million
Personal Genome Testing Market Size (2032) US$ 4,468 Million
Personal Genome Testing Market CAGR (2022 to 2032) 10.1%

The advancements in the field of genetic testing, along with its wide usage in pharmacogenomics and toxicogenomic, drives the demands for personal genome testing. Increasing deployment of paternity testing, maternity testing, and prenatal testing promotes personal genome testing market growth.

The increased and developing awareness among healthcare professionals regarding the efficacy of these diagnostics owing to strong testing volumes ordered and managed by non-geneticists surges the adoption of personal genome testing.

Lifestyle-based and nutrition-based genetic tests are widely available for aiding diet and lifestyle plans among consumers, increasing demand for personal genome testing. The accuracy and reliable technology of genetic testing, and the growing awareness about its benefits, propels the personal genome testing market share.

Don't pay for what you don't need

Customize your report by selecting specific countries or regions and save 30%!

What are the Key Factors that Drive the Personal Genome Testing Market?

With the expansion of DTC genetic tests' application areas, the market share for personal genome testing increases. The market for personal genome testing is being expanded by businesses that provide DTC tests for use in continuing research, sports, nutrition, and other areas.

The range of services offered by genetic testing, such as data security, identification of ancestors, race and nature of family, increasing its usage in clinical practices, surges demand for personal genome testing.

The low cost value of genome testing across clinics, ranging from US$ 99 to US$ 2000, drives the demand for personal genome testing. Rising prevalence of genetic diseases related to genotype, phenotype, or mutation, and its need for detection and prevention propels the personal genome testing market growth.

The ability to detect genetic abnormalities in the early gestation period of 8 to 10 weeks surges the demand for personal genome testing. Growing R&D activities, along with government initiatives in the field, escalates the adoption of personal genome testing.

Increasing awareness and discoveries in the field of genetic testing, as well as the option to determine the sex of a fetus, broadens the personal genome testing market share. Descriptive information regarding analytical validity and clinical validity of the tests offered by the service provide, increases the demand for personal genome testing.

The requirement for identification and addressing of specific needs, personalized direct-to-consumer genetic tests, escalates the personal genome testing market size. Favorable reimbursement policies and increasing coverage for preventative genetic testing elevate the personal genome testing market share.

What are the Restraints of the Personal Genome Testing Market?

Due to the shortage of trained professionals, end users face significant issues in analyzing genomic data, hindering the personal genome testing market growth. Rigid regulatory requirements for product approvals are expected to hamper the demand for personal genome testing.

The personal genome testing market size is further obstructed owing to standardization concerns of genetic testing-based diagnostics.

Furthermore, the unavailability of doctors and genetic counselors, along with closing of test-running laboratories leading to disruption, limitation and challenges during the pandemic, hampered the adoption of personal genome testing.

Scepticism and criticism regarding genetic testing from healthcare professionals, owing to lack of evidence, thwarts the personal genome testing market share.

The desire for personal genome testing is curbed by the loss of discretion and control over customers' genetic material, as well as the risk that testing procedures could lead to a third party accessing clients' DNA information.

Sabyasachi Ghosh
Sabyasachi Ghosh

Principal Consultant

Talk to Analyst

Find your sweet spots for generating winning opportunities in this market.

What are the Scopes of the Personal Genome Testing Market?

Unexplored emerging markets in developing economies and a high number of customers opting for online genetic testing are anticipated to promote the global personal genome testing market growth.

Moreover, the adoption of personal genome testing increases owing to the growth in the personalized medicine market, especially among the pharmaceutical companies. The shift of focus from clinical science to bioinformatics, and the increasing popularity of these techniques, increases the demand for personal genome testing.

Increased efficiency, accuracy, and new innovations and techniques further propel the demand for personal genome testing.
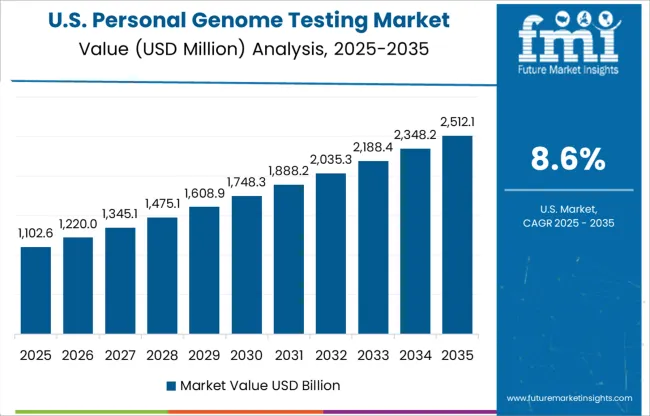
How will the North American Personal Genome Testing Market Grow?

North America holds the leading position in the personal genome testing market share, with a revenue of 37.3%.

This is owing to the rise in cases of genetic diseases and an increasing demand for technologically advanced medical equipment for treatment. The availability of a substantial number of key players dealing with genetic tests in this region surges the demand for personal genome testing.

High awareness about at-home testing among the U.S. population promotes the global personal genome testing market growth.
Get the data you need at a Fraction of the cost

Personalize your report by choosing insights you need
and save 40%!

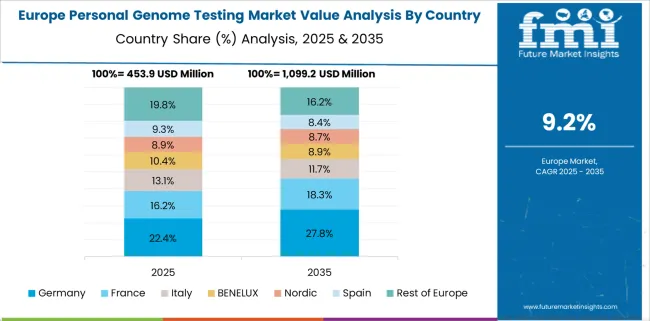
What is the Europe Personal Genome Testing Market Outlook?

Europe has the second leading personal genome testing market share, with a revenue share of 26%.

The rising demand for technologically advanced medical equipment for treatment in this region promotes personal genome testing market growth.

The presence of key players, as well as new players entering the market causing competition, secures the expansion of the personal genome testing market size.

What is the Growth Outlook for the Asia Pacific Personal Genome Testing Market?

Due to rising knowledge of the advantages of genetic testing, the personal genome testing market share is predicted to increase in Asia-Pacific. Personal genome testing is becoming more popular as a result of growing awareness of numerous genetic illnesses and an increase in their prevalence in this area.

Rapid development of healthcare infrastructures across Asian countries further promotes market growth.

How is the Start-up Ecosystem in the Personal Genome Testing Market?

Several market players, through research and development activities, are coming up with innovative strategies to refine genetic testing in clinics. They are also implementing schemes to protect the privacy of their clients’ DNA information.

Emerging players such as 3x4 Genetics, 3billion, CircaGene, Bione, Athletic Genetix, etc. are offering various services such as DNA-based fitness programs, genetic testing for rare diseases, personalized genetic test platforms, microbiome testing, genetic testing for athletes, etc.
What are the Key Developments of the Personal Genome Testing Market?

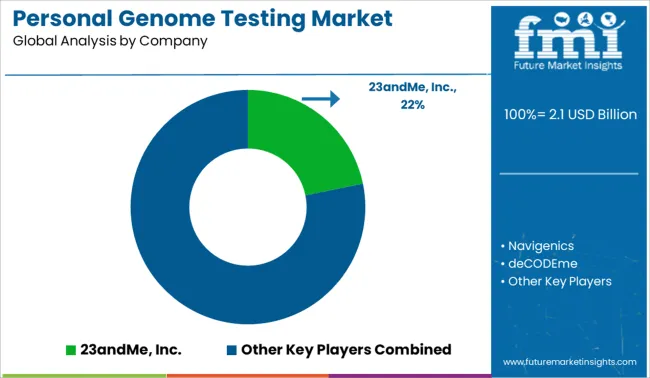
Some of the key market participants in the personal genome testing market are 23andMe Inc., Navigenics, deCODEme, Color Genomics Inc., Personal Genome Diagnostics Inc., Counsyl, Inc., Quest Diagnostics, Gene By Gene Ltd., Laboratory Corporation of America Holdings, Thermo Fisher Scientific, QIAGEN N.V., Agilent Technologies, Inc., F. Hoffmann-La Roche Ltd., Bio-Rad Laboratories Inc., BGI, MYRIAD GENETICS, INC. (MYRIAD RBM, INC.), Eurofins Scientific, CSL Ltd., Abbott Laboratories, Invitae Corporation, Ambry Genetics, BioReference, Progenity Inc., and others are coming up with new innovations to perfect the extraction of genetic material.

Rising cases of chronic diseases are increasing the adoption of personal genome testing. This is attributed to the growth of key players in the market, which is increasing competitiveness in the market, surging the demand for personal genome testing.

Some Of The Recent Developments In The Personal Genome Testing Market Are

  • In February 2019, a funding of US$ 22.7 Mn, in addition to funding of US$ 33.4 Mn by provincial governments, was announced by the Minister of Science and Sport (Canada), to support 36 research projects through Genome Canada.
  • In January 2020, the “Genome India Project” was initiated by the Department of Biotechnology (DBT) to collect 10,000 samples from citizens across India to build a reference genome.
  • In 2020, QIAGEN acquired NeuMoDx Molecular to strengthen its leadership position in automated molecular testing.
  • In March 2022, Genome sequencing group Illumina launched a cancer test in Europe that checks for a wide range of tumor genes in one tissue sample, to help patients with rare diseases be matched up with treatment options.

Scope of Report

Report Attribute Details
Growth Rate CAGR of 10.1% from 2022 to 2032
Base year for estimation 2021
Historical data 2015 to 2020
Forecast period 2022 to 2032
Quantitative units Revenue in USD million and CAGR from 2022 to 2032
Report coverage Revenue forecast, volume forecast, company ranking, competitive landscape, growth factors, and trends, Pricing Analysis,
Segments covered Type, Application, and Region.
Regional scope North America; Western Europe, Eastern Europe, Middle East, Africa, ASEAN, South Asia, Rest of Asia, Australia and New Zealand
Country scope USA; Canada; Mexico; Germany; UK; France; Italy; Spain; Russia; Belgium; Poland; Czech Republic; China; India; Japan; Australia; Brazil; Argentina; Colombia; Saudi Arabia; UAE; Iran; South Africa
Key companies profiled
  • 23andMe Inc.
  • Navigenics
  • deCODEme
  • Color Genomics Inc.
  • Personal Genome Diagnostics Inc.
  • Counsyl, Inc.
  • Quest Diagnostics
  • Gene By Gene Ltd.
  • Laboratory Corporation of America Holdings
  • Thermo Fisher Scientific
  • QIAGEN N.V.
  • Agilent Technologies, Inc.
  • F. Hoffmann-La Roche Ltd.
  • Bio-Rad Laboratories Inc.
  • BGI, MYRIAD GENETICS, INC. (MYRIAD RBM, INC.)
  • Eurofins Scientific
  • CSL Ltd.
  • Abbott Laboratories
  • Invitae Corporation
  • Ambry Genetics
  • BioReference
  • Progenity Inc.
  • Burning Rock Biotech Ltd.
  • Celera Group
  • PerkinElmer Inc.
  • Quest Diagnostics Inc.
  • ELITech Group
  • Roche Diagnostics Corp.
  • Applied Biosystems Inc.
  • Roche Molecular Diagnostics Inc.
  • Transgenomic Inc.
  • Color Genomics
  • EasyDNA
  • Family Tree DNA
  • Full Genome Corporation Inc.
  • Helix OpCo LLC
  • Karmagenes SA
  • Living DNA Ltd.
  • MyHeritage
  • 24 Genetics
  • The SkinDNA Company Pty Ltd
  • DNA Forensics Laboratory Pvt. Ltd.
Customization scope Free report customization (equivalent to up to 8 analysts working days) with purchase. Addition or alteration to country, regional & segment scope.
Pricing and purchase options Avail customized purchase options to meet your exact research needs.

Key Segments

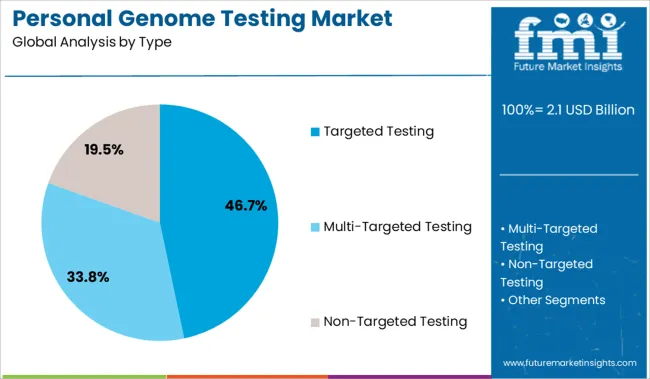
By Type:

  • Multi-Targeted Testing
  • Non-Targeted Testing
  • Targeted Testing

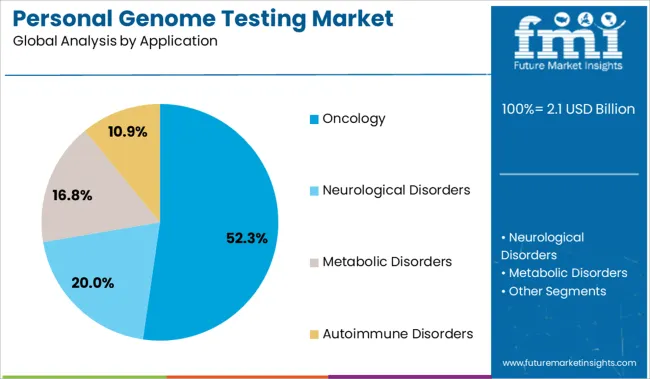
By Application:

  • Neurological Disorders
  • Oncology
  • Metabolic Disorders
  • Autoimmune Disorders

By Region:

  • North America
  • Latin America
  • MEA
  • Asia Pacific
  • Europe

Frequently Asked Questions

How much CAGR can be Estimated for the Personal Genome Testing Market?

Ans. Personal genome testing is likely to register a CAGR of 10.1% during the forecast period.

What is the Leading Regional Market of Personal Genome Testing?

North America is the leading personal genome testing market, with a revenue share of 37.3%.

What will be the Size of the Personal Genome Testing Market by 2032?

By 2032, the market is likely to grow to a valuation of US$ 4,468 Mn.

Table of Content

1. Executive Summary

    1.1. Global Market Outlook

    1.2. Demand-side Trends

    1.3. Supply-side Trends

    1.4. Technology Roadmap Analysis

    1.5. Analysis and Recommendations

2. Market Overview

    2.1. Market Coverage / Taxonomy

    2.2. Market Definition / Scope / Limitations

3. Market Background

    3.1. Market Dynamics

        3.1.1. Drivers

        3.1.2. Restraints

        3.1.3. Opportunity

        3.1.4. Trends

    3.2. Scenario Forecast

        3.2.1. Demand in Optimistic Scenario

        3.2.2. Demand in Likely Scenario

        3.2.3. Demand in Conservative Scenario

    3.3. Opportunity Map Analysis

    3.4. Investment Feasibility Matrix

    3.5. PESTLE and Porter’s Analysis

    3.6. Regulatory Landscape

        3.6.1. By Key Regions

        3.6.2. By Key Countries

    3.7. Regional Parent Market Outlook

4. Global Personal Genome Testing Market Analysis 2017-2021 and Forecast, 2022-2032

    4.1. Historical Market Size Value (US$ Mn) Analysis, 2017-2021

    4.2. Current and Future Market Size Value (US$ Mn) Projections, 2022-2032

        4.2.1. Y-o-Y Growth Trend Analysis

        4.2.2. Absolute $ Opportunity Analysis

5. Global Personal Genome Testing Market Analysis 2017-2021 and Forecast 2022-2032, By Application

    5.1. Introduction / Key Findings

    5.2. Historical Market Size Value (US$ Mn) Analysis By Application, 2017-2021

    5.3. Current and Future Market Size Value (US$ Mn) Analysis and Forecast By Application, 2022-2032

        5.3.1. Neurological Disorders

        5.3.2. Oncology

        5.3.3. Metabolic Disorders

        5.3.4. Autoimmune Disorders

        5.3.5. Others

    5.4. Y-o-Y Growth Trend Analysis By Application, 2017-2021

    5.5. Absolute $ Opportunity Analysis By Application, 2022-2032

6. Global Personal Genome Testing Market Analysis 2017-2021 and Forecast 2022-2032, By Product Type

    6.1. Introduction / Key Findings

    6.2. Historical Market Size Value (US$ Mn) Analysis By Product Type, 2017-2021

    6.3. Current and Future Market Size Value (US$ Mn) Analysis and Forecast By Product Type, 2022-2032

        6.3.1. Targeted Testing

        6.3.2. Non-Targeted Testing

        6.3.3. Multi-Targeted Testing

    6.4. Y-o-Y Growth Trend Analysis By Product Type, 2017-2021

    6.5. Absolute $ Opportunity Analysis By Product Type, 2022-2032

7. Global Personal Genome Testing Market Analysis 2017-2021 and Forecast 2022-2032, By Region

    7.1. Introduction

    7.2. Historical Market Size Value (US$ Mn) Analysis By Region, 2017-2021

    7.3. Current Market Size Value (US$ Mn) Analysis and Forecast By Region, 2022-2032

        7.3.1. North America

        7.3.2. Latin America

        7.3.3. Europe

        7.3.4. Asia Pacific

        7.3.5. MEA

    7.4. Market Attractiveness Analysis By Region

8. North America Personal Genome Testing Market Analysis 2017-2021 and Forecast 2022-2032, By Country

    8.1. Historical Market Size Value (US$ Mn) Trend Analysis By Market Taxonomy, 2017-2021

    8.2. Market Size Value (US$ Mn) Forecast By Market Taxonomy, 2022-2032

        8.2.1. By Country

            8.2.1.1. U.S.

            8.2.1.2. Canada

        8.2.2. By Application

        8.2.3. By Product Type

    8.3. Market Attractiveness Analysis

        8.3.1. By Country

        8.3.2. By Application

        8.3.3. By Product Type

    8.4. Key Takeaways

9. Latin America Personal Genome Testing Market Analysis 2017-2021 and Forecast 2022-2032, By Country

    9.1. Historical Market Size Value (US$ Mn) Trend Analysis By Market Taxonomy, 2017-2021

    9.2. Market Size Value (US$ Mn) Forecast By Market Taxonomy, 2022-2032

        9.2.1. By Country

            9.2.1.1. Brazil

            9.2.1.2. Mexico

            9.2.1.3. Rest of Latin America

        9.2.2. By Application

        9.2.3. By Product Type

    9.3. Market Attractiveness Analysis

        9.3.1. By Country

        9.3.2. By Application

        9.3.3. By Product Type

    9.4. Key Takeaways

10. Europe Personal Genome Testing Market Analysis 2017-2021 and Forecast 2022-2032, By Country

    10.1. Historical Market Size Value (US$ Mn) Trend Analysis By Market Taxonomy, 2017-2021

    10.2. Market Size Value (US$ Mn) Forecast By Market Taxonomy, 2022-2032

        10.2.1. By Country

            10.2.1.1. Germany

            10.2.1.2. U.K.

            10.2.1.3. France

            10.2.1.4. Spain

            10.2.1.5. Italy

            10.2.1.6. Rest of Europe

        10.2.2. By Application

        10.2.3. By Product Type

    10.3. Market Attractiveness Analysis

        10.3.1. By Country

        10.3.2. By Application

        10.3.3. By Product Type

    10.4. Key Takeaways

11. Asia Pacific Personal Genome Testing Market Analysis 2017-2021 and Forecast 2022-2032, By Country

    11.1. Historical Market Size Value (US$ Mn) Trend Analysis By Market Taxonomy, 2017-2021

    11.2. Market Size Value (US$ Mn) Forecast By Market Taxonomy, 2022-2032

        11.2.1. By Country

            11.2.1.1. China

            11.2.1.2. Japan

            11.2.1.3. South Korea

            11.2.1.4. Malaysia

            11.2.1.5. Singapore

            11.2.1.6. Australia

            11.2.1.7. Rest of Asia Pacific

        11.2.2. By Application

        11.2.3. By Product Type

    11.3. Market Attractiveness Analysis

        11.3.1. By Country

        11.3.2. By Application

        11.3.3. By Product Type

    11.4. Key Takeaways

12. MEA Personal Genome Testing Market Analysis 2017-2021 and Forecast 2022-2032, By Country

    12.1. Historical Market Size Value (US$ Mn) Trend Analysis By Market Taxonomy, 2017-2021

    12.2. Market Size Value (US$ Mn) Forecast By Market Taxonomy, 2022-2032

        12.2.1. By Country

            12.2.1.1. GCC Countries

            12.2.1.2. South Africa

            12.2.1.3. Israel

            12.2.1.4. Rest of MEA

        12.2.2. By Application

        12.2.3. By Product Type

    12.3. Market Attractiveness Analysis

        12.3.1. By Country

        12.3.2. By Application

        12.3.3. By Product Type

    12.4. Key Takeaways

13. Key Countries Personal Genome Testing Market Analysis

    13.1. U.K.

        13.1.1. Pricing Analysis

        13.1.2. Market Share Analysis, 2021

            13.1.2.1. By Application

            13.1.2.2. By Product Type

    13.2. Canada

        13.2.1. Pricing Analysis

        13.2.2. Market Share Analysis, 2021

            13.2.2.1. By Application

            13.2.2.2. By Product Type

    13.3. Brazil

        13.3.1. Pricing Analysis

        13.3.2. Market Share Analysis, 2021

            13.3.2.1. By Application

            13.3.2.2. By Product Type

    13.4. Mexico

        13.4.1. Pricing Analysis

        13.4.2. Market Share Analysis, 2021

            13.4.2.1. By Application

            13.4.2.2. By Product Type

    13.5. Rest of Latin America

        13.5.1. Pricing Analysis

        13.5.2. Market Share Analysis, 2021

            13.5.2.1. By Application

            13.5.2.2. By Product Type

    13.6. Germany

        13.6.1. Pricing Analysis

        13.6.2. Market Share Analysis, 2021

            13.6.2.1. By Application

            13.6.2.2. By Product Type

    13.7. U.K.

        13.7.1. Pricing Analysis

        13.7.2. Market Share Analysis, 2021

            13.7.2.1. By Application

            13.7.2.2. By Product Type

    13.8. France

        13.8.1. Pricing Analysis

        13.8.2. Market Share Analysis, 2021

            13.8.2.1. By Application

            13.8.2.2. By Product Type

    13.9. Spain

        13.9.1. Pricing Analysis

        13.9.2. Market Share Analysis, 2021

            13.9.2.1. By Application

            13.9.2.2. By Product Type

    13.10. Italy

        13.10.1. Pricing Analysis

        13.10.2. Market Share Analysis, 2021

            13.10.2.1. By Application

            13.10.2.2. By Product Type

    13.11. Rest of Europe

        13.11.1. Pricing Analysis

        13.11.2. Market Share Analysis, 2021

            13.11.2.1. By Application

            13.11.2.2. By Product Type

    13.12. China

        13.12.1. Pricing Analysis

        13.12.2. Market Share Analysis, 2021

            13.12.2.1. By Application

            13.12.2.2. By Product Type

    13.13. Japan

        13.13.1. Pricing Analysis

        13.13.2. Market Share Analysis, 2021

            13.13.2.1. By Application

            13.13.2.2. By Product Type

    13.14. South Korea

        13.14.1. Pricing Analysis

        13.14.2. Market Share Analysis, 2021

            13.14.2.1. By Application

            13.14.2.2. By Product Type

    13.15. Malaysia

        13.15.1. Pricing Analysis

        13.15.2. Market Share Analysis, 2021

            13.15.2.1. By Application

            13.15.2.2. By Product Type

    13.16. Singapore

        13.16.1. Pricing Analysis

        13.16.2. Market Share Analysis, 2021

            13.16.2.1. By Application

            13.16.2.2. By Product Type

    13.17. Australia

        13.17.1. Pricing Analysis

        13.17.2. Market Share Analysis, 2021

            13.17.2.1. By Application

            13.17.2.2. By Product Type

    13.18. Rest of Asia Pacific

        13.18.1. Pricing Analysis

        13.18.2. Market Share Analysis, 2021

            13.18.2.1. By Application

            13.18.2.2. By Product Type

    13.19. GCC Countries

        13.19.1. Pricing Analysis

        13.19.2. Market Share Analysis, 2021

            13.19.2.1. By Application

            13.19.2.2. By Product Type

    13.20. South Africa

        13.20.1. Pricing Analysis

        13.20.2. Market Share Analysis, 2021

            13.20.2.1. By Application

            13.20.2.2. By Product Type

    13.21. Israel

        13.21.1. Pricing Analysis

        13.21.2. Market Share Analysis, 2021

            13.21.2.1. By Application

            13.21.2.2. By Product Type

    13.22. Rest of MEA

        13.22.1. Pricing Analysis

        13.22.2. Market Share Analysis, 2021

            13.22.2.1. By Application

            13.22.2.2. By Product Type

14. Market Structure Analysis

    14.1. Competition Dashboard

    14.2. Competition Benchmarking

    14.3. Market Share Analysis of Top Players

        14.3.1. By Regional

        14.3.2. By Application

        14.3.3. By Product Type

15. Competition Analysis

    15.1. Competition Deep Dive

        15.1.1. 23andMe, Inc.

            15.1.1.1. Overview

            15.1.1.2. Product Portfolio

            15.1.1.3. Profitability by Market Segments

            15.1.1.4. Sales Footprint

            15.1.1.5. Strategy Overview

                15.1.1.5.1. Marketing Strategy

        15.1.2. Navigenics

            15.1.2.1. Overview

            15.1.2.2. Product Portfolio

            15.1.2.3. Profitability by Market Segments

            15.1.2.4. Sales Footprint

            15.1.2.5. Strategy Overview

                15.1.2.5.1. Marketing Strategy

        15.1.3. deCODEme

            15.1.3.1. Overview

            15.1.3.2. Product Portfolio

            15.1.3.3. Profitability by Market Segments

            15.1.3.4. Sales Footprint

            15.1.3.5. Strategy Overview

                15.1.3.5.1. Marketing Strategy

        15.1.4. Color Genomics, Inc

            15.1.4.1. Overview

            15.1.4.2. Product Portfolio

            15.1.4.3. Profitability by Market Segments

            15.1.4.4. Sales Footprint

            15.1.4.5. Strategy Overview

                15.1.4.5.1. Marketing Strategy

        15.1.5. Personal Genome Diagnostics, Inc.

            15.1.5.1. Overview

            15.1.5.2. Product Portfolio

            15.1.5.3. Profitability by Market Segments

            15.1.5.4. Sales Footprint

            15.1.5.5. Strategy Overview

                15.1.5.5.1. Marketing Strategy

        15.1.6. Counsyl, Inc.

            15.1.6.1. Overview

            15.1.6.2. Product Portfolio

            15.1.6.3. Profitability by Market Segments

            15.1.6.4. Sales Footprint

            15.1.6.5. Strategy Overview

                15.1.6.5.1. Marketing Strategy

        15.1.7. Quest Diagnostics,

            15.1.7.1. Overview

            15.1.7.2. Product Portfolio

            15.1.7.3. Profitability by Market Segments

            15.1.7.4. Sales Footprint

            15.1.7.5. Strategy Overview

                15.1.7.5.1. Marketing Strategy

        15.1.8. Gene By Gene, Ltd.

            15.1.8.1. Overview

            15.1.8.2. Product Portfolio

            15.1.8.3. Profitability by Market Segments

            15.1.8.4. Sales Footprint

            15.1.8.5. Strategy Overview

                15.1.8.5.1. Marketing Strategy

        15.1.9. aboratory Corporation of America® Holdings

            15.1.9.1. Overview

            15.1.9.2. Product Portfolio

            15.1.9.3. Profitability by Market Segments

            15.1.9.4. Sales Footprint

            15.1.9.5. Strategy Overview

                15.1.9.5.1. Marketing Strategy

        15.1.10. mapmygenome.in

            15.1.10.1. Overview

            15.1.10.2. Product Portfolio

            15.1.10.3. Profitability by Market Segments

            15.1.10.4. Sales Footprint

            15.1.10.5. Strategy Overview

                15.1.10.5.1. Marketing Strategy

        15.1.11. Positive Bioscience, Inc

            15.1.11.1. Overview

            15.1.11.2. Product Portfolio

            15.1.11.3. Profitability by Market Segments

            15.1.11.4. Sales Footprint

            15.1.11.5. Strategy Overview

              15.1.11.5.1. Marketing Strategy

16. Assumptions & Acronyms Used

17. Research Methodology

Don't pay for what you don't need

Customize your report by selecting specific countries or regions and save 30%!

List of Tables

Table 1: Global Personal Genome Testing Market Value (US$ Mn) Forecast by Region, 2017-2032

Table 2: Global Personal Genome Testing Market Value (US$ Mn) Forecast by Application, 2017-2032

Table 3: Global Personal Genome Testing Market Value (US$ Mn) Forecast by Product Type, 2017-2032

Table 4: North America Personal Genome Testing Market Value (US$ Mn) Forecast by Country, 2017-2032

Table 5: North America Personal Genome Testing Market Value (US$ Mn) Forecast by Application, 2017-2032

Table 6: North America Personal Genome Testing Market Value (US$ Mn) Forecast by Product Type, 2017-2032

Table 7: Latin America Personal Genome Testing Market Value (US$ Mn) Forecast by Country, 2017-2032

Table 8: Latin America Personal Genome Testing Market Value (US$ Mn) Forecast by Application, 2017-2032

Table 9: Latin America Personal Genome Testing Market Value (US$ Mn) Forecast by Product Type, 2017-2032

Table 10: Europe Personal Genome Testing Market Value (US$ Mn) Forecast by Country, 2017-2032

Table 11: Europe Personal Genome Testing Market Value (US$ Mn) Forecast by Application, 2017-2032

Table 12: Europe Personal Genome Testing Market Value (US$ Mn) Forecast by Product Type, 2017-2032

Table 13: Asia Pacific Personal Genome Testing Market Value (US$ Mn) Forecast by Country, 2017-2032

Table 14: Asia Pacific Personal Genome Testing Market Value (US$ Mn) Forecast by Application, 2017-2032

Table 15: Asia Pacific Personal Genome Testing Market Value (US$ Mn) Forecast by Product Type, 2017-2032

Table 16: MEA Personal Genome Testing Market Value (US$ Mn) Forecast by Country, 2017-2032

Table 17: MEA Personal Genome Testing Market Value (US$ Mn) Forecast by Application, 2017-2032

Table 18: MEA Personal Genome Testing Market Value (US$ Mn) Forecast by Product Type, 2017-2032
Sabyasachi Ghosh
Sabyasachi Ghosh

Principal Consultant

Talk to Analyst

Find your sweet spots for generating winning opportunities in this market.

List of Charts

Figure 1: Global Personal Genome Testing Market Value (US$ Mn) by Application, 2022-2032

Figure 2: Global Personal Genome Testing Market Value (US$ Mn) by Product Type, 2022-2032

Figure 3: Global Personal Genome Testing Market Value (US$ Mn) by Region, 2022-2032

Figure 4: Global Personal Genome Testing Market Value (US$ Mn) Analysis by Region, 2017-2032

Figure 5: Global Personal Genome Testing Market Value Share (%) and BPS Analysis by Region, 2022-2032

Figure 6: Global Personal Genome Testing Market Y-o-Y Growth (%) Projections by Region, 2022-2032

Figure 7: Global Personal Genome Testing Market Value (US$ Mn) Analysis by Application, 2017-2032

Figure 8: Global Personal Genome Testing Market Value Share (%) and BPS Analysis by Application, 2022-2032

Figure 9: Global Personal Genome Testing Market Y-o-Y Growth (%) Projections by Application, 2022-2032

Figure 10: Global Personal Genome Testing Market Value (US$ Mn) Analysis by Product Type, 2017-2032

Figure 11: Global Personal Genome Testing Market Value Share (%) and BPS Analysis by Product Type, 2022-2032

Figure 12: Global Personal Genome Testing Market Y-o-Y Growth (%) Projections by Product Type, 2022-2032

Figure 13: Global Personal Genome Testing Market Attractiveness by Application, 2022-2032

Figure 14: Global Personal Genome Testing Market Attractiveness by Product Type, 2022-2032

Figure 15: Global Personal Genome Testing Market Attractiveness by Region, 2022-2032

Figure 16: North America Personal Genome Testing Market Value (US$ Mn) by Application, 2022-2032

Figure 17: North America Personal Genome Testing Market Value (US$ Mn) by Product Type, 2022-2032

Figure 18: North America Personal Genome Testing Market Value (US$ Mn) by Country, 2022-2032

Figure 19: North America Personal Genome Testing Market Value (US$ Mn) Analysis by Country, 2017-2032

Figure 20: North America Personal Genome Testing Market Value Share (%) and BPS Analysis by Country, 2022-2032

Figure 21: North America Personal Genome Testing Market Y-o-Y Growth (%) Projections by Country, 2022-2032

Figure 22: North America Personal Genome Testing Market Value (US$ Mn) Analysis by Application, 2017-2032

Figure 23: North America Personal Genome Testing Market Value Share (%) and BPS Analysis by Application, 2022-2032

Figure 24: North America Personal Genome Testing Market Y-o-Y Growth (%) Projections by Application, 2022-2032

Figure 25: North America Personal Genome Testing Market Value (US$ Mn) Analysis by Product Type, 2017-2032

Figure 26: North America Personal Genome Testing Market Value Share (%) and BPS Analysis by Product Type, 2022-2032

Figure 27: North America Personal Genome Testing Market Y-o-Y Growth (%) Projections by Product Type, 2022-2032

Figure 28: North America Personal Genome Testing Market Attractiveness by Application, 2022-2032

Figure 29: North America Personal Genome Testing Market Attractiveness by Product Type, 2022-2032

Figure 30: North America Personal Genome Testing Market Attractiveness by Country, 2022-2032

Figure 31: Latin America Personal Genome Testing Market Value (US$ Mn) by Application, 2022-2032

Figure 32: Latin America Personal Genome Testing Market Value (US$ Mn) by Product Type, 2022-2032

Figure 33: Latin America Personal Genome Testing Market Value (US$ Mn) by Country, 2022-2032

Figure 34: Latin America Personal Genome Testing Market Value (US$ Mn) Analysis by Country, 2017-2032

Figure 35: Latin America Personal Genome Testing Market Value Share (%) and BPS Analysis by Country, 2022-2032

Figure 36: Latin America Personal Genome Testing Market Y-o-Y Growth (%) Projections by Country, 2022-2032

Figure 37: Latin America Personal Genome Testing Market Value (US$ Mn) Analysis by Application, 2017-2032

Figure 38: Latin America Personal Genome Testing Market Value Share (%) and BPS Analysis by Application, 2022-2032

Figure 39: Latin America Personal Genome Testing Market Y-o-Y Growth (%) Projections by Application, 2022-2032

Figure 40: Latin America Personal Genome Testing Market Value (US$ Mn) Analysis by Product Type, 2017-2032

Figure 41: Latin America Personal Genome Testing Market Value Share (%) and BPS Analysis by Product Type, 2022-2032

Figure 42: Latin America Personal Genome Testing Market Y-o-Y Growth (%) Projections by Product Type, 2022-2032

Figure 43: Latin America Personal Genome Testing Market Attractiveness by Application, 2022-2032

Figure 44: Latin America Personal Genome Testing Market Attractiveness by Product Type, 2022-2032

Figure 45: Latin America Personal Genome Testing Market Attractiveness by Country, 2022-2032

Figure 46: Europe Personal Genome Testing Market Value (US$ Mn) by Application, 2022-2032

Figure 47: Europe Personal Genome Testing Market Value (US$ Mn) by Product Type, 2022-2032

Figure 48: Europe Personal Genome Testing Market Value (US$ Mn) by Country, 2022-2032

Figure 49: Europe Personal Genome Testing Market Value (US$ Mn) Analysis by Country, 2017-2032

Figure 50: Europe Personal Genome Testing Market Value Share (%) and BPS Analysis by Country, 2022-2032

Figure 51: Europe Personal Genome Testing Market Y-o-Y Growth (%) Projections by Country, 2022-2032

Figure 52: Europe Personal Genome Testing Market Value (US$ Mn) Analysis by Application, 2017-2032

Figure 53: Europe Personal Genome Testing Market Value Share (%) and BPS Analysis by Application, 2022-2032

Figure 54: Europe Personal Genome Testing Market Y-o-Y Growth (%) Projections by Application, 2022-2032

Figure 55: Europe Personal Genome Testing Market Value (US$ Mn) Analysis by Product Type, 2017-2032

Figure 56: Europe Personal Genome Testing Market Value Share (%) and BPS Analysis by Product Type, 2022-2032

Figure 57: Europe Personal Genome Testing Market Y-o-Y Growth (%) Projections by Product Type, 2022-2032

Figure 58: Europe Personal Genome Testing Market Attractiveness by Application, 2022-2032

Figure 59: Europe Personal Genome Testing Market Attractiveness by Product Type, 2022-2032

Figure 60: Europe Personal Genome Testing Market Attractiveness by Country, 2022-2032

Figure 61: Asia Pacific Personal Genome Testing Market Value (US$ Mn) by Application, 2022-2032

Figure 62: Asia Pacific Personal Genome Testing Market Value (US$ Mn) by Product Type, 2022-2032

Figure 63: Asia Pacific Personal Genome Testing Market Value (US$ Mn) by Country, 2022-2032

Figure 64: Asia Pacific Personal Genome Testing Market Value (US$ Mn) Analysis by Country, 2017-2032

Figure 65: Asia Pacific Personal Genome Testing Market Value Share (%) and BPS Analysis by Country, 2022-2032

Figure 66: Asia Pacific Personal Genome Testing Market Y-o-Y Growth (%) Projections by Country, 2022-2032

Figure 67: Asia Pacific Personal Genome Testing Market Value (US$ Mn) Analysis by Application, 2017-2032

Figure 68: Asia Pacific Personal Genome Testing Market Value Share (%) and BPS Analysis by Application, 2022-2032

Figure 69: Asia Pacific Personal Genome Testing Market Y-o-Y Growth (%) Projections by Application, 2022-2032

Figure 70: Asia Pacific Personal Genome Testing Market Value (US$ Mn) Analysis by Product Type, 2017-2032

Figure 71: Asia Pacific Personal Genome Testing Market Value Share (%) and BPS Analysis by Product Type, 2022-2032

Figure 72: Asia Pacific Personal Genome Testing Market Y-o-Y Growth (%) Projections by Product Type, 2022-2032

Figure 73: Asia Pacific Personal Genome Testing Market Attractiveness by Application, 2022-2032

Figure 74: Asia Pacific Personal Genome Testing Market Attractiveness by Product Type, 2022-2032

Figure 75: Asia Pacific Personal Genome Testing Market Attractiveness by Country, 2022-2032

Figure 76: MEA Personal Genome Testing Market Value (US$ Mn) by Application, 2022-2032

Figure 77: MEA Personal Genome Testing Market Value (US$ Mn) by Product Type, 2022-2032

Figure 78: MEA Personal Genome Testing Market Value (US$ Mn) by Country, 2022-2032

Figure 79: MEA Personal Genome Testing Market Value (US$ Mn) Analysis by Country, 2017-2032

Figure 80: MEA Personal Genome Testing Market Value Share (%) and BPS Analysis by Country, 2022-2032

Figure 81: MEA Personal Genome Testing Market Y-o-Y Growth (%) Projections by Country, 2022-2032

Figure 82: MEA Personal Genome Testing Market Value (US$ Mn) Analysis by Application, 2017-2032

Figure 83: MEA Personal Genome Testing Market Value Share (%) and BPS Analysis by Application, 2022-2032

Figure 84: MEA Personal Genome Testing Market Y-o-Y Growth (%) Projections by Application, 2022-2032

Figure 85: MEA Personal Genome Testing Market Value (US$ Mn) Analysis by Product Type, 2017-2032

Figure 86: MEA Personal Genome Testing Market Value Share (%) and BPS Analysis by Product Type, 2022-2032

Figure 87: MEA Personal Genome Testing Market Y-o-Y Growth (%) Projections by Product Type, 2022-2032

Figure 88: MEA Personal Genome Testing Market Attractiveness by Application, 2022-2032

Figure 89: MEA Personal Genome Testing Market Attractiveness by Product Type, 2022-2032

Figure 90: MEA Personal Genome Testing Market Attractiveness by Country, 2022-2032

Recommendations

Healthcare

Whole Genome Amplification Market

Published : December 2022

Explore Healthcare Insights

View Reports

Personal Genome Testing Market