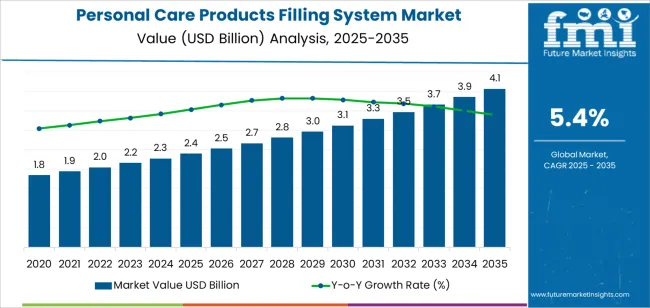
The global personal care products filling system market is projected to reach USD 4.1 billion by 2035, reflecting an absolute increase of USD 1.7 billion over the forecast period. The market is valued at USD 2.4 billion in 2025 and is expected to grow at a CAGR of 5.4%. This growth is driven by increasing demand for personal care products such as skincare, haircare, cosmetics, and hygiene items, as well as the trend towards automation in manufacturing to meet rising production volumes and strict quality standards.
Filling systems are a crucial part of the production line in the personal care industry, ensuring that products like creams, gels, shampoos, lotions, and deodorants are precisely and efficiently filled into packaging. As consumer demand for personal care products rises, manufacturers are focusing on enhancing production efficiency, reducing downtime, and improving product consistency and safety. The demand for advanced filling systems that are capable of handling a wide variety of product formulations and packaging formats is increasing, as manufacturers look to optimize production while ensuring high-quality standards and minimizing waste.
The growth of e-commerce and the shift toward sustainable packaging are also contributing to the expansion of the market. More manufacturers are investing in automated filling systems that can quickly and efficiently scale up production to meet the growing demand for personal care products, particularly in the fast-growing online retail sector. The increased focus on eco-friendly packaging materials and sustainable production practices is pushing companies to adopt more advanced and flexible filling systems that can accommodate new packaging requirements and comply with evolving environmental standards.
Between 2025 and 2030, the personal care products filling system market is projected to grow from USD 2.4 billion to approximately USD 3.0 billion, adding USD 0.6 billion, which accounts for about 35.3% of the total forecasted growth for the decade. This period will be characterized by increasing automation in production lines, as manufacturers seek to boost production efficiency, maintain consistent quality, and respond to the growing demand for diverse product formulations and packaging options.
From 2030 to 2035, the market is expected to expand from approximately USD 3.0 billion to USD 4.1 billion, adding USD 1.1 billion, which constitutes about 64.7% of the overall growth. This phase will be marked by further advancements in filling technology, particularly in the areas of automation, robotics, and the integration of smart technologies that enable real-time monitoring and optimization of filling processes. Increased adoption of sustainable production methods and packaging solutions will also contribute to the growth in the latter part of the forecast period.
| Metric | Value |
|---|---|
| Market Value (2025) | USD 2.4 billion |
| Market Forecast Value (2035) | USD 4.1 billion |
| Forecast CAGR (2025-2035) | 5.4% |
The personal care products filling system market is growing due to the increasing demand for automated and efficient production processes in the cosmetics and personal care industries. These filling systems are essential for accurately dispensing and packaging personal care products, including lotions, shampoos, creams, and gels. As consumer demand for a wide range of personal care products rises, manufacturers are turning to advanced filling systems to increase production capacity, reduce labor costs, and ensure product consistency.
The growing focus on high-quality packaging and product presentation is another factor driving market growth. Filling systems not only ensure precise quantities but also contribute to maintaining the integrity and hygiene of personal care products during the filling process. Manufacturers are increasingly adopting automated filling systems to meet consumer expectations for high-quality, reliable products with attractive packaging.
The trend toward eco-friendly packaging and sustainable manufacturing practices is prompting innovation in filling systems that minimize material waste and energy consumption. As consumers become more eco-conscious, manufacturers are adopting packaging solutions that align with sustainability goals, further fueling the demand for advanced filling systems. Despite challenges such as the high initial investment costs for automated systems, the market is expected to grow as the demand for efficient, scalable, and sustainable production systems in the personal care industry continues to rise.
The market is segmented by type, application, and region. By type, the market is divided into fully-automatic and semi-automatic systems, with fully-automatic systems leading the market. Based on application, the market is categorized into skin care products, hair care products, oral care products, and others. Regionally, the market is divided into Asia Pacific, Europe, North America, and other key regions.
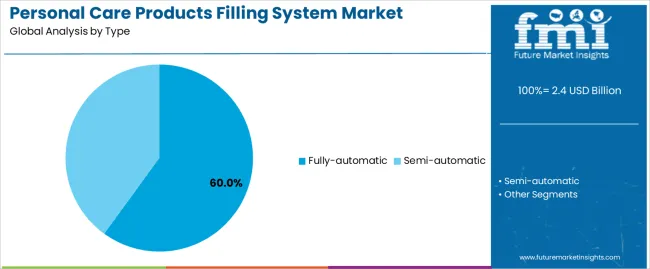
The fully-automatic segment dominates the personal care products filling system market, holding 60% of the total market share. This growth is driven by the increasing demand for high-speed, high-efficiency, and precise filling solutions in the personal care industry. Fully-automatic filling systems are ideal for large-scale production due to their ability to handle large volumes with minimal human intervention, ensuring greater consistency, speed, and accuracy in the manufacturing process. These systems offer the flexibility to accommodate various product formulations and packaging types, making them highly versatile and scalable for personal care product manufacturers.
As consumer demand for personal care products continues to grow, especially in skin care, hair care, and oral care categories, manufacturers are increasingly opting for fully-automatic filling systems to keep up with production demands while maintaining high-quality standards. The automation reduces labor costs, improves operational efficiency, and minimizes human error, making fully-automatic systems the preferred choice for large-scale production in the personal care industry.
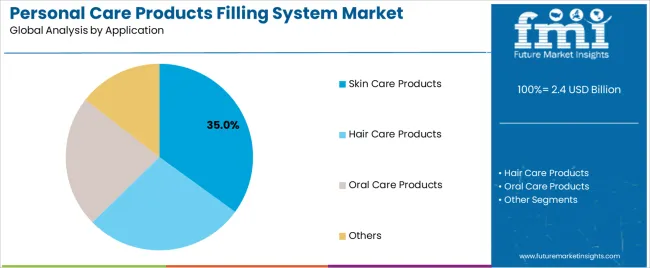
The skin care products application segment leads the personal care products filling system market, accounting for 35% of the total market share. This growth is fueled by the increasing consumer interest in skin care, driven by rising awareness of skincare benefits and growing demand for personalized, high-quality products. As consumers become more focused on health and wellness, skin care products such as lotions, creams, serums, and masks have gained popularity, resulting in a surge in production volumes.
Filling systems, particularly fully-automatic systems, are essential in the manufacturing of these products, ensuring accurate filling, minimal contamination, and consistency across different batches. Manufacturers in the skincare segment are prioritizing automation to meet the growing demand and improve production efficiency. The expansion of skincare product offerings, along with an increase in premium and natural product lines, is expected to continue driving the demand for advanced filling systems, making skin care the largest application segment in the market.
The market is expanding as demand for efficient filling systems in personal‑care manufacturing rises. These systems provide features like high throughput, precision filling of diverse viscosities and formulations, and flexibility for batch changeovers. Key drivers include growth in personal‑care consumption, proliferation of product variants (SKUs), and rising e‑commerce requiring faster production. Restraints stem from high equipment investment, complexity of handling specialty formulations, and pressures from sustainability and regulatory compliance.
Precision filling systems are gaining popularity in personal care manufacturing due to their ability to provide accuracy, hygiene, and versatility in filling various products like lotions, creams, shampoos, and cosmetics. As brands expand their product offerings and introduce limited‑edition variants, flexible filling lines allow for faster changeovers and smaller production runs. Increasing standards for contamination control and clean production are driving demand for automated, closed‑loop systems. The rise of direct‑to‑consumer channels, along with global beauty trends, is also contributing to the growing popularity of these systems, which help manufacturers meet the demand for personalized products while maintaining high standards for product safety and quality.
Technological and operational innovations are fueling growth in the personal care filling system market by enhancing capabilities such as servo‑driven piston filling, real‑time monitoring, and rapid format changes for various packaging types. New systems accommodate different viscosities and incorporate self‑cleaning mechanisms for changing colors and active ingredients, facilitating quick transitions between product batches. Automation, IoT integration, and modular designs have significantly improved efficiency, reduced downtime, and supported small‑batch production. These innovations align with the fast‑paced demands of the personal care market, enabling manufacturers to produce high‑quality products with greater speed and flexibility.
Despite their advantages, several challenges hinder the adoption of advanced filling systems in personal care manufacturing. High upfront capital costs and long payback periods make these systems less accessible for smaller brands or those with limited budgets. The complexity of handling specialized formulations like foams, gels, and serums requires additional setup, testing, and validation, which increases lead time. Regulatory pressures such as ensuring safe ingredient handling and reducing plastic waste add to operational costs. The need for flexibility to accommodate rapid product launches and quick changes between batches can make companies hesitant to invest in systems that may disrupt ongoing operations.
| Country | CAGR (%) |
|---|---|
| China | 7.3% |
| India | 6.8% |
| Germany | 6.2% |
| Brazil | 5.7% |
| USA | 5.1% |
| UK | 4.6% |
| Japan | 4.1% |
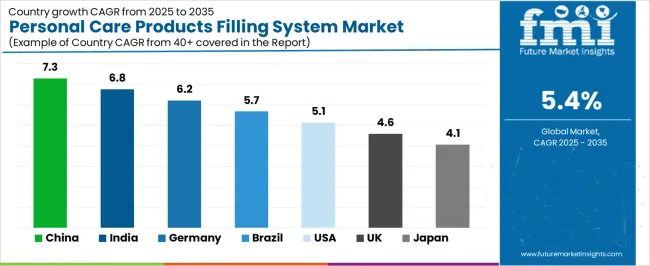
The personal care products filling system market is seeing steady growth globally, with China leading at a 7.3% CAGR, fueled by the country's booming personal care and cosmetics industries, along with increasing automation in production processes. India follows at 6.8%, driven by the rapid expansion of the personal care sector, growing manufacturing capabilities, and rising consumer demand for personal hygiene and skincare products. Germany shows 6.2% growth, supported by its well-established industrial infrastructure, strong demand for high-quality filling systems, and its focus on precision engineering in the cosmetic and personal care manufacturing sectors. Brazil’s market grows at 5.7%, backed by expanding local manufacturing and rising demand for personal care products in both domestic and export markets. The USA shows 5.1% growth, driven by innovation in personal care product formulations and the demand for efficient filling systems in high-volume manufacturing. The UK shows 4.6% growth, driven by the strong presence of beauty and personal care brands, while Japan shows a more moderate 4.1%, supported by steady demand in the cosmetics and skincare industries.
China is leading the personal care products filling system market with a growth rate of 7.3% CAGR. The country’s expanding personal care industry, which includes skincare, haircare, and hygiene products, is driving the demand for advanced filling systems. With a massive population and growing middle class, China’s demand for personal care products is steadily rising, spurring manufacturers to invest in automation and efficient production systems.
The country’s vast manufacturing base, coupled with rising consumer expectations for high-quality personal care products, has increased the need for precise and reliable filling systems. China’s strong domestic production of personal care items, such as shampoos, body lotions, and cosmetics, creates significant demand for filling systems that can handle high production volumes.
China's continuous focus on innovation and technological advancement in the packaging industry further supports the growth of filling systems. As more companies adopt automated solutions for higher efficiency and precision, the demand for advanced filling systems continues to rise. The government’s initiatives to improve manufacturing technologies and its push for sustainability in manufacturing processes also contribute to the market's growth, making China a global leader in personal care product filling systems.
India is experiencing strong growth in the personal care products filling system market, with a 6.8% CAGR, largely driven by the country’s expanding personal care sector and increasing demand for skincare, haircare, and hygiene products. The rise of India’s middle class and growing disposable incomes are leading to greater consumer spending on personal care items, which in turn drives the need for efficient and cost-effective production systems.
The expansion of local manufacturing capabilities is another key factor fueling demand for filling systems in India. As Indian manufacturers aim to meet the rising demand for personal care products, the need for automation in production lines increases. Filling systems play a crucial role in improving productivity and ensuring consistent quality in mass production. India’s push toward becoming a global manufacturing hub, coupled with its strong focus on the "Make in India" initiative, is helping to accelerate the adoption of advanced filling systems. The country’s growing export potential in personal care products, including cosmetics, toiletries, and wellness products, also increases the need for filling systems to meet international quality standards. With these drivers in place, the personal care products filling system market in India is set to continue its steady growth.
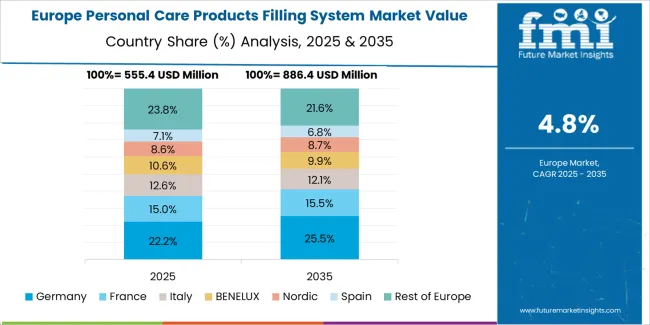
Germany is contributing significantly to the personal care products filling system market, with a 6.2% CAGR, driven by its strong industrial base, precision manufacturing capabilities, and a focus on high-quality, reliable filling systems. Germany’s established presence in the global personal care sector, including skincare, haircare, and cosmetics manufacturing, creates consistent demand for automated filling systems that meet high standards of accuracy, efficiency, and safety.
The country’s robust research and development environment fosters the innovation of advanced filling systems that cater to the needs of personal care manufacturers, including small batch and high-speed production lines. German manufacturers are known for producing filling systems that optimize packaging efficiency and minimize waste, which is essential in the personal care industry where product consistency and quality are paramount.
Germany’s strong regulations in manufacturing and quality control also ensure that filling systems are compliant with international standards, making them highly sought after by global brands. As the demand for more sustainable and eco-friendly packaging solutions in the personal care industry grows, Germany is also leading the way in developing filling systems that contribute to sustainability goals. Germany’s role in the personal care products filling system market is therefore critical, supporting global demand for high-performance filling systems.
Brazil is experiencing steady growth in the personal care products filling system market, with a 5.7% CAGR, driven by the increasing demand for personal care products such as skincare, haircare, and toiletries. As the largest economy in South America, Brazil has a significant market for personal care goods, with rising consumer interest in both domestic and international brands. This growing demand has led manufacturers to invest in advanced filling systems to increase production capacity and meet consumer expectations for product quality.
The rise in Brazil's manufacturing capabilities, particularly in the personal care sector, is a major factor supporting the market for filling systems. As Brazilian manufacturers aim to produce high-quality products in large volumes, they increasingly rely on automated filling systems to streamline production and ensure precision. Brazil’s expanding middle class, along with increasing awareness about beauty and personal care, further fuels the need for efficient production processes.
With the country’s emphasis on improving infrastructure, and the government’s support for local manufacturing, Brazil is becoming an important hub for personal care product production in Latin America. As the demand for personal care products continues to grow, Brazil’s market for filling systems is expected to experience steady growth in the coming years.
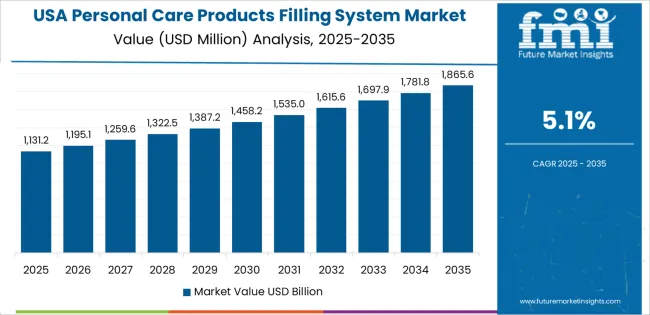
The USA is experiencing moderate growth in the personal care products filling system market, with a 5.1% CAGR, driven by the country’s large consumer base and strong demand for personal care products. The USA’s thriving personal care industry, which includes skin, hair, and health care products, is driving manufacturers to adopt automated filling systems that can handle high volumes while maintaining product consistency and quality.
The increasing trend toward eco-friendly and sustainable packaging solutions in the personal care sector is also influencing the demand for advanced filling systems in the USA. As more brands focus on reducing waste and adopting greener production practices, the need for efficient and environmentally friendly filling systems grows. The rise of natural and organic beauty products, along with the expanding demand for customized and small-batch production, is driving innovation in filling technologies.
The USA’s role as a global leader in personal care product innovation, combined with its focus on automation and high-quality manufacturing standards, ensures a steady demand for advanced filling systems. With the continued expansion of the personal care sector, particularly in beauty and wellness products, the USA remains a key contributor to the global market for filling systems.
The UK is showing steady growth in the personal care products filling system market, with a 4.6% CAGR, driven by the country’s strong presence in the beauty, skincare, and personal care sectors. The UK’s demand for advanced filling systems is influenced by the growth of both domestic brands and global beauty companies operating in the region. As consumer preferences shift toward higher quality and more innovative personal care products, manufacturers are increasingly turning to automated filling systems to improve production efficiency and maintain consistency.
In addition to meeting domestic demand, the UK’s growing role as a key exporter of personal care products in Europe and beyond is contributing to the market for filling systems. The country’s stringent regulatory standards for product quality and safety also drive the adoption of advanced filling systems that can ensure precise dosing and contamination control.
The UK’s increasing focus on sustainability, particularly in the beauty and personal care industries, is also influencing the demand for filling systems that can accommodate eco-friendly packaging solutions. As the personal care market in the UK continues to grow, particularly in skincare and wellness products, the demand for filling systems that can handle high volumes while ensuring efficiency and precision will remain strong.
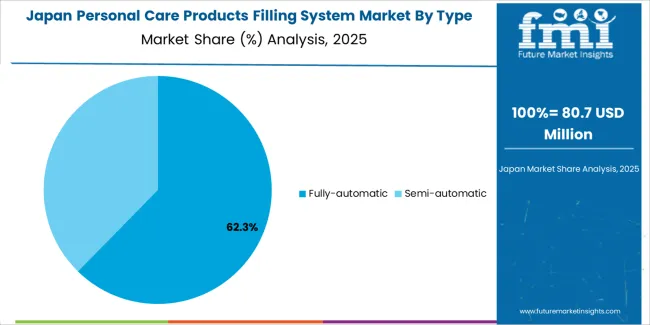
Japan is showing steady growth in the personal care products filling system market, with a 4.1% CAGR, supported by its strong demand for high-quality skincare, cosmetics, and hygiene products. Japan’s advanced technology and precision engineering are key drivers behind the adoption of sophisticated filling systems that offer high accuracy, efficiency, and flexibility in production lines. As the country continues to lead in the development of innovative personal care products, the need for cutting-edge filling systems is growing.
The Japanese market is increasingly focused on sustainability, which drives the demand for filling systems that can handle eco-friendly packaging materials and ensure minimal waste. With the rise of natural and organic skincare products, there is also a growing trend toward small-batch production, which requires filling systems capable of handling variable production volumes while maintaining high standards of quality control.
Japan’s strong consumer interest in personal care, combined with its emphasis on technology, ensures steady demand for efficient and advanced filling systems. As the market for beauty and skincare products continues to expand, Japan’s contribution to the global personal care products filling system market will remain crucial, driven by continuous innovation in production processes and packaging technologies.
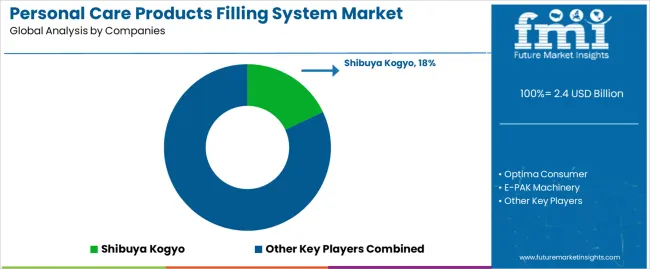
The sound intensity microphone market is specialized, catering to the growing need for precise acoustic measurement tools used in sound intensity testing across various industries, including automotive, aerospace, and industrial applications. HBK leads the market with a 14% share, recognized for its advanced acoustic measurement systems, including sound intensity microphones. HBK’s strong reputation for high-quality instrumentation, precision engineering, and comprehensive solutions for sound and vibration measurement gives it a dominant position in the market.
Other major players include Gras Acoustics, Brüel & Kjær, and PCB Piezotronics, all of which are highly regarded for their expertise in the field of sound measurement. Gras Acoustics is known for providing innovative and reliable sound intensity microphones used in diverse testing environments, from automotive acoustics to environmental noise analysis. Brüel & Kjær offers a broad range of advanced measurement equipment, including precision microphones and systems designed for high-accuracy sound intensity analysis. PCB Piezotronics focuses on delivering sound intensity microphones and measurement solutions that meet the needs of both industrial and scientific sectors.
Companies like 01dB (Acoem Group), Microflown Technologies, and Norsonic contribute to the market with specialized products that integrate cutting-edge technologies for advanced sound intensity testing. ACO Pacific, Casella, and Sinus Messtechnik are also key players, providing high-quality microphones and measurement solutions designed for acoustic testing in professional and research settings. ONO SOKKI rounds out the competition with its focus on precision measurement instruments for sound intensity and other acoustical properties.
The competition in this market is driven by advancements in acoustic testing technology, with a strong emphasis on accuracy, reliability, and ease of use in various environments. As demand for high-precision sound measurement tools increases, companies continue to innovate, providing high-performance microphones that meet evolving industry requirements.
| Items | Values |
|---|---|
| Quantitative Units (2025) | USD 2.4 billion |
| Type | Fully-automatic, Semi-automatic |
| Application | Skin Care Products, Hair Care Products, Oral Care Products, Others |
| Regions Covered | Asia Pacific, Europe, North America, Latin America, Middle East & Africa |
| Countries Covered | China, Japan, South Korea, India, Australia & New Zealand, ASEAN, Rest of Asia Pacific, Germany, United Kingdom, France, Italy, Spain, Nordic, BENELUX, Rest of Europe, United States, Canada, Mexico, Brazil, Chile, Rest of Latin America, Kingdom of Saudi Arabia, Other GCC Countries, Turkey, South Africa, Other African Union, Rest of Middle East & Africa |
| Key Companies Profiled | Shibuya Kogyo, Optima Consumer, E PAK Machinery, CDA, Mespack, Schubert Group, VKPAK, All Fill, APACKS, DTM Packaging, Krones, Inline Filling Systems, Groninger, Volumetric Technologies, Serac, IMA Group, ProSys, Filamatic, Medpak Solutions, Liquid Packaging Solutions |
| Additional Attributes | Dollar sales by type and application categories, market growth trends, market adoption by classification and application segments, regional adoption trends, competitive landscape, advancements in filling system technologies for personal care products, integration with packaging and manufacturing processes. |
The global personal care products filling system market is estimated to be valued at USD 2.4 billion in 2025.
The market size for the personal care products filling system market is projected to reach USD 4.1 billion by 2035.
The personal care products filling system market is expected to grow at a 5.4% CAGR between 2025 and 2035.
The key product types in personal care products filling system market are fully-automatic and semi-automatic.
In terms of application, skin care products segment to command 35.0% share in the personal care products filling system market in 2025.


Our Research Products

The "Full Research Suite" delivers actionable market intel, deep dives on markets or technologies, so clients act faster, cut risk, and unlock growth.

The Leaderboard benchmarks and ranks top vendors, classifying them as Established Leaders, Leading Challengers, or Disruptors & Challengers.

Locates where complements amplify value and substitutes erode it, forecasting net impact by horizon

We deliver granular, decision-grade intel: market sizing, 5-year forecasts, pricing, adoption, usage, revenue, and operational KPIs—plus competitor tracking, regulation, and value chains—across 60 countries broadly.

Spot the shifts before they hit your P&L. We track inflection points, adoption curves, pricing moves, and ecosystem plays to show where demand is heading, why it is changing, and what to do next across high-growth markets and disruptive tech

Real-time reads of user behavior. We track shifting priorities, perceptions of today’s and next-gen services, and provider experience, then pace how fast tech moves from trial to adoption, blending buyer, consumer, and channel inputs with social signals (#WhySwitch, #UX).

Partner with our analyst team to build a custom report designed around your business priorities. From analysing market trends to assessing competitors or crafting bespoke datasets, we tailor insights to your needs.
Supplier Intelligence
Discovery & Profiling
Capacity & Footprint
Performance & Risk
Compliance & Governance
Commercial Readiness
Who Supplies Whom
Scorecards & Shortlists
Playbooks & Docs
Category Intelligence
Definition & Scope
Demand & Use Cases
Cost Drivers
Market Structure
Supply Chain Map
Trade & Policy
Operating Norms
Deliverables
Buyer Intelligence
Account Basics
Spend & Scope
Procurement Model
Vendor Requirements
Terms & Policies
Entry Strategy
Pain Points & Triggers
Outputs
Pricing Analysis
Benchmarks
Trends
Should-Cost
Indexation
Landed Cost
Commercial Terms
Deliverables
Brand Analysis
Positioning & Value Prop
Share & Presence
Customer Evidence
Go-to-Market
Digital & Reputation
Compliance & Trust
KPIs & Gaps
Outputs
Full Research Suite comprises of:
Market outlook & trends analysis
Interviews & case studies
Strategic recommendations
Vendor profiles & capabilities analysis
5-year forecasts
8 regions and 60+ country-level data splits
Market segment data splits
12 months of continuous data updates
DELIVERED AS:
PDF EXCEL ONLINE
Personal Fitness Training Software Market Size and Share Forecast Outlook 2025 to 2035
Personal Protective Equipment Market Size and Share Forecast Outlook 2025 to 2035
Personality Assessment Solution Market Size and Share Forecast Outlook 2025 to 2035
Personalized Immunotherapy Market Size and Share Forecast Outlook 2025 to 2035
Personal Navigation Devices Market Size and Share Forecast Outlook 2025 to 2035
Personal Genome Testing Market Size and Share Forecast Outlook 2025 to 2035
Personal Watercraft Jet Ski Market Size and Share Forecast Outlook 2025 to 2035
Personalized Packaging Market Size and Share Forecast Outlook 2025 to 2035
Personalized Toys Market Size and Share Forecast Outlook 2025 to 2035
Personalized Nutrition Market - Size, Share, and Forecast Outlook 2025 to 2035
Personal Watercraft Market Growth - Trends & Forecast 2025 to 2035
Personal Mobility Devices Market Analysis - Trends, Growth & Forecast 2025 to 2035
Personalized Beauty Devices Market Trends - Growth & Forecast 2025 to 2035
Personal CRM Market Report - Growth & Forecast 2025 to 2035
Personalized Medicine Market is segmented by Personalized Medicine Diagnostics, Medicine Therapeutics, and Medical Care from 2025 to 2035
Personal Fitness Trainer Market - Trends, Growth & Forecast 2025 to 2035
Personalized Home Decor Market Insights & Forecast 2024-2034
Personal Protective Gloves Market
Personal Protective Equipment Packaging Market
Personalized Orthopaedic Implant Market

Thank you!
You will receive an email from our Business Development Manager. Please be sure to check your SPAM/JUNK folder too.
Chat With
MaRIA